Abstract
IMPORTANCE: Histologic classification of colorectal polyps plays a critical role in screening for colorectal cancer and care of affected patients. An accurate and automated algorithm for the classification of colorectal polyps on digitized histopathologic slides could benefit practitioners and patients. OBJECTIVE: To evaluate the performance and generalizability of a deep neural network for colorectal polyp classification on histopathologic slide images using a multi-institutional data set. DESIGN, SETTING, AND PARTICIPANTS: This prognostic study used histopathologic slides collected from January 1, 2016, to June 31, 2016, from Dartmouth-Hitchcock Medical Center, Lebanon, New Hampshire, with 326 slides used for training, 157 slides for an internal data set, and 25 for a validation set. For the external data set, 238 slides for 179 distinct patients were obtained from 24 institutions across 13 US states. Data analysis was performed from April 9 to November 23, 2019. MAIN OUTCOMES AND MEASURES: Accuracy, sensitivity, and specificity of the model to classify 4 major colorectal polyp types: tubular adenoma, tubulovillous or villous adenoma, hyperplastic polyp, and sessile serrated adenoma. Performance was compared with that of local pathologists' at the point of care identified from corresponding pathology laboratories. RESULTS: For the internal evaluation on the 157 slides with ground truth labels from 5 pathologists, the deep neural network had a mean accuracy of 93.5% (95% CI, 89.6%-97.4%) compared with local pathologists' accuracy of 91.4% (95% CI, 87.0%-95.8%). On the external test set of 238 slides with ground truth labels from 5 pathologists, the deep neural network achieved an accuracy of 87.0% (95% CI, 82.7%-91.3%), which was comparable with local pathologists' accuracy of 86.6% (95% CI, 82.3%-90.9%). CONCLUSIONS AND RELEVANCE: The findings suggest that this model may assist pathologists by improving the diagnostic efficiency, reproducibility, and accuracy of colorectal cancer screenings.
✨ Fluorophores
🧪 Sample Preparation
🏭 Microscope Brands
💻 Software Details
🏛️ Research Organizations (ROR)
Affiliated research institutions:
📋 Methods
Data Collection
This prognostic study used histopathologic slides from Dartmouth-Hitchcock Medical Center (DHMC), a tertiary academic care center in Lebanon, New Hampshire, to train a deep neural network for colorectal polyp classification. Internal and external data sets of hematoxylin and eosin–stained, formalin-fixed, paraffin-embedded colorectal polyp, whole-slide images were collected. Each of these slides could contain 1 or more tissue section or polyp. This study and the use of human participant data in this project were approved by the Dartmouth-Hitchcock Health Institutional Review Board with a waiver of informed consent. The conducted research reported in this article is in accordance with this approved Dartmouth-Hitchcock Health Institutional Review Board protocol and the World Medical Association Declaration of Helsinki on Ethical Principles for Medical Research Involving Human Subjects. 19 In addition, the study followed the Standards for Reporting of Diagnostic Accuracy ( STARD ) reporting guideline. 20 The internal data set was collected from January 1, 2016, to June 31, 2016, at DHMC. This data set included 508 slides from the 4 most common polyp types according to local diagnoses parsed from pathology reports: tubular adenoma, tubulovillous or villous adenoma, hyperplastic polyp, and sessile serrated adenoma. The slides were scanned (Aperio AT2, Leica Biosystems) at 40× resolution (0.25-μm pixel −1 ) at DHMC. In this internal data set, each whole-slide image was from a different patient and colonoscopy procedure. We partitioned these slides into a training set of 326 slides, a validation set of 25 slides, and an internal test set of 157 slides. The distribution of polyp types was balanced in the validation and internal test sets, whereas slides were oversampled for hyperplastic polyps and sessile serrated adenomas in the training set to improve model training for these classes ( Figure 1 ). Figure 1.
Show full methods section
Data Collection
This prognostic study used histopathologic slides from Dartmouth-Hitchcock Medical Center (DHMC), a tertiary academic care center in Lebanon, New Hampshire, to train a deep neural network for colorectal polyp classification. Internal and external data sets of hematoxylin and eosin–stained, formalin-fixed, paraffin-embedded colorectal polyp, whole-slide images were collected. Each of these slides could contain 1 or more tissue section or polyp. This study and the use of human participant data in this project were approved by the Dartmouth-Hitchcock Health Institutional Review Board with a waiver of informed consent. The conducted research reported in this article is in accordance with this approved Dartmouth-Hitchcock Health Institutional Review Board protocol and the World Medical Association Declaration of Helsinki on Ethical Principles for Medical Research Involving Human Subjects. 19 In addition, the study followed the Standards for Reporting of Diagnostic Accuracy ( STARD ) reporting guideline. 20 The internal data set was collected from January 1, 2016, to June 31, 2016, at DHMC. This data set included 508 slides from the 4 most common polyp types according to local diagnoses parsed from pathology reports: tubular adenoma, tubulovillous or villous adenoma, hyperplastic polyp, and sessile serrated adenoma. The slides were scanned (Aperio AT2, Leica Biosystems) at 40× resolution (0.25-μm pixel −1 ) at DHMC. In this internal data set, each whole-slide image was from a different patient and colonoscopy procedure. We partitioned these slides into a training set of 326 slides, a validation set of 25 slides, and an internal test set of 157 slides. The distribution of polyp types was balanced in the validation and internal test sets, whereas slides were oversampled for hyperplastic polyps and sessile serrated adenomas in the training set to improve model training for these classes ( Figure 1 ). Figure 1.
Data Flow Diagram for the Study
We trained the model on an internal training and validation set and then evaluated it on internal and external test sets with multipathologist ground truth diagnoses. Annotated regions of interest in the training set varied in length and width, whereas patches in the validation set were of fixed size and represented classic examples of each polyp type. For the external data set, we collaborated with investigators from a randomized clinical trial on the effect of supplementation with calcium and/or vitamin D for the prevention of colorectal adenomas 21 as well as their network of laboratories. Through this collaboration, we were given access to 1182 whole-slide images along with their diagnoses given by local pathologists. These slides were borrowed from various US pathology laboratories (eTable 1 in the Supplement ) by one of us (E.L.B.) from January 1, 2016, to December 31, 2017, and digitized by scanners (Aperio AT2, Leica Biosystems) at 40× resolution at DHMC (similar to the internal data set) before they were returned to the original laboratories. We randomly sampled up to 95 of these slides for each of 4 polyp types as diagnosed by the local pathologist. Of note, 15 of these randomly selected slides were removed because of poor slide quality as determined by our study’s lead expert pathologist (A.A.S.). In total, the final external validation set comprised 238 slides from 24 different institutions in 13 US states. In this external test set, some of the slides corresponded to the same patients because the 238 slides came from 179 distinct patients. All slides from the internal and external test sets were excluded from model development until final evaluation of the model. Each slide in the data set was the most diagnostic slide for the corresponding patient, and slides from the same patient were not from the same lesion. We did not include any slides with the diagnosis of high-grade dysplasia or adenocarcinoma because we did not have enough samples from these cases in the external validation set. We also did not include normal as a class for whole slides in our study because normal slides are not routinely scanned in the internal or multi-institutional data sets. Moreover, we also did not distinguish regeneration epithelial hyperplasia and inflammatory polyps from hyperplastic polyps and tubular adenomas because of the small number of these cases in our training set. All diagnoses made by DHMC pathologists were based on World Health Organization criteria as of April 2019. 22 Data Annotation The annotation process involved 5 gastrointestinal pathologists (A.A.S., L.J.V., B.R., X.L., M.L.) from the Department of Pathology and Laboratory Medicine at DHMC: 3 (A.A.S., B.R., M.L.) with gastrointestinal pathology fellowship training and 2 (L.J.V., X.L.) who gained gastrointestinal pathology expertise through years of gastrointestinal pathology service. For 157 whole-slide images in the training set, 2 of the gastrointestinal pathologists (A.A.S. and L.J.V.) identified the polyps on the slides and used the Rectlabel 23 annotation tool to manually annotate rectangular bounding boxes around polyps and normal tissue as regions of interest for model training. In total, 3848 regions of interest were identified and labeled as 1 of the 4 polyp classes. We also collected a smaller number of annotations from 25 separate whole-slide images as the validation set for hypermetric tuning of the model. In this validation set, the same 2 pathologists (A.A.S. and L.J.V.) annotated nonoverlapping patches of 224 × 224 pixels (or 448 × 448 μm) of classic examples for each polyp type. Because this data set was used to guide model development, all fixed-size patches were confirmed with high confidence by both pathologists, and patches with disagreements were discarded. For the internal test set, the 5 gastrointestinal pathologists independently and retrospectively made a diagnosis based on each slide as 1 of the 4 polyp types. For this internal set, the local diagnoses given at DHMC may have been from 1 of the 5 study gastrointestinal pathologists, but the original diagnosis and identity of the pathologist at the point of care were hidden during the retrospective annotation phase. For the external test set, the 5 gastrointestinal pathologists from DHMC also retrospectively made diagnoses based on all slides in the test set in the same fashion as for the internal test set. In total, 5 complete sets of diagnoses from gastrointestinal pathologists and the diagnoses given by local pathologists at the point of care were recorded. For both the internal and the external test sets, ground truth diagnoses were assigned by taking the majority vote of the 5 gastrointestinal pathologists. Figure 1 depicts the data flow for the study design. eFigure 1 in the Supplement shows the statistics on polyp types, number of patches, and slide sizes for the internal and external test sets.
Deep Learning Model
In this study, we implemented the deep residual network (ResNet), a neural network architecture that significantly outperformed all other models on the ImageNet and Common Objects in Context image recognition benchmarks. 24 For model training, we applied a sliding window method to the 3848 variable-size regions of interest labeled by pathologists in the training set, extracting approximately 7000 fixed-size 224 × 224-pixel patches per polyp type. Then, we initialized ResNet with the MSRA (Microsoft Research Asia) weight initialization 11 and trained the neural network for 200 epochs with an initial learning rate of 0.001, which decayed by a factor of 0.9 every epoch. Throughout training, we applied standard image augmentation techniques, including rotations and flips as well as color jittering on the brightness, contrast, saturation, and hue of each image. For our final model, we used an ensembled model that comprised 5 ResNets of 18, 34, 50, 101, and 152 layers. Overall, training these networks took approximately 96 hours using a single graphics processing unit (NVIDIA Tesla K40c). Once the model was trained, there was no further modification of the model based on the pathologists’ examination of the results.
Slide-Level Inference
For the deep learning model to infer the overall diagnosis of a whole-slide image, we designed a hierarchical classification algorithm to match the nature of the classification task. Each slide was initially broken down into many patches using a sliding window algorithm, and each patch was classified by the neural network. Using the predicted diagnoses by the neural network for all patches in a given slide, the model first determined whether a polyp was adenomatous (tubular, tubulovillous, or villous) or serrated (hyperplastic or sessile serrated) by comparing the number of predicted patches for the adenomatous and serrated types. Adenomatous polyps with more than a certain amount of tubulovillous or villous tissue (>30%) were classified as overall tubulovillous or villous adenoma, whereas the remaining polyps were classified as tubular adenoma. For serrated polyps, the algorithm classified polyps with above a certain amount of sessile serrated patches (>1.5%) as overall sessile serrated adenomas and the remaining polyps as hyperplastic. All thresholds were determined using a grid search over the internal training set. The hierarchical nature of the inference heuristic allowed us to imitate the schema used by pathologists for this classification task without training a separate machine learning classifier.
Evaluation
For final evaluation, we compared the performance of the model with that of local pathologists originally made at the point of care on the internal test set and the multi-institutional external test set. Local pathologist performance measures were averaged over all samples because information about individual pathologists’ performances were anonymized. To assess the quality of annotations in our study, we measured the agreement of our gastrointestinal pathologists in terms of multiclass Cohen κ. The application of the final model on a whole-slide image in the test sets took less than a mean of 60 seconds using a single graphics processing unit (NVIDIA Tesla K40c). For the model’s classifications, we calculated accuracy, sensitivity, and specificity in comparison with ground truth diagnoses and compared these metrics with those of local pathologists. Furthermore, we calculated confusion matrixes for local pathologists and the model and conducted appropriate error analysis.
Statistical Analysis
The algorithms in this study were implemented in Python software, version 3.6 (Python Software Foundation). We used OpenSlide software, version 3.4.1 (Carnegie Mellon University School of Computer Science) to convert the digitized image format and PyTorch software, version 0.4 (Facebook’s AI Research Lab) for training the deep neural network models. The statistical analysis and 95% CIs were calculated using the Statistics, version 3.4 library in Python. The source code for this study is publicly available. 25 We used a 2-tailed t test for proportions with a significance level of 2-sided P ≤ .05 to compare the performance of local pathologists and the model on the internal and external test sets. R, version 3.3.3 (R Foundation for Statistical Computing) was used for the statistical analysis in this study. Data analysis was performed from April 9 to November 23, 2019.
📊 Figures
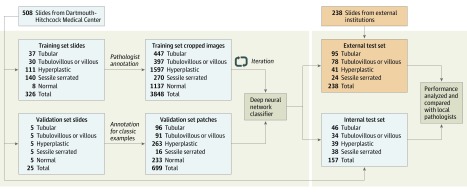
Figure 1.
Data Flow Diagram for the Study
We trained the model on an internal training and validation set and then evaluated it on internal and external test sets with multipathologist ground truth diagnoses. Annotated regions of interest in ...
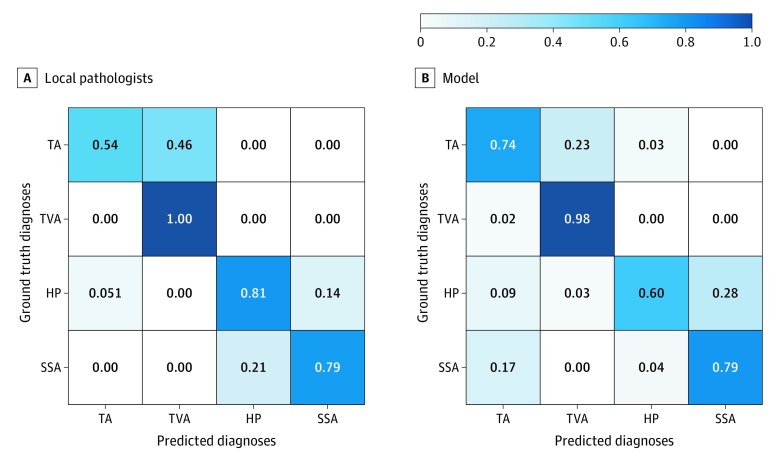
Figure 2.
Confusion Matrixes for Local Pathologistsu2019 Diagnoses Given at the Point of Care and the Modelu2019s Predicted Diagnoses in Comparison With Multipathologist Ground Truth Diagnoses for the External Test Set
Each cell in the confusion matrix is the agreement ratio between multipathologist ground truth labels and local pathologistsu2019 or the modelu2019s diagnoses. HP indicates hyperplastic polyp; SSA, se...
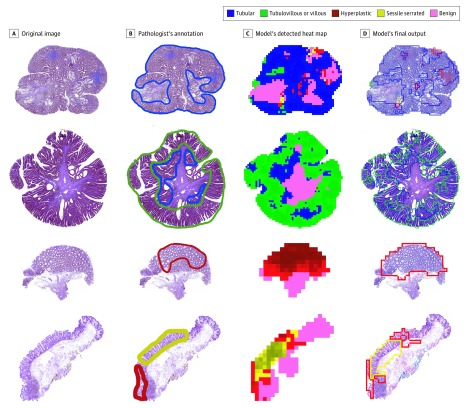
Figure 3.
Visualization of the Classifications of the Deep Neural Network Model
In the modelu2019s detected heat map, the higher confidence predictions are shown in darker color. The modelu2019s final output highlights precancerous lesions that can potentially be used to aid path...
Figure images are served from the NIH/NLM PubMed Central Open Access Subset or Europe PMC; copyright remains with the publishers and authors.
💬 Discussion
0 commentsNo comments yet. Be the first to start a discussion!
Leave a Comment