Abstract
Aneuploidy refers to losses and/or gains of individual chromosomes from the normal chromosome set. The resulting gene dosage imbalance has a noticeable affect on the phenotype, as illustrated by aneuploid syndromes, including Down syndrome in humans, and by human solid tumor cells, which are highly aneuploid. Although the phenotypic manifestations of aneuploidy are usually apparent, information about the underlying alterations in structure, expression, and interphase organization of unbalanced chromosome sets is still sparse. Plants generally tolerate aneuploidy better than animals, and, through colchicine treatment and breeding strategies, it is possible to obtain inbred sibling plants with different numbers of chromosomes. This possibility, combined with the genetic and genomics tools available for Arabidopsis thaliana, provides a powerful means to assess systematically the molecular and cytological consequences of aberrant numbers of specific chromosomes. Here, we report on the generation of Arabidopsis plants in which chromosome 5 is present in triplicate. We compare the global transcript profiles of normal diploids and chromosome 5 trisomics, and assess genome integrity using array comparative genome hybridization. We use live cell imaging to determine the interphase 3D arrangement of transgene-encoded fluorescent tags on chromosome 5 in trisomic and triploid plants. The results indicate that trisomy 5 disrupts gene expression throughout the genome and supports the production and/or retention of truncated copies of chromosome 5. Although trisomy 5 does not grossly distort the interphase arrangement of fluorescent-tagged sites on chromosome 5, it may somewhat enhance associations between transgene alleles. Our analysis reveals the complex genomic changes that can occur in aneuploids and underscores the importance of using multiple experimental approaches to investigate how chromosome numerical changes condition abnormal phenotypes and progressive genome instability.
🔬 Techniques
🧬 Organisms
✨ Fluorophores
🧪 Sample Preparation
🧪 Reagent Suppliers
💾 Data Repositories
🏛️ Research Organizations (ROR)
Affiliated research institutions:
📋 Methods
Plant Material The plant material in all experiments was Arabidopsis thaliana landrace Col-0 (the accession used for the design of the ATH1 array). The transgenic line with YFP and DsRed fluorescent tags on chromosome 5 was described previously [21] . Seeds were germinated on sterile, solid Murashige and Skoog medium in plastic petri dishes. Root nuclei in living seedlings were monitored for YFP and DsRed fluorescence signals as detailed in previous reports [21] , [22] . Seedlings were then transferred to pots containing a mixture of Huminsubstrat N3 and Vermiculit Nr.2 (2∶1 v/v) (purchased from a local supplier), and placed in a culture room with natural light (3000 lux). The photoperiod was 16 h and temperature was maintained at 23°C. Single leaves were cut from the plants at a stage of approximately ten rosette leaves (>1 cm in length), except for plants with extreme aberrant phenotypes, which late were found to contain an extra copy of chromosome 1. The first cut leaf was selected for RNA and the second for DNA isolation in order to minimize wounding effects. Production of Tetraploids, Metaphase, and Interphase Chromosome Analysis Seedlings were treated with colchicine to produce tetraploid progeny according to an unpublished protocol (Ramon Angel Torres Ruiz, personal communication). Metaphase chromosome counts were performed using pistil material as described in protocols 5.2 and 5.3 in a previous publication [35] . Inter-allelic distances and 3D arrangements of fluorescent tagged sites on chromosome 5 in root interphase nuclei of living, untreated seedlings were determined using fluorescence microscopy as described previously [21] , [22] . The tagged sites harbor transgene complexes that encode repressor protein-fluorescent protein fusions proteins (either Tet-YFP or DsRed-LacI) as well as arrays of either tet or lac operator repeats, to which the respective repressor protein-fluorescent protein fusion protein can bind [21] , [22] . Comparative Genome Hybridization with Microarrays Isolation of genomic DNA (DNeasy mini kit, Qiagen, Hilden, Germany), biotin labelling of DNA (BioPrime DNA labelling, Invitrogen, Lofer, Austria), and gDNA hybridization were performed as described [36] . The DNA concentration was quantified by spectrophotometry (Nanodrop ND-1000; Peqlab, Erlangen, Germany) and adjusted for gDNA hyridization to 15 µg. ATH1 microarrays were scanned with an Affymetrix GC3000 system and analysed with GCOS version 1.4 (Affymetrix, High Wycombe, U.K.). For chromosome copy number variation the disomic transgenic plant, from which all triploid, tetraploid, and trisomic plants were derived, served as the reference microarray. The array signals from the derived plants were scaled in GCOS and compared to the diploid progenitor. Extra chromosomes or chromosomal deletions were then identified after sorting for probe sets with a “change p-value” call “Increase” for supernumerical chromosomes or a “Decrease” call for deletions. In all cases the default settings were chosen. After excluding probe sets matching to several gene models (TAIR7) the remaining probe sets were mapped to the Arabidopsis chromosomes (chromosome map tool at www.arabidopsis.org ). Typically, extra chromosomes are identified by mapping 95% to 98% of probe sets with an “Increase” call to a unique chromosome e.g. chromosome 5 in case of chromosome 5 trisomy.
Show full methods section
Plant Material The plant material in all experiments was Arabidopsis thaliana landrace Col-0 (the accession used for the design of the ATH1 array). The transgenic line with YFP and DsRed fluorescent tags on chromosome 5 was described previously [21] . Seeds were germinated on sterile, solid Murashige and Skoog medium in plastic petri dishes. Root nuclei in living seedlings were monitored for YFP and DsRed fluorescence signals as detailed in previous reports [21] , [22] . Seedlings were then transferred to pots containing a mixture of Huminsubstrat N3 and Vermiculit Nr.2 (2∶1 v/v) (purchased from a local supplier), and placed in a culture room with natural light (3000 lux). The photoperiod was 16 h and temperature was maintained at 23°C. Single leaves were cut from the plants at a stage of approximately ten rosette leaves (>1 cm in length), except for plants with extreme aberrant phenotypes, which late were found to contain an extra copy of chromosome 1. The first cut leaf was selected for RNA and the second for DNA isolation in order to minimize wounding effects. Production of Tetraploids, Metaphase, and Interphase Chromosome Analysis Seedlings were treated with colchicine to produce tetraploid progeny according to an unpublished protocol (Ramon Angel Torres Ruiz, personal communication). Metaphase chromosome counts were performed using pistil material as described in protocols 5.2 and 5.3 in a previous publication [35] . Inter-allelic distances and 3D arrangements of fluorescent tagged sites on chromosome 5 in root interphase nuclei of living, untreated seedlings were determined using fluorescence microscopy as described previously [21] , [22] . The tagged sites harbor transgene complexes that encode repressor protein-fluorescent protein fusions proteins (either Tet-YFP or DsRed-LacI) as well as arrays of either tet or lac operator repeats, to which the respective repressor protein-fluorescent protein fusion protein can bind [21] , [22] . Comparative Genome Hybridization with Microarrays Isolation of genomic DNA (DNeasy mini kit, Qiagen, Hilden, Germany), biotin labelling of DNA (BioPrime DNA labelling, Invitrogen, Lofer, Austria), and gDNA hybridization were performed as described [36] . The DNA concentration was quantified by spectrophotometry (Nanodrop ND-1000; Peqlab, Erlangen, Germany) and adjusted for gDNA hyridization to 15 µg. ATH1 microarrays were scanned with an Affymetrix GC3000 system and analysed with GCOS version 1.4 (Affymetrix, High Wycombe, U.K.). For chromosome copy number variation the disomic transgenic plant, from which all triploid, tetraploid, and trisomic plants were derived, served as the reference microarray. The array signals from the derived plants were scaled in GCOS and compared to the diploid progenitor. Extra chromosomes or chromosomal deletions were then identified after sorting for probe sets with a “change p-value” call “Increase” for supernumerical chromosomes or a “Decrease” call for deletions. In all cases the default settings were chosen. After excluding probe sets matching to several gene models (TAIR7) the remaining probe sets were mapped to the Arabidopsis chromosomes (chromosome map tool at www.arabidopsis.org ). Typically, extra chromosomes are identified by mapping 95% to 98% of probe sets with an “Increase” call to a unique chromosome e.g. chromosome 5 in case of chromosome 5 trisomy.
Mapping
Deletion to Chromosomes Microarrays were normalized and log transformed by the RMAExpress0.5 tool ( http://rmaexpress.bmbolstad.com/ ). The log ratios of the signal values were mapped to their chromosomal position. Data on probe set location was also extracted from TAIR v7 (see microarray data analysis section).
Only probe sets matching to a unique gene model
(TAIR7) were selected.
Quantitative Real-Time PCR Analysis RNA extraction
(RNeasy mini kit, Qiagen, Hilden, Germany) and cDNA synthesis (RevertAid H Minus First strand cDNA synthesis kit, MBI Fermentas, St. Leon-Rot, Germany) were performed as described previously [37] . The cDNA was diluted to 75 µl with DEPC-treated double distilled water, and 2 µl was used in a 20 ul PCR reaction. The mixture was set up with 10 µl of QuantiFast SYBR Green PCR (Qiagen, Hilden, Germany), 2 µl cDNA, and 2 µl of each primer (1 µM final concentration). PCR was performed after a preincubation as suggested by the supplier (95° C for 5 min) by 40 two-step cycles of denaturation at 95° C for 10 s, and annealing/extension at 60° C for 30 s. The comparative threshold cycle (Ct) method was used to determine relative RNA levels (User Bulletin no. 2, Applied Biosystems). GAPC-2 (At1g13440) was chosen as the internal reference gene (see also [38] for a comprehensive analysis of reference genes), and expression levels are relative to a randomly chosen disomic plant. Sequence of the primer sets are shown in Table S3 . Transcriptome Analysis Total RNA was extracted from rosette leaves (>1 cm in length) using an RNeasy mini kit (Qiagen, Hilden, Germany). Transcriptomes were analysed using 1 µg of total RNA as starting material. Targets were prepared with the one-cycle cDNA synthesis kit followed by biotin-labelling with the IVT labelling kit (GeneChip One-cycle target labelling and control reagents, Affymetrix, High Wycombe, U.K.) and hybridized for 16 h as recommended by the supplier (Gene expression analysis manual, Affymetrix). All transcriptome data (CEL and CHP files) were submitted to a public repository database ( http://www.ebi.ac.uk/microarray/ , ArrayExpress accession number: E-MEXP-1454. Microarray Data Analysis Low-Level Analysis and Transforms A total of 19 samples from 15 individual plants (2×2 trisomics|F2, 2×2 disomics|F2, 8 trisomics|F3, 3 disomics|F3 was hybridized to Affymetrix ATH1-type GeneChips and scanned as described above. Low-level CEL-file analysis included re-assignment of probes to a current TAIR genome annotation, removal of probe-sequence specific effects, chip-to-chip normalization, and a robust expression signal summary of probe sets using a multi-chip model to down-weight random outlier probes. The original ATH1 design comprised probe sets for 22,810 transcripts. Probe set size ranged from 8 to 20 probes per target, with a mean of 11.0±0.3. Depending on the target organism, however, the ongoing improvements in genome annotation can considerably affect differential expression estimates for 30–40% of all the targets of an Affymetrix chip [39] . The necessary re-assignment and re-annotation of probes consistent with a current genome annotation (TAIR v7) resulted in 21,089 probe sets (custom assignment v10). Data on transcript chromosomal locations and start and end coordinates were also extracted from TAIR for probe-set annotation. Further examination revealed several probe sets with probes perfectly matching multiple chromosomal locations, which we wanted to exclude for this study. This finally left 20,515 probe sets ranging in size from 3 to 32 probes per target, with a mean of 10.8±1.4. Probe specific effects have been fit using an Empirical Bayes ‘affinities’ model for removing both probe-specific background and adjusting perfect-match signal intensities for probe-specific affinities [40] . Probe level signals were conservatively normalized for different backgrounds and overall hybridization intensities of individual chips using an iterative 20%-trimmed least squares fit of a generative model with additive-multiplicative noise [41] . This approach is robust both to outliers and to systemic large-scale shifts, as could be seen from estimating transform parameters from all data or only from genes not on chromosome 5 (data not shown). The variance-stabilizing generalized log transform for this model was calibrated for asymptotic equivalence to a standard log 2 transformation. We refrained from further transforms in a first examination of data characteristics. As can be seen from Figure 5 the conditions for many popular more aggressive normalization methods (such as quantile–quantile normalization or M(A) -Loess) were not satisfied. Transcript expression estimates were obtained by robust fits of linear multi-chip probe level intensity models [42] . A number of diagnostic plots are provided in the Online Supplement (e.g. pair-wise Q–Q and M(A) , spatial residual trends). We also investigated the effect of alternative normalization options, including standard methods like quantile normalization and specialized approaches like attempting to exploit CGH hybridization signals for normalization. Results corroborate our choice of conservative normalization. See Methods section of Text S1 and the Online Supplement at http://bioinf.boku.ac.at/pub/trisomy2008/ .
Analysis of Differential Expression
For every gene, linear models were fit to obtain a contrast between chromosome 5 trisomic and normal diploids, correctly weighted for unbalanced design and independently for F2 and F3 progeny. We then studied the average contrast for F2 and F3 progeny. In an examination of chromosome-wide trends, instead of the constant increase in expression expected for transcripts on chromosome 5, a clear and strong intensity dependence could be observed, which cannot be explained by biological effects. Figure 5 shows expression change as a function of average expression in a standard M(A) -plot. Transcripts on chromosome 5 are coloured green, and the intensity dependent trend plus/minus standard deviation is plotted in magenta. The trend for other transcripts is shown in orange. Intensity-local trend lines and standard deviations were computed in R by a Loess smoother with span 0.4. The increased expression of transcripts on chromosome 5 becomes clearer with higher average expression ( x -axis), with the trends being separated by 1+1 standard deviations where the lower magenta and the upper orange lines cross. We denote this intensity by A 1+1 , marked by a vertical dashed line. The separation continues to grow with the average intensity, peaks, and then decreases but without falling below the amount at A 1+1 . As a consequence, an analysis of expression changes will be most accurate for A > A 1+1 . For our analysis of trends we therefore focused on this regime. For an analysis of deviations from the average trend of transcripts on chromosome 5, we performed a calibration by subtracting the average trend as fitted by the Loess smoother. Deviations could then be tested as deviations from zero (see Results section of the Online Supplement). We tested for differential expression of each gene applying an Empirical Bayes regularized t -test [43] . Unless mentioned otherwise in the text, p -values used in the generation of lists and graphs were corrected for multiple testing using the conservative approach by Holm [44] , providing strong control of the family wise error rate (FWER), when assessing change, and by the more powerful approach of Benjamini and Yekutieli [45] , providing strong control of the false discovery rate (FDR), in the case of testing for non-change, each with a threshold of 5%, yielding conservative conclusions in either case. Trend estimates used the Benjamini-Yekutieli (BY) approach, considering the 5% upper bound of the FDR to calculate a lower bound of the detected true positive range. For an overview of functional gene categories affected current ‘GOslim’ annotation was extracted from TAIR, v.2007-12-29 [46] , and subset enrichment tested for significance (Fisher's exact test, Holm FWER p 1 cm in length), except for plants with extreme aberrant phenotypes, which late were found to contain an extra copy of chromosome 1. The first cut leaf was selected for RNA and the second for DNA isolation in order to minimize wounding effects.
Supporting Information Figure S1 qRT-PCR of low to moderately expressed genes on chromosome 5. (0.06 MB DOC) Click here for additional data file. Figure S2 qRT-PCR of low expressed genes on chromosome 5. (0.08 MB DOC) Click here for additional data file. Figure S3 Chromosome 5 calibrated cis effects. (0.23 MB DOC) Click here for additional data file. Figure S4 Trans effects on expression of genes on chromosome 2. (0.20 MB DOC) Click here for additional data file. Figure S5 Examples of connected YFP and DsRed dots for measurements of interallelic distances in three dimensions. (0.04 MB PDF) Click here for additional data file. Figure S6 Boxplot of normalized shortest interallelic distance. (0.03 MB DOC) Click here for additional data file. Table S1 List of plants. (0.18 MB DOC) Click here for additional data file. Table S2 Interallelic distance measurements. (0.36 MB DOC) Click here for additional data file. Table S3 Primers. (0.03 MB DOC) Click here for additional data file. Text S1 Supporting information text. (0.27 MB PDF) Click here for additional data file.
📊 Figures
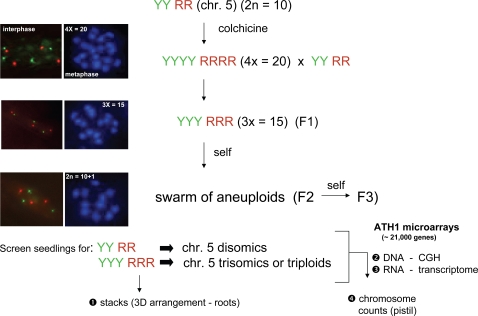
Figure 1
Experimental strategy.
We started with a normal diploid plant that was doubly homozygous for twonfluorescent-tagged sites on chromosome 5: YFP (Y) on the top arm andnDsRed (R) on the bottom arm ( Figure 2A ). Diploid seedli...
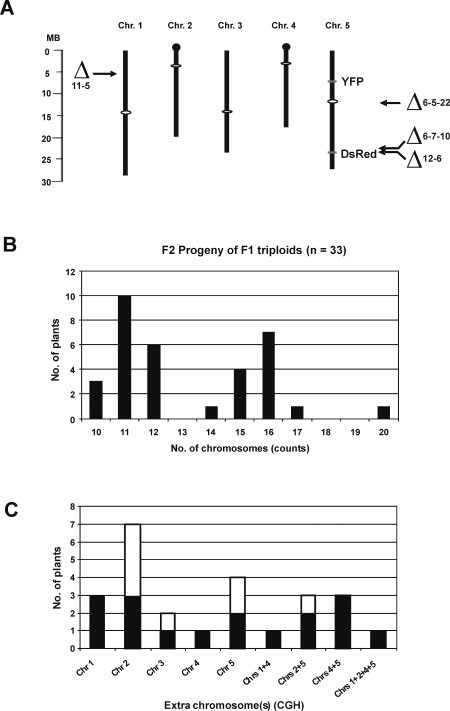
Figure 2
Chromosomal positions of deletions and transgenes, and chromosome constitution of aneuploids.
A: Arabidopsis chromosomes showing approximate sizes innmegabases (MB), positions of centromeres (white ovals), nucleolarnorganizers (black balls), and YFP and DsRed transgene inserts on chromosome 5,...
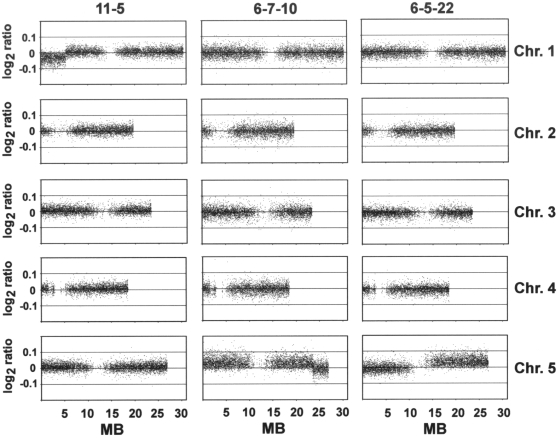
Figure 3
Chromosome breaks in trisomic and triploid plants.
Array CGH detected truncated copies of chromosome 5 in two chromosome 5ntrisomics (6-5-22 [potentially a secondary trisomic ornisochromosome (2)] and 6-7-10), and a chromosome 1 truncationnin a triplo...
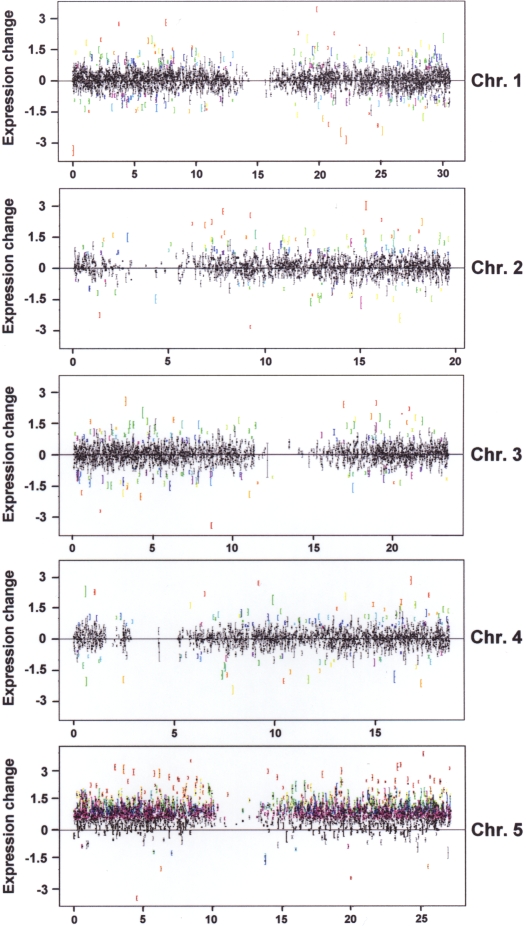
Figure 4
Distribution of significant expression changes across the five Arabidopsis chromosomes.
Each transcript is represented by a mark and error bar. The x -axes correspond to the gene centre locations alongnthe chromosomes, the y -axes show expression change,nwith positive values indicating i...
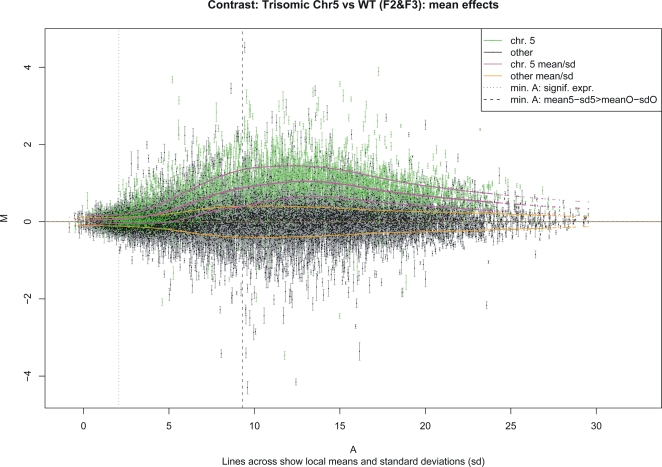
Figure 5
M(A) plot of the average expression differences M between chromosome 5 trisomic plants and disomics ( y -axis) as a function of average expression A ( x -axis).
Transcripts on chromosome 5 are coloured green, and the intensityndependent trend plus/minus standard deviation is plotted in magenta. Thentrend for transcripts on other chromosomes is shown in orange...
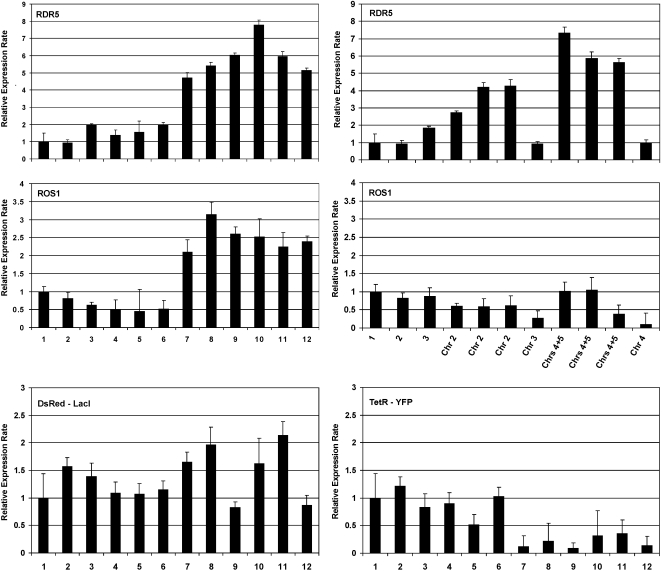
Figure 6
Quantitative RT-PCR.
The relative expression levels of RDR5 and ROS1 were determined in six diploid plants (lanes 1-6;nplants 6-4-2, 6-4-3, 7-2-1, 7-2-2, 7-2-3, 7-2-4) and six chromosome 5ntrisomics (lanes 7u201312; plant...
Figure images are served from the NIH/NLM PubMed Central Open Access Subset or Europe PMC; copyright remains with the publishers and authors.
💬 Discussion
0 commentsNo comments yet. Be the first to start a discussion!
Leave a Comment