Abstract
The genetically encoded fluorescent proteins (FP), used in combination with Forster resonance energy transfer (FRET) microscopy, provide the tools necessary for the direct visualization of protein interactions inside living cells. Typically, the Cerulean and Venus variants of the cyan and yellow FPs are used for FRET studies, but there are limitations to their use. Here, Cerulean and the newly developed monomeric Teal FP (mTFP) are compared as FRET donors for Venus using spectral and fluorescence lifetime measurements from living cells. The results demonstrate that when compared to Cerulean, mTFP has increased brightness, optimal excitation using the standard 458-nm laser line, increased photostability, and improved spectral overlap with Venus. In addition, the two-photon excitation and fluorescence lifetime characteristics are determined for mTFP. Together, these measurements indicate that mTFP is an excellent donor fluorophore for FRET studies, and that its use may improve the detection of interactions involving proteins that are difficult to express, or that need to be produced at low levels in cells.
🔬 Techniques
🔭 Microscopes
💻 Software
✨ Fluorophores
🧪 Sample Preparation
🏭 Microscope Brands
📷 Detectors
🔎 Objectives
💻 Software Details
🏛️ Research Organizations (ROR)
Affiliated research institutions:
📊 Figures
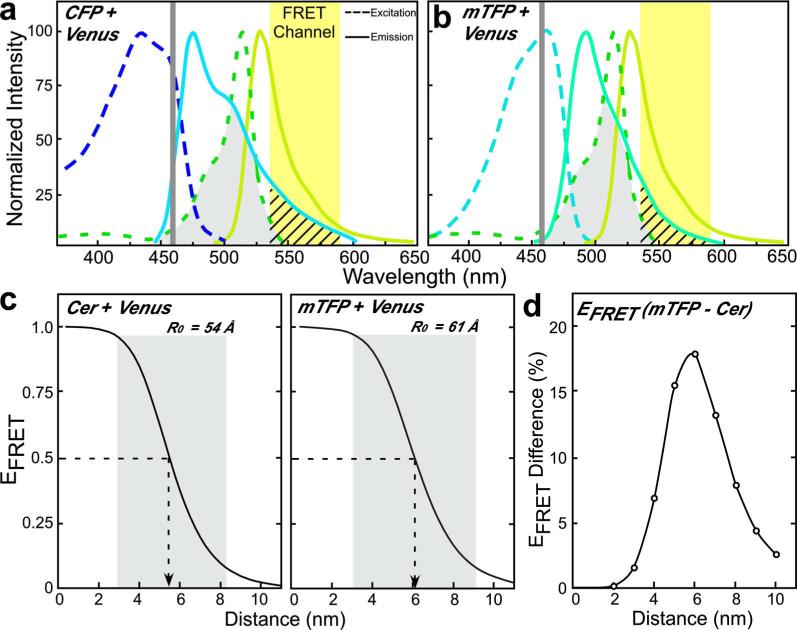
Fig. 1
The spectral overlap of Cerulean or mTFP with Venus is compared. The excitation and emission spectra for (a) CFP or (b) mTFP in combination with Venus are shown, illustrating the spectral overlap (gra...
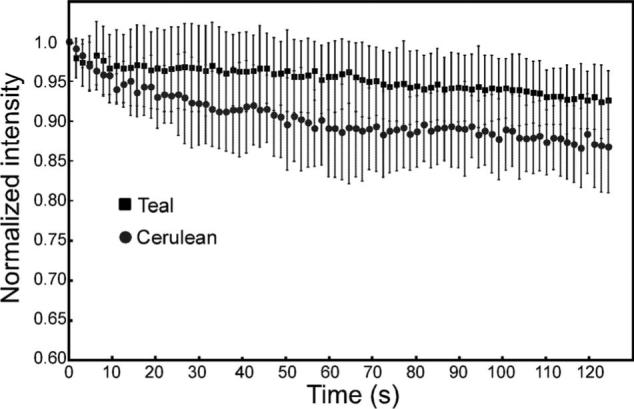
Fig. 2
The photobleaching characteristics of Cerulean or mTFP when illuminated with the 458-nm laser line are compared. Cells that expressed either Cerulean or mTFP were illuminated with the 458-nm laser lin...
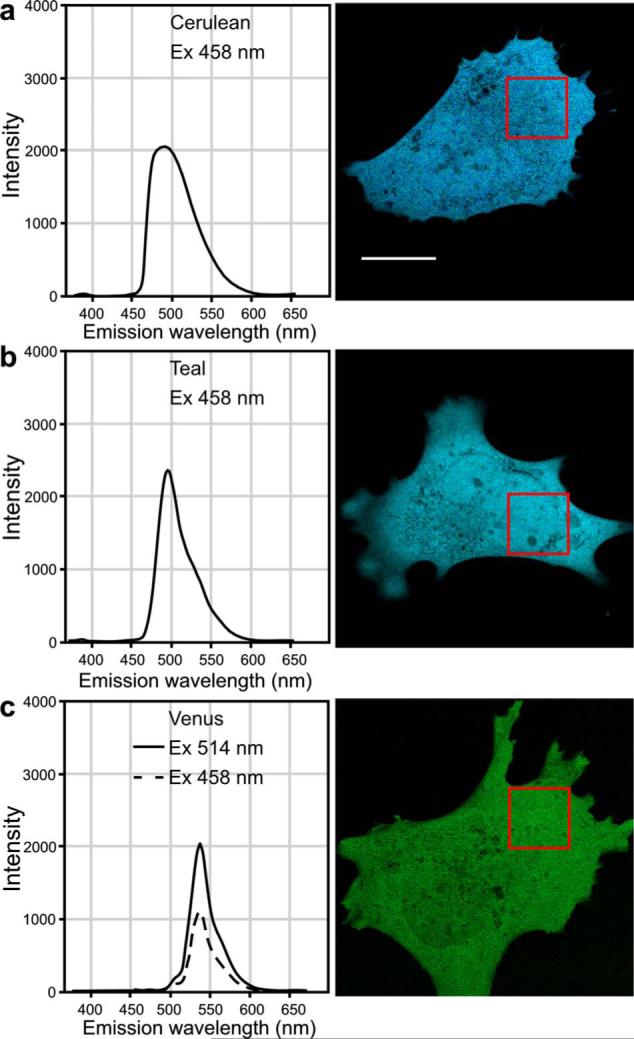
Fig. 3
The emission spectra were acquired from cells that expressed the Cerulean, mTFP, or Venus FPs. Spectral imaging with the 32-channel detector was used to collect lambda stacks at a bandwidth of 10.7 nm...
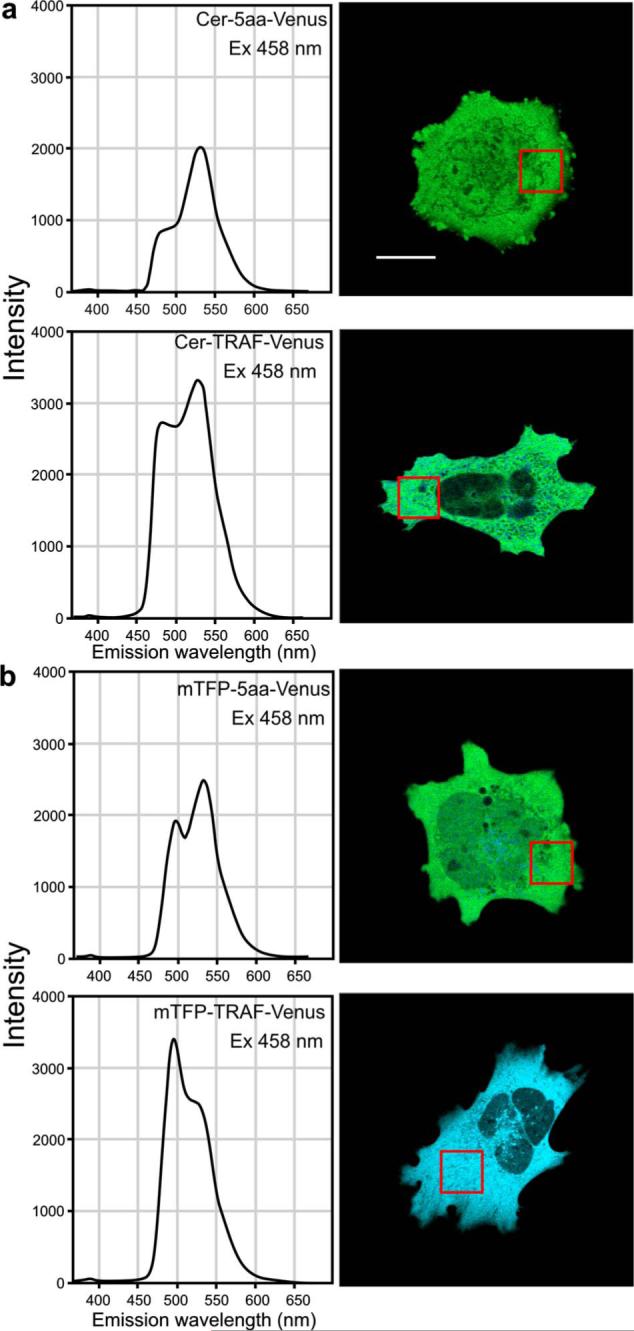
Fig. 4
The spectral measurements of the signal from cells expressing either (a) Cerulean or (b) mTFP directly coupled to Venus. The calibration bar indicates 10 u03bc m. The FRET standards (Cer-5aa-Venus and...
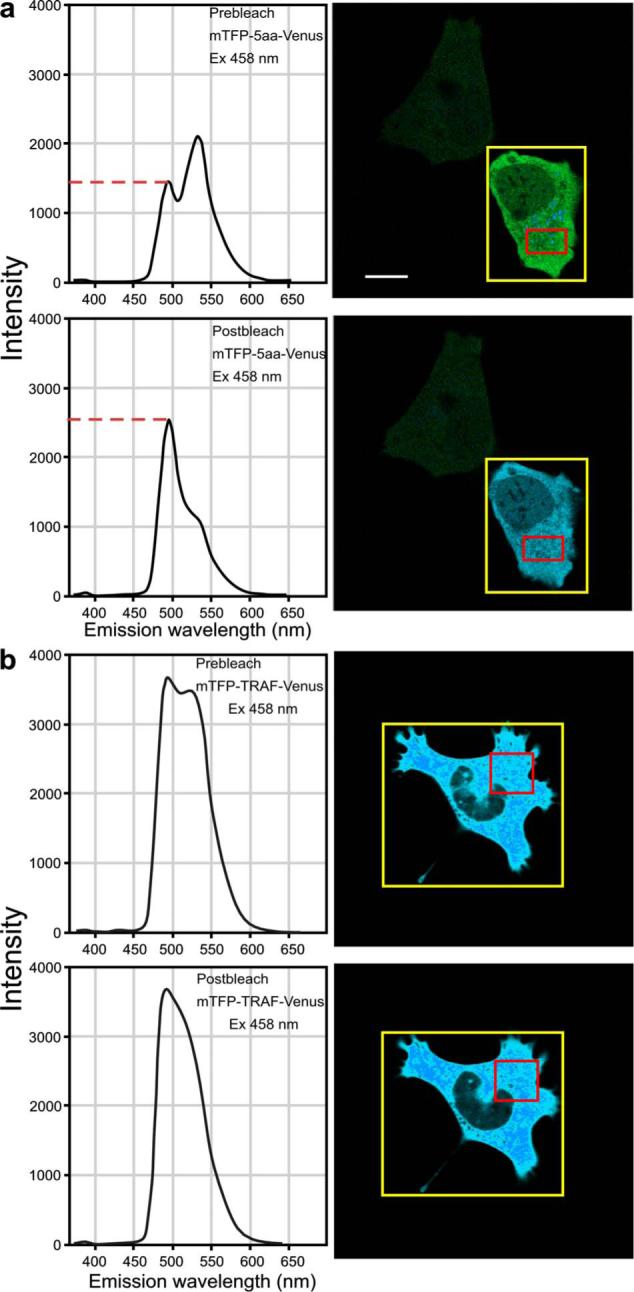
Fig. 5
The measurement of the changes in the donor signals from either the (a) mTFP-5aa-Venus or (b) mTFP-TRAF-Venus fusion proteins after acceptor photobleaching. Spectral measurements were acquired from ce...
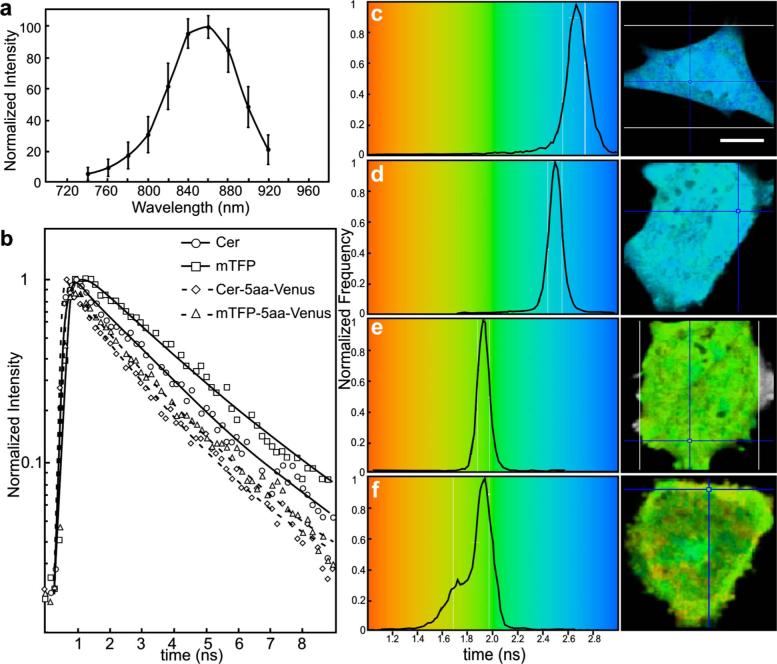
Fig. 6
The 2p-excitation spectrum for mTFP and donor lifetime measurements for the fusion proteins consisting of Cerulean or mTFP linked to Venus. (a) Cells expressing mTFP alone were illuminated at the indi...
Figure images are served from the NIH/NLM PubMed Central Open Access Subset or Europe PMC; copyright remains with the publishers and authors.
💬 Discussion
0 commentsNo comments yet. Be the first to start a discussion!
Leave a Comment