Abstract
Classical models of cerebellar learning posit that climbing fibers operate according to a supervised learning rule to instruct changes in motor output by signaling the occurrence of movement errors. However, cerebellar output is also associated with non-motor behaviors, and recently with modulating reward association pathways in the VTA. To test how the cerebellum processes reward related signals in the same type of classical conditioning behavior typically studied to evaluate reward processing in the VTA and striatum, we have used calcium imaging to visualize instructional signals carried by climbing fibers across the lateral cerebellum in mice before and after learning. We find distinct climbing fiber responses in three lateral cerebellar regions that can each signal reward prediction. These instructional signals are well suited to guide cerebellar learning based on reward expectation and enable a cerebellar contribution to reward driven behaviors, suggesting a broad role for the lateral cerebellum in reward-based learning.
🔬 Techniques
✨ Fluorophores
🧪 Sample Preparation
🏭 Microscope Brands
🔴 Lasers
📷 Detectors
💻 Software Details
💾 Data Repositories
🏛️ Research Organizations (ROR)
Affiliated research institutions:
📋 Methods
Mice
All experimental procedures using animals were carried out with the approval of the Duke University Animal Care and Use Committee. All experiments were performed during light cycle using adult mice (p84-205) of both sexes, randomly selected from breeding litters. All mice were housed in a vivarium with normal light/dark cycles in cages with 1–5 mice. Imaging experiments were performed using Tg(PCP2-Cre)3555Jdhu mice (Jackson Labs, 010536; n = 34). A subset of these animals (n = 12) were the result of a genetic cross with Ai148(TIT2L-GC6f-ICL-tTA2)-D mice (Jackson Labs, 030328). We used two exclusion criteria for animals in this study: (1) poor recovery or other health concerns following surgical intervention or (2) missed virus injection, as determined by in vivo imaging and post-hoc histological analysis. Surgical procedures 3–10 hr prior to surgery, animals received dexamethasone (3 mg/kg) and ketoprofen (5 mg/kg). Surgical procedures were performed under anesthesia, using an initial dose of ketamine/xylazine (50 mg/kg and 5 mg/kg) 5 min prior to surgery and sustained during surgery with 1.0–2.0% isoflurane. Toe pinches and breathing were used to monitor anesthesia levels throughout surgeries. Body temperature was maintained using a heating pad (TC-1000 CWE Inc). Custom-made titanium headplates (HE Parmer) were secured to the skull using Metabond (Parkell). For imaging experiments, a 3 mm diameter craniotomy was made over the lobule simplex at approximately 1.4 mm lateral and 2.8 mm posterior to lambda or crus I and II at approximately 3.0 mm lateral and 4.3 mm posterior to lambda. Glass cover slips consisting of two 3 mm bonded to a 5 mm coverslip (Warner Instruments No. 1) with index matched adhesive (Norland No. 1) were secured in the craniotomy using Metabond. Buprenex (0.05 mg/kg) and cefazolin (50 mg/kg) were administered following surgery twice a day for two days. Following a minimum of 4 recovery days, animals were water deprived for 3 days, or until body weight stabilized at 85% of initial weight, and were habituated to head restraint (3–5 days) prior to behavioral training. For imaging experiments involving viral expression of GCaMP (all non-Ai148 animals), the glass cover slip was removed following behavioral training, and mice were injected (WPI UMP3) with AAV1.CAG.Flex.GCaMP6f.WPRE.SV40 (UPenn vector core, titer = 1.48×10 13 or 7.60 × 10 12 ). 150 nL virus diluted 1:1-1:5 in ACSF was injected at a rate of 30 nl/min and a depth of 150 μm at 1–3 sites in dorsal lobule simplex. A new cranial window was then implanted, and imaging was performed beginning 10–14 days following injection. Transgenic mice crossed with the Ai148 mouse line received no injection and were given 10 days to recover from surgery before training.
Show full methods section
Mice
All experimental procedures using animals were carried out with the approval of the Duke University Animal Care and Use Committee. All experiments were performed during light cycle using adult mice (p84-205) of both sexes, randomly selected from breeding litters. All mice were housed in a vivarium with normal light/dark cycles in cages with 1–5 mice. Imaging experiments were performed using Tg(PCP2-Cre)3555Jdhu mice (Jackson Labs, 010536; n = 34). A subset of these animals (n = 12) were the result of a genetic cross with Ai148(TIT2L-GC6f-ICL-tTA2)-D mice (Jackson Labs, 030328). We used two exclusion criteria for animals in this study: (1) poor recovery or other health concerns following surgical intervention or (2) missed virus injection, as determined by in vivo imaging and post-hoc histological analysis. Surgical procedures 3–10 hr prior to surgery, animals received dexamethasone (3 mg/kg) and ketoprofen (5 mg/kg). Surgical procedures were performed under anesthesia, using an initial dose of ketamine/xylazine (50 mg/kg and 5 mg/kg) 5 min prior to surgery and sustained during surgery with 1.0–2.0% isoflurane. Toe pinches and breathing were used to monitor anesthesia levels throughout surgeries. Body temperature was maintained using a heating pad (TC-1000 CWE Inc). Custom-made titanium headplates (HE Parmer) were secured to the skull using Metabond (Parkell). For imaging experiments, a 3 mm diameter craniotomy was made over the lobule simplex at approximately 1.4 mm lateral and 2.8 mm posterior to lambda or crus I and II at approximately 3.0 mm lateral and 4.3 mm posterior to lambda. Glass cover slips consisting of two 3 mm bonded to a 5 mm coverslip (Warner Instruments No. 1) with index matched adhesive (Norland No. 1) were secured in the craniotomy using Metabond. Buprenex (0.05 mg/kg) and cefazolin (50 mg/kg) were administered following surgery twice a day for two days. Following a minimum of 4 recovery days, animals were water deprived for 3 days, or until body weight stabilized at 85% of initial weight, and were habituated to head restraint (3–5 days) prior to behavioral training. For imaging experiments involving viral expression of GCaMP (all non-Ai148 animals), the glass cover slip was removed following behavioral training, and mice were injected (WPI UMP3) with AAV1.CAG.Flex.GCaMP6f.WPRE.SV40 (UPenn vector core, titer = 1.48×10 13 or 7.60 × 10 12 ). 150 nL virus diluted 1:1-1:5 in ACSF was injected at a rate of 30 nl/min and a depth of 150 μm at 1–3 sites in dorsal lobule simplex. A new cranial window was then implanted, and imaging was performed beginning 10–14 days following injection. Transgenic mice crossed with the Ai148 mouse line received no injection and were given 10 days to recover from surgery before training.
Behavior
During behavioral training, animals were head-fixed and placed in front of a computer monitor and reward delivery tube. Animals were trained to associate a visual cue with a saccharine reward. A high contrast vertical black and white grating was present at all times, including the inter-trial interval (ITI; 24–30 s), except when the reward cue was presented. The reward cue consisted of a horizontal grating, presented for 100 ms, and followed reward delivery after a 500 ms delay (600 ms from cue onset)( Heffley et al., 2018 ). Training sessions lasted for 62.1 ± 0.9 min and consisted of 130.1 ± 1.8 trials (n = 134 sessions). Imaging sessions lasted an average of 63.0 ± 1.2 min and consisted of 128.5 ± 2.5 trials (n = 71 sessions). For reward omission sessions, 20% of randomly determined trials were unrewarded. For unexpected reward sessions, no reward cue was presented on 20% of randomly determined trials. Behavioral parameters including cue presentation, reward delivery, and licking were monitored using Mworks ( http://mworks-project.org ) and custom software written in MATLAB (Mathworks) ( Heffley, 2019 ). Learning was defined by stabilization of reaction times and miss rates, with required reaction times less than 650 ms and a miss rate below 15%. Across animals, 5.7 ± 0.4 training sessions (n = 27 mice imaged on both Day one and Day N+1) was required to meet these criteria. In a subset of experiments, (five mice in LS, three mice in Crus I and II), we used a piezoelectric sensor (C.B. Gitty, 41 mm ‘jumbo’ piezo) integrated into the behavioral apparatus to measure animal movement.
Calcium imaging Mesoscale imaging
Single photon imaging was performed using a customized microscope (Sutter SOM) affixed with a 5x objective (Mitutoyo, 0.14NA) and CMOS camera (Qimaging, Rolera em-c 2 ). Excitation (470 nm) was provided by an LED (ThorLabs, M470L3), and data were collected through a green filter (520–536 nm band pass, Edmund Optics) at a frame rate of 10 Hz, with a field of view of 3.5 × 3.5 mm at 1002 × 1004 pixels.
Two-Photon Imaging
Two-photon imaging was performed with a resonant scanning microscope (Neurolabware) using a 16x water immersion objective (Nikon CFI75 LWD 16xW 0.80NA). Imaging was performed using a polymer to stabilize the immersion solution (MakingCosmetics, 0.4% Carbomer 940). A Ti:Sapphire laser tuned to 920 nm (Spectra Physics, Mai Tai eHP DeepSee) was raster scanned via a resonant galvanometer (8 kHz, Cambridge Technology) at a frame rate of 30 Hz with a field of view of 1030 μm x 581 μm (796 × 264 pixels). Data were collected through a green filter (510 ± 42 nm band filter (Semrock) onto GaAsP photomultipliers (H10770B-40, Hamamatsu) using Scanbox software (Neurolabware). Experiments were aborted if significant z-motion was evident during recording. A total of 29 mice were used for imaging experiments across lobules in Figures 2 – 6 (six mice for mesoscale imaging in LS; 16 mice for two-photon imaging in LS; seven mice for two-photon imaging in Crus I and Crus II (both lobules imaged in the same mice). In these experiments, the range of contributing dendrites to each experiment was as follows: LS: Day 1, 26–106 dendrites, 15 mice; Day N+1, 20–103 dendrites, 16 mice; Day N+2, 15–82 dendrites, six mice; Crus I: Day 1, 6–57 dendrites, six mice; Day N+1, 10–43 dendrites, seven mice; Day N+2, 10–57 dendrites, five mice; Crus II: Day 1, 18–40 dendrites, five mice; Day N+1, 24–78 dendrites, six mice; Day N+2, 10–46 dendrites, six mice. Five additional mice (separate cohort) were used to collect piezoelectric movement data on day N+1 for LS during imaging. For these experiments, the range of dendrites across experiments was 32–101. Piezoelectric movement data for Crus I and II came from a subset of the main cohort of animals described above.
Data analysis and statistics Behavior
Analysis was performed using custom MATLAB code. Reaction times were defined as the first lick occurring 200–1000 ms after reward cue onset. Miss rate was defined as the percent of trials without a lick in the 1 s following cue presentation.
Mesoscale imaging
Imaging analysis was performed using custom MATLAB code. Regions of interest (ROIs) were selected within LS according to the pattern of GCaMP expression. Window location and the lobule identity were identified according to folia patterns visible through the cranial window, landmarks recorded during surgery, and post-hoc histology. Baseline fluorescence (F) was measured on a trial-by-trial basis during the ITI as the mean F between 900 and 200 ms before trial initiation. Normalized fluorescence (ΔF/F) was calculated according to the cumulative activity within an ROI. ΔF/F latency was measured by first finding the peak ΔF/F response following cue onset averaged across trials. Next, the latency was measured as the time when mean ΔF/F trace achieved a maximum rate of change (the peak of the first derivative) in a 500 ms window preceding the identified peak ΔF/F response.
Two-photon imaging
Motion in the X and Y planes was corrected by sub-pixel image registration. No data were excluded (after collection, see above) due to z-axis motion (assessed in each experiment by reviewing the trial averaged, cue aligned movie after X-Y motion correction). To isolate signals from individual PC dendrites, we utilized principal component analysis (PCA) followed by independent component analysis (ICA). Final dendrite segmentation was achieved by thresholding the smoothed spatial filters from ICA. A binary mask was created by combining highly correlated pixels (correlation coefficient >0.8) and removing any overlapped regions between segmented dendrites. Notably, image segmentation using these criteria did not extract PC soma, which were clearly visible in some two-photon imaging experiments. Fluorescence changes (ΔF) were normalized to a window of baseline fluorescence (F) between 500 ms and 100 ms preceding trial initiation. One experiment was excluded from analysis based on single trial ΔF/F values that were more than double the amplitude of any other experiment, according to the rationale that any increases in Cspk activity during learning could be obscured by indicator saturation. To extract events corresponding to Cspks, the first derivative of the raw fluorescence trace was thresholded at 1.7 standard deviations from baseline. Events above this threshold were variable in amplitude ( Figure 3—figure supplement 1 , also described previously by Heffley et al., 2018 ). Previous work has demonstrated that calcium transient amplitude variability reflects the properties of climbing fiber input, and not a combined climbing fiber and parallel fiber signal ( Gaffield et al., 2019 ; Gaffield et al., 2018 ). All events separated by at least one frame were included. The pre-reward window was defined as the 600 ms between the cue and the reward delivery; the post-reward window was defined as the 600 ms following reward (or the time of expected reward). Peak spike rates for individual PC dendrites were defined by first identifying the peak spike rate in the mean peri-stimulus histogram (PSTH) across all PC dendrites within either the Pre- or Post-reward window. Next, this peak was used to define a 100 ms analysis window centered on the peak, to calculate spike rate. To identify PC dendrites responsive at the time of this peak, we selected only those PC dendrites with a peak response at least one standard deviation above their pre-cue baseline activity. To determine whether responses were significant across the population, we compared the responses of all PC dendrites at the time of the peak in the PSTH to a peak found in a 1200 ms window during the baseline and performed a one-tailed t-test across PC dendrites. To identify PC dendrites that were responsive to task events (i.e. visual cue or reward), we selected PC dendrites with spike rates that were elevated one standard deviation above the pre-cue period for two consecutive frames in the pre- or post-reward windows. To identify PC dendrites that were suppressed following expected reward, we selected PC dendrites with spike rates that were suppressed one standard deviation below both their pre-cue and pre-reward firing rates for two consecutive frames during the post-reward window. These criteria selected a very small number of dendrites, which upon inspection, revealed no clear suppression associated with the time of expected reward ( Figure 3—figure supplement 3 ). Single licks during the ITI (separated by at least 250 ms from other licks) were used to generate lick triggered averages; only experiments with at least four licks were included for this analysis. Peaks in the lick triggered average were identified within a window spanning five frames centered on the lick. Significance was calculated by comparing the amplitude of this peak with two frames 250 ms before the lick and two frames 250 ms after the lick. To segregate trials according to lick times, on each trial we identified the first lick bout (at least 3 licks within 300 ms) following the cue, and separated trials into quartiles according to lick latency. To track single PC dendrites across imaging sessions, we first independently generated pixel masks for PC dendrites from each field of view. We then motion registered the mean fluorescence image from the post-learning session to the pre-learning session, and applied the same pixel shifts from this registration to the segmented pixel masks from the post-learning condition. By overlaying the shifted post-learning pixel masks with the pre-learning masks, we assessed the overlap between imaging days. We employed a stringent criterion of greater than 50% overlap to increase the probability of accurately identifying the same PC dendrites across imaging sessions. With these criteria, we identified a group of PC dendrites likely corresponding to the same neurons before and after learning.
Additional statistics
Data are presented as mean ± S.E.M., unless stated otherwise. Statistical tests were two-sided, except as specifically noted. Differences were considered statistically significant when p
📊 Figures
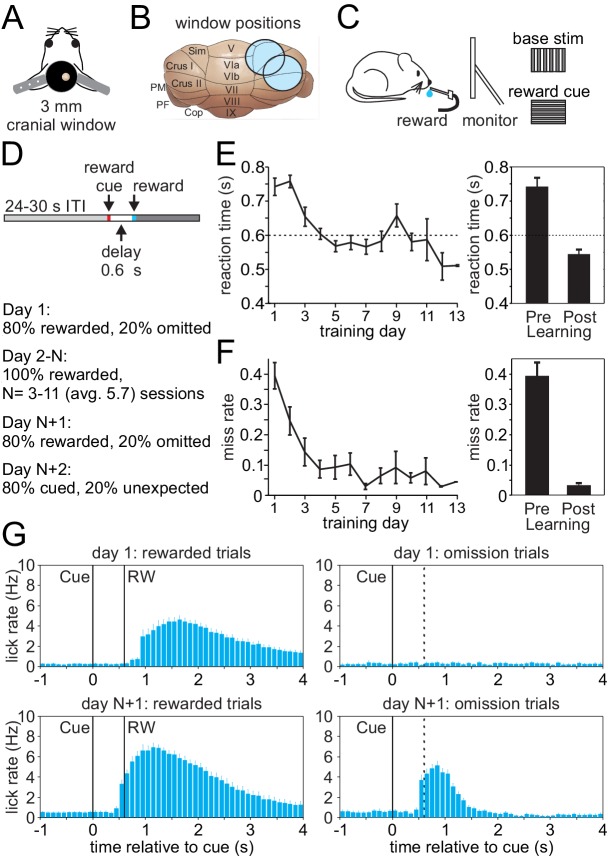
Figure 1.
Appetitive classical conditioning regime for head-fixed mice.
( A ) Diagram of headplate and 3 mm cranial window. ( B ) Scale representation of the 3 mm cranial windows over either Lobule Simplex (LS) or Crus I and II. ( C ) Mice viewed a static full screen vert...
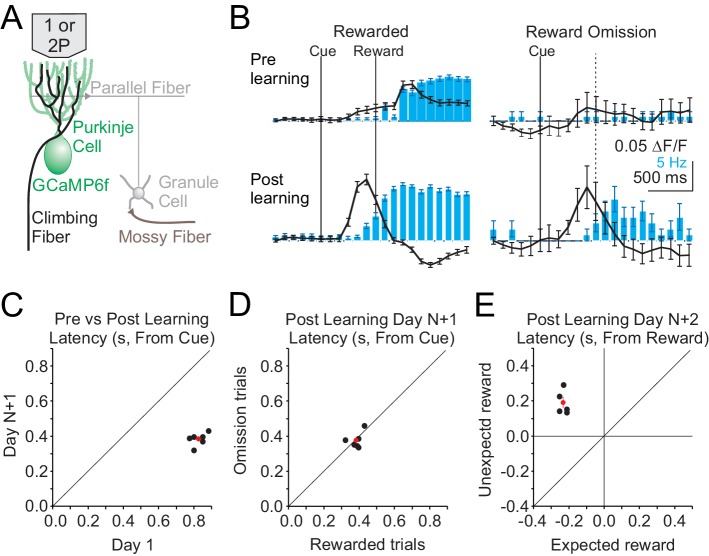
Figure 2.
Single photon, mesoscale imaging of Cspk activity during behavior.
( A ) Schematic of the cerebellar cortex with GCaMP6f expressed in PCs for single or two photon dendrite imaging. ( B ) Average u0394F/F timecourse (black, collected at 10 Hz) and lick rate (blue bars...
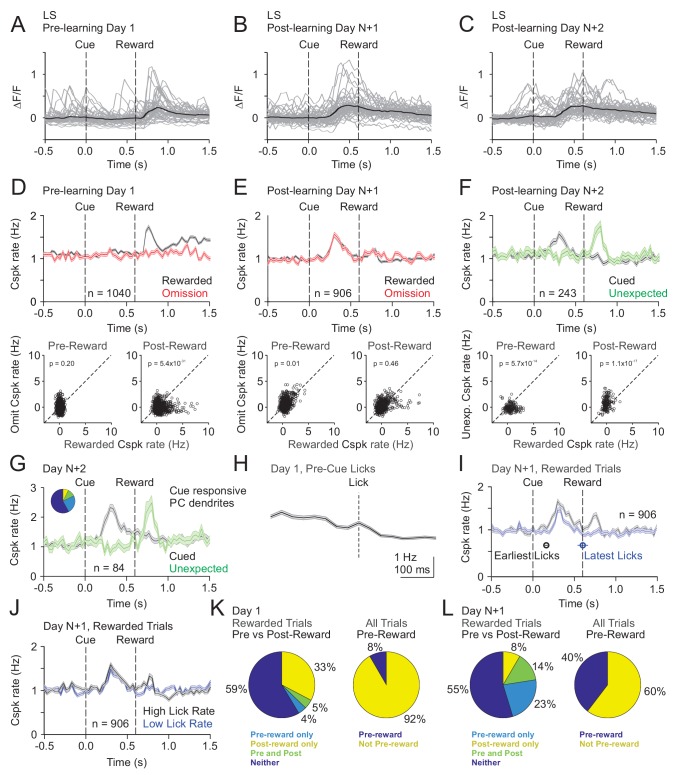
Figure 3.
Cspk modulation in LS across learning.
( A ) u0394F/F timecourses from an example neuron measured via two-photon calcium imaging for the first day of training in nau00efve mice. Gray traces are the first 50 trials and the black trace is th...
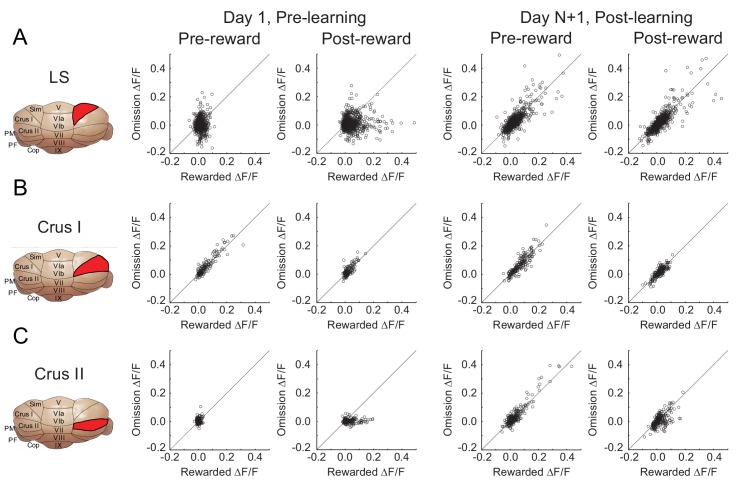
Figure 3u2014figure supplement 1.
Comparison of the mean u0394F/F response for all neurons segregated according to lobule, pre vs post learning, and pre vs post reward delivery.u00a0( A-C ) (Schematic indicating imaging location (left) and summary of u0394F/F responses before and after learning for each area (right).
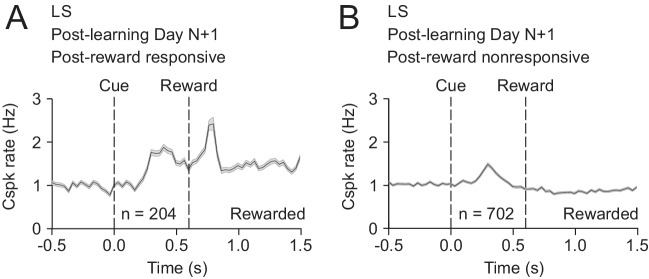
Figure 3u2014figure supplement 2.
A minority of PC dendrites can respond tou00a0both reward and the reward-predictive cue after learning.
( A ) Mean cue-aligned PSTH for PC dendrites that exhibited Cspk responses to reward. ( B ) Mean cue-aligned PSTH for PC dendrites that did not exhibit Cspk responses to reward.
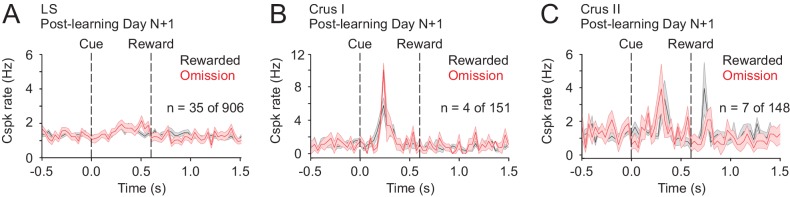
Figure 3u2014figure supplement 3.
No evidence of Cspk suppression following reward omission.
( Au2013C ) Cspk responses identified as suppressed below baseline according to statistical criteria (Materialsu00a0andu00a0methods) in LS, Crus I and Crus II show no suppression upon visual inspectio...
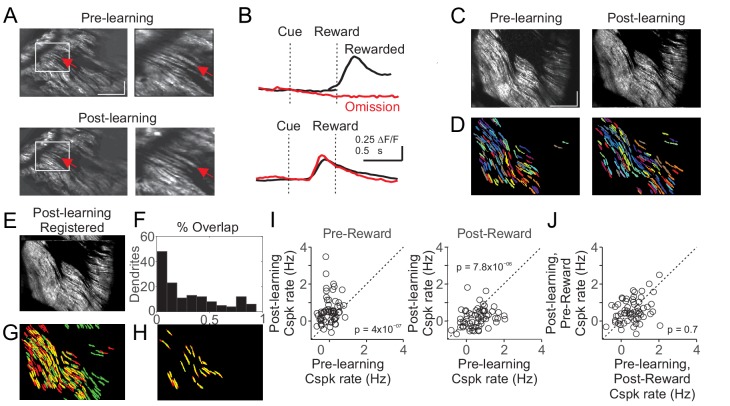
Figure 4.
Cspk responses measured in the same fields of view across learning.
( A ) Example of manual identification from a field of view containing several of the same PC dendrites on day one and day N+1. Left, fields of view for day 1 (top) and day N+1 (bottom). Right, magnif...
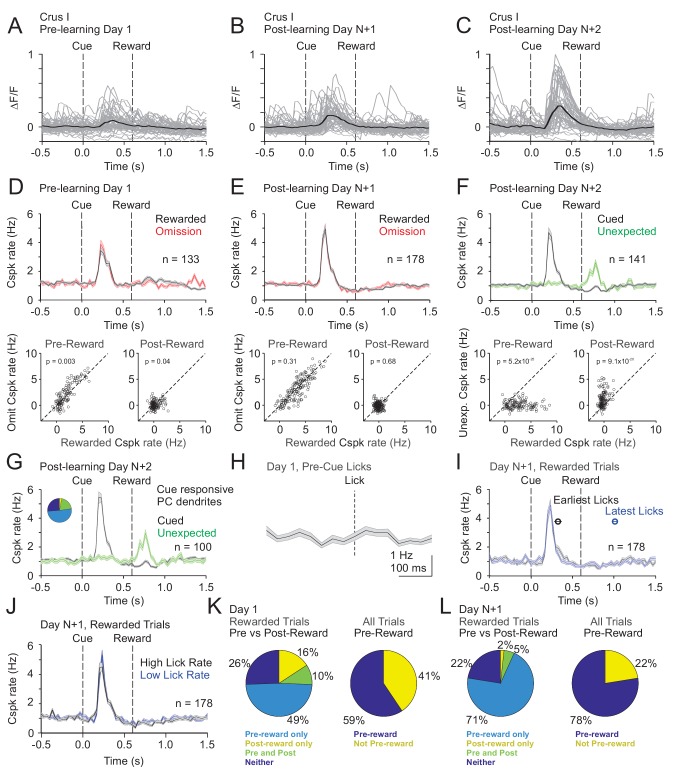
Figure 5.
Cspk modulation in Crus I across learning.
( A ) u0394F/F timecourses from an example neuron measured via two-photon calcium imaging for the first day of training in nau00efve mice. Gray traces are the first 50 trials and the black trace is th...
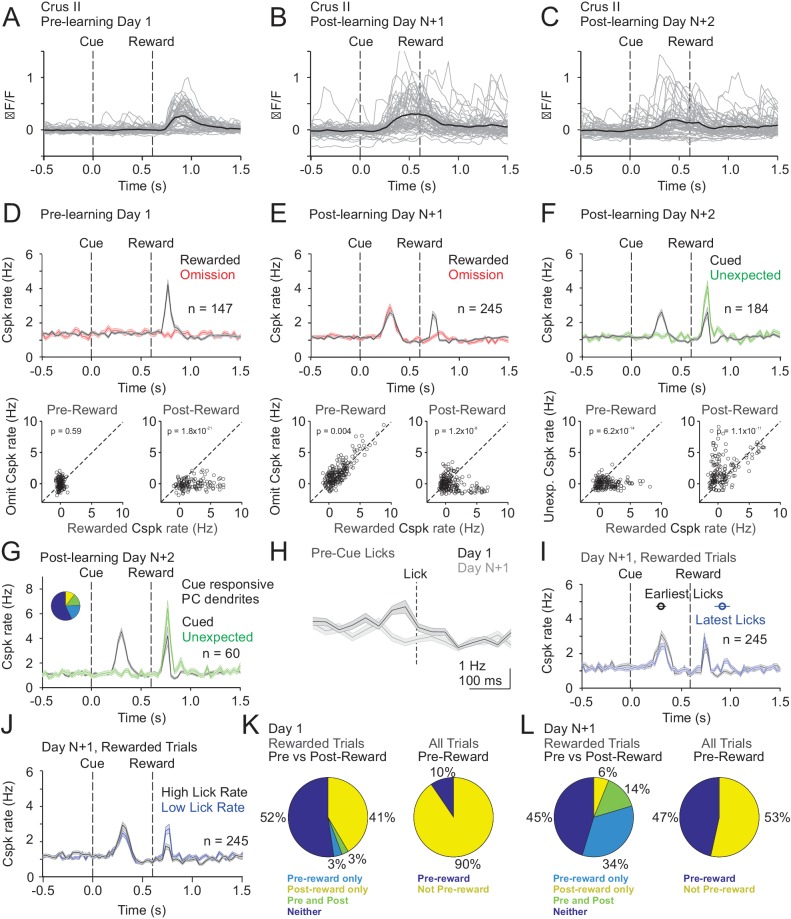
Figure 6.
Cspk modulation in Crus II across learning.
( A ) u0394F/F timecourses from an example neuron measured via two-photon calcium imaging for the first day of training in nau00efve mice. Gray traces are the first 50 trials and the black trace is th...
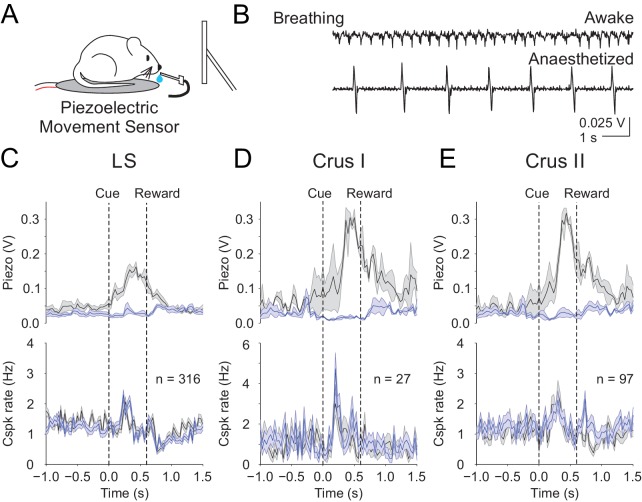
Figure 7.
Body movements do not explain the learned reward predictive Cspks.
( A ) Piezoelectric movement sensor was used to measure movements during the behavior for a subset of animals. ( B ) movement traces corresponding to mouse breathing during awake (top) and anesthetize...
Figure images are served from the NIH/NLM PubMed Central Open Access Subset or Europe PMC; copyright remains with the publishers and authors.
💬 Discussion
0 commentsNo comments yet. Be the first to start a discussion!
Leave a Comment