Abstract
Ribosomes accurately decode mRNA by proofreading each aminoacyl-tRNA that is delivered by the elongation factor EF-Tu1. To understand the molecular mechanism of this proofreading step it is necessary to visualize GTP-catalysed elongation, which has remained a challenge2-4. Here we use time-resolved cryogenic electron microscopy to reveal 33 ribosomal states after the delivery of aminoacyl-tRNA by EF-Tu•GTP. Instead of locking cognate tRNA upon initial recognition, the ribosomal decoding centre dynamically monitors codon-anticodon interactions before and after GTP hydrolysis. GTP hydrolysis enables the GTPase domain of EF-Tu to extend away, releasing EF-Tu from tRNA. The 30S subunit then locks cognate tRNA in the decoding centre and rotates, enabling the tRNA to bypass 50S protrusions during accommodation into the peptidyl transferase centre. By contrast, the decoding centre fails to lock near-cognate tRNA, enabling the dissociation of near-cognate tRNA both during initial selection (before GTP hydrolysis) and proofreading (after GTP hydrolysis). These findings reveal structural similarity between ribosomes in initial selection states5,6 and in proofreading states, which together govern the efficient rejection of incorrect tRNA.
🔬 Techniques
🔭 Microscopes
🧬 Organisms
🏭 Microscope Brands
🧪 Reagent Suppliers
💻 Software Details
💾 Data Repositories
🏛️ Research Organizations (ROR)
Affiliated research institutions:
📋 Methods
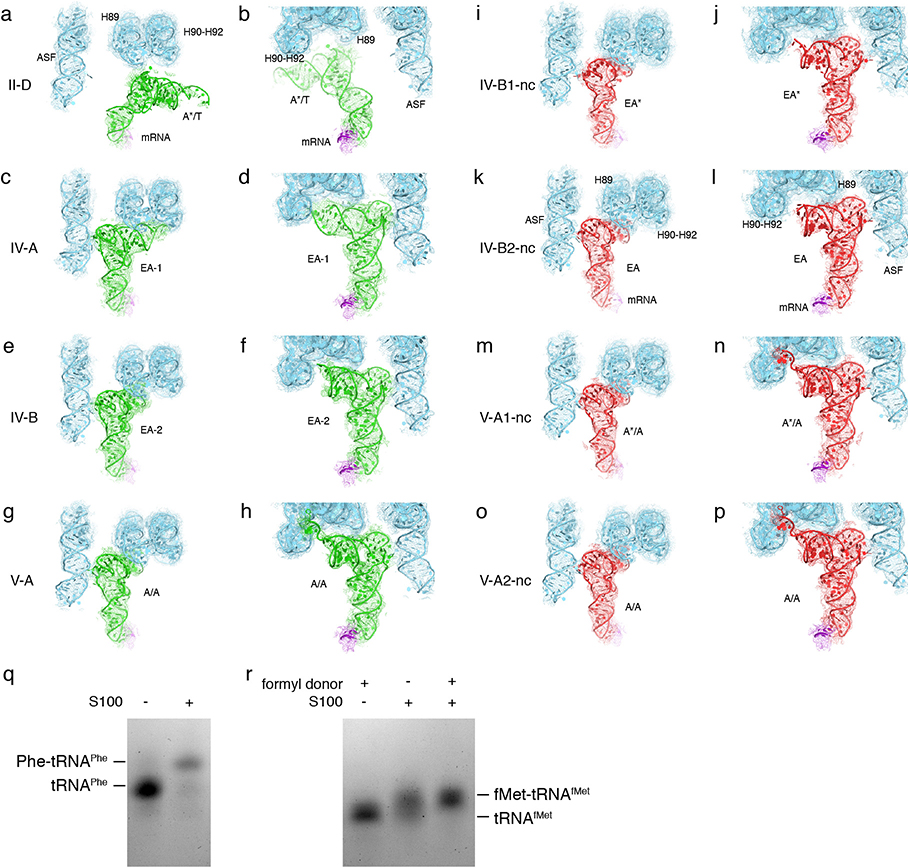
We performed ensemble cryo-EM 16 of EF-Tu•GTP-catalyzed delivery of cognate aa-tRNA at several time points. We incubated Phe-tRNA Phe •EF-Tu•GTP ternary complex with E. coli 70S•fMet-tRNA fMet programmed with mRNA carrying the initiation fMet (AUG) codon in the P site and Phe (UUC) codon in the A site ( Fig. 1a ). The reactions progressed on ice (to slow the reactions), were applied to cryo-EM grids, and were rapidly plunged into liquid ethane to stop their progress at different times ( Fig. 1c and Methods ). Datasets were collected for time points informed by a biochemical time course of the EF-Tu•GTP-catalyzed reaction under similar conditions 17 . Preparation and freezing of tRNA delivery complexes on cryo-EM grids 30S and 50S ribosomal subunits were prepared from MRE600 E. coli as described 52 and stored in Buffer A (20 mM Tris, pH 7, 10.5 mM MgCl 2 , 100 mM NH 4 Cl, 0.5 mM EDTA, 6 mM β-mercaptoethanol) at –80°C. mRNA containing the Shine-Dalgarno sequence and a linker to place the AUG codon in the P site and the Phe codon (cognate complex) or Leu codon (near-cognate complex) in the A site was synthesized by IDT DNA. Cognate complex mRNA was GGC AAG GAG GUA AAA AUG UUC AAA AAA, while near-cognate complex mRNA was GGC AAG GAG GUA AAA AUG CUC AAA AAA. Components of ternary complex were prepared as follows. E. coli EF-Tu was prepared as previously described 5 , 53 . GTP was purchased from Roche. tRNA Phe and tRNA fMet were purchased from Chemblock. Cellular enzyme extract (S-100) was used for tRNA aminoacylation and was prepared from MRE600 E. coli as described 53 . Briefly, 2L of MRE600 E. coli culture in LB was harvested in log phase (OD 0.6) yielding approximately 5 g of cell pellet. The pellet was resuspended in 20 ml of S-100 Buffer (10 mM Tris, pH 7, 10 mM MgCl 2 , 30 mM NH 4 Cl, 6 mM β-mercaptoethanol) and the cells were lysed using a Microfluidics M-110P cell disruptor. The lysate was cleared by centrifugation at 15,000 rpm for 15 minutes at 4°C (JA-20 rotor, Beckman). Ribosomes from the cleared lysate were pelleted using ultracentrifugation in a Ti-70 rotor (Beckman) at 60,000 rpm, for 2 hours at 4°C. 2.5 g of DEAE cellulose (Sigma Aldrich) was equilibrated and washed three times with ice cold S-100 Buffer. Following the ultracentrifugation, the top 80% of the supernatant was transferred to the DEAE cellulose and allowed to mix for 30 minutes at 4°C. The DEAE cellulose was separated from solution by centrifugation in a table-top centrifuge at 5,000 rpm for 5 minutes at 4°C and the supernatant was removed. DEAE cellulose was washed with 40 ml of S-100 Buffer for 30 minutes at 4°C. The DEAE cellulose beads were isolated and mixed with 10 ml of S-100 Elution Buffer (10 mM Tris, pH 7, 10 mM MgCl 2 , 250 mM NH 4 Cl, 6 mM β-mercaptoethanol) for 30 minutes at 4°C. After centrifuging as before to separate the DEAE cellulose and supernatant, the supernatant was retained and used as the purified S-100 extract. tRNA Phe and tRNA fMet were charged using the S-100 extract supplemented with 0.1 mM Phenylalanine or Methionine, respectively, exactly as described in ref 53 . The methionine was formylated by including neutralized N10-formyl-tetrahydrofolate in the reaction 53 . Aminoacylation and formylation of tRNA were confirmed using acid gel electrophoresis 54 , as shown in Extended Data Fig. 5q – r . The 70S and ternary complexes were prepared as follows. Heat-activated (42°C, 5 minutes) 30S ribosomal subunits (3 μM) were mixed with 50S ribosomal subunits (3 μM) and with cognate or near-cognate complex mRNA (15 μM) (all final concentrations) in Reaction Buffer (20 mM HEPES•KOH, pH 7.5, 20 mM magnesium chloride, 150 mM ammonium chloride, 2 mM spermidine, 0.1 mM spermine) for 30 minutes at 37°C. A 2.25-fold molar excess of fMet-tRNA fMet was added to the ribosomal subunits and incubated for 5 minutes at 37°C. The 70S•mRNA•fMet-tRNA fMet complexes were diluted to 0.5 μM with Reaction Buffer and held on ice. Concurrently, the ternary complex of Phe-tRNA Phe •EF-Tu•GTP was prepared as follows. 1.5 μM EF-Tu was pre-incubated with 1 mM GTP in Reaction Buffer for 5 minutes at 37°C and then was supplemented with 1.5 μM Phe-tRNA Phe (all final concentrations). After an additional minute at 37°C, the ternary complex was also kept on ice until plunging. C-flat 1.2–1.3 (Protochips) holey-carbon grids coated with a thin layer of carbon (17 s, 29 s, 120 s cognate and 30 s near-cognate datasets) or Ultrathin Carbon Film on Lacey Carbon Support Film (Ted Pella) (0 s and 1800s cognate datasets) grids were glow discharged with 20 mA current with negative polarity for 45–60 s in a PELCO easiGlow glow discharge unit. A Vitrobot Mark IV was pre-equilibrated to ~4.5 degrees and 100% humidity for 1 hour prior to plunging. Pipettes, tips, tubes, and forceps were equilibrated on ice for 30 minutes prior to the beginning of the plunging procedure and kept on ice when not in use during the procedure. For each grid, 1.5 μL of 70S•mRNA•fMet-tRNA fMet was mixed with 1.5 μL of ternary complex with ice-chilled tips and in an ice-chilled tube. ~10 seconds prior to the desired time point, the reaction was transferred from the tube in an ice-chilled tip into the Vitrobot chamber, quickly applied to a chilled Holey-carbon grid, and then blotted for 4 s prior to plunging into liquid-nitrogen-cooled liquid ethane. The time point when the grid hit the ethane was noted as the reaction duration. The cognate data presented are from grids prepared from the same half reactions and plunged at 17 s, 29 s, and 120 s within 30 minutes of each other. The near-cognate data is from a grid prepared at the same plunging session, using the same ternary complex preparation with ribosomes programmed with the Leu-encoding mRNA. The 0 s and 1800 s data were prepared using the same procedure, with buffer used instead of ternary complex for the 0 s timepoint. The final reactions on the grids had the following concentrations: 250 nM 50S; 250 nM 30S; 1.25 μM mRNA; 560 nM fMet-tRNA fMet ; 0.75 μM EF-Tu; 500 μM GTP, and 0.75 μM Phe-tRNA Phe .
Show full methods section
We performed ensemble cryo-EM 16 of EF-Tu•GTP-catalyzed delivery of cognate aa-tRNA at several time points. We incubated Phe-tRNA Phe •EF-Tu•GTP ternary complex with E. coli 70S•fMet-tRNA fMet programmed with mRNA carrying the initiation fMet (AUG) codon in the P site and Phe (UUC) codon in the A site ( Fig. 1a ). The reactions progressed on ice (to slow the reactions), were applied to cryo-EM grids, and were rapidly plunged into liquid ethane to stop their progress at different times ( Fig. 1c and Methods ). Datasets were collected for time points informed by a biochemical time course of the EF-Tu•GTP-catalyzed reaction under similar conditions 17 . Preparation and freezing of tRNA delivery complexes on cryo-EM grids 30S and 50S ribosomal subunits were prepared from MRE600 E. coli as described 52 and stored in Buffer A (20 mM Tris, pH 7, 10.5 mM MgCl 2 , 100 mM NH 4 Cl, 0.5 mM EDTA, 6 mM β-mercaptoethanol) at –80°C. mRNA containing the Shine-Dalgarno sequence and a linker to place the AUG codon in the P site and the Phe codon (cognate complex) or Leu codon (near-cognate complex) in the A site was synthesized by IDT DNA. Cognate complex mRNA was GGC AAG GAG GUA AAA AUG UUC AAA AAA, while near-cognate complex mRNA was GGC AAG GAG GUA AAA AUG CUC AAA AAA. Components of ternary complex were prepared as follows. E. coli EF-Tu was prepared as previously described 5 , 53 . GTP was purchased from Roche. tRNA Phe and tRNA fMet were purchased from Chemblock. Cellular enzyme extract (S-100) was used for tRNA aminoacylation and was prepared from MRE600 E. coli as described 53 . Briefly, 2L of MRE600 E. coli culture in LB was harvested in log phase (OD 0.6) yielding approximately 5 g of cell pellet. The pellet was resuspended in 20 ml of S-100 Buffer (10 mM Tris, pH 7, 10 mM MgCl 2 , 30 mM NH 4 Cl, 6 mM β-mercaptoethanol) and the cells were lysed using a Microfluidics M-110P cell disruptor. The lysate was cleared by centrifugation at 15,000 rpm for 15 minutes at 4°C (JA-20 rotor, Beckman). Ribosomes from the cleared lysate were pelleted using ultracentrifugation in a Ti-70 rotor (Beckman) at 60,000 rpm, for 2 hours at 4°C. 2.5 g of DEAE cellulose (Sigma Aldrich) was equilibrated and washed three times with ice cold S-100 Buffer. Following the ultracentrifugation, the top 80% of the supernatant was transferred to the DEAE cellulose and allowed to mix for 30 minutes at 4°C. The DEAE cellulose was separated from solution by centrifugation in a table-top centrifuge at 5,000 rpm for 5 minutes at 4°C and the supernatant was removed. DEAE cellulose was washed with 40 ml of S-100 Buffer for 30 minutes at 4°C. The DEAE cellulose beads were isolated and mixed with 10 ml of S-100 Elution Buffer (10 mM Tris, pH 7, 10 mM MgCl 2 , 250 mM NH 4 Cl, 6 mM β-mercaptoethanol) for 30 minutes at 4°C. After centrifuging as before to separate the DEAE cellulose and supernatant, the supernatant was retained and used as the purified S-100 extract. tRNA Phe and tRNA fMet were charged using the S-100 extract supplemented with 0.1 mM Phenylalanine or Methionine, respectively, exactly as described in ref 53 . The methionine was formylated by including neutralized N10-formyl-tetrahydrofolate in the reaction 53 . Aminoacylation and formylation of tRNA were confirmed using acid gel electrophoresis 54 , as shown in Extended Data Fig. 5q – r . The 70S and ternary complexes were prepared as follows. Heat-activated (42°C, 5 minutes) 30S ribosomal subunits (3 μM) were mixed with 50S ribosomal subunits (3 μM) and with cognate or near-cognate complex mRNA (15 μM) (all final concentrations) in Reaction Buffer (20 mM HEPES•KOH, pH 7.5, 20 mM magnesium chloride, 150 mM ammonium chloride, 2 mM spermidine, 0.1 mM spermine) for 30 minutes at 37°C. A 2.25-fold molar excess of fMet-tRNA fMet was added to the ribosomal subunits and incubated for 5 minutes at 37°C. The 70S•mRNA•fMet-tRNA fMet complexes were diluted to 0.5 μM with Reaction Buffer and held on ice. Concurrently, the ternary complex of Phe-tRNA Phe •EF-Tu•GTP was prepared as follows. 1.5 μM EF-Tu was pre-incubated with 1 mM GTP in Reaction Buffer for 5 minutes at 37°C and then was supplemented with 1.5 μM Phe-tRNA Phe (all final concentrations). After an additional minute at 37°C, the ternary complex was also kept on ice until plunging. C-flat 1.2–1.3 (Protochips) holey-carbon grids coated with a thin layer of carbon (17 s, 29 s, 120 s cognate and 30 s near-cognate datasets) or Ultrathin Carbon Film on Lacey Carbon Support Film (Ted Pella) (0 s and 1800s cognate datasets) grids were glow discharged with 20 mA current with negative polarity for 45–60 s in a PELCO easiGlow glow discharge unit. A Vitrobot Mark IV was pre-equilibrated to ~4.5 degrees and 100% humidity for 1 hour prior to plunging. Pipettes, tips, tubes, and forceps were equilibrated on ice for 30 minutes prior to the beginning of the plunging procedure and kept on ice when not in use during the procedure. For each grid, 1.5 μL of 70S•mRNA•fMet-tRNA fMet was mixed with 1.5 μL of ternary complex with ice-chilled tips and in an ice-chilled tube. ~10 seconds prior to the desired time point, the reaction was transferred from the tube in an ice-chilled tip into the Vitrobot chamber, quickly applied to a chilled Holey-carbon grid, and then blotted for 4 s prior to plunging into liquid-nitrogen-cooled liquid ethane. The time point when the grid hit the ethane was noted as the reaction duration. The cognate data presented are from grids prepared from the same half reactions and plunged at 17 s, 29 s, and 120 s within 30 minutes of each other. The near-cognate data is from a grid prepared at the same plunging session, using the same ternary complex preparation with ribosomes programmed with the Leu-encoding mRNA. The 0 s and 1800 s data were prepared using the same procedure, with buffer used instead of ternary complex for the 0 s timepoint. The final reactions on the grids had the following concentrations: 250 nM 50S; 250 nM 30S; 1.25 μM mRNA; 560 nM fMet-tRNA fMet ; 0.75 μM EF-Tu; 500 μM GTP, and 0.75 μM Phe-tRNA Phe .
Electron Microscopy
Data for the cognate tRNA delivery complexes at 0, 17, 29, 120 and 1800 s and near-cognate complex at 30 s were collected on a Titan Krios electron microscope (FEI) operating at 300 kV and equipped with a Gatan Image Filter (GIF) and a K2 Summit direct electron detector (Gatan Inc.) targeting 0.3 to 2.0-μm underfocus. For the cognate, 29-s time point, a dataset of 678,268 particles from 3218 movies was collected automatically using SerialEM 55 . Similarly, for the cognate complex data were collected as follows: 0-s, 7,428 particles from 67 movies; 17-s, 375,869 particles from 1640 movies; 120-s, 127,089 particles from 666 movies; and 1800-s, 13,126 particles from 167 movies. For the near-cognate complex, one 30-s time point was similarly collected and included 565,412 particles from 2508 movies. For each data collection, 35–36 frames per movie were collected at 1 e − /Å 2 per frame for a total dose of 35–36 e − /Å 2 on the sample. The super-resolution pixel size was 0.667 Å on the sample as calibrated from cross-correlation of the atomic model of PDB: 5UYL or 5UYM 5 to the maps for Structures II-A and III-B, respectively, using Chimera.
Image processing
Particles were extracted from aligned movie sums as follows. Movies were processed using IMOD 56 to decompress frames, apply the gain reference, and to correct for image drift yielding image sums with pixel size of 1.333 Å. CTFFIND4 57 was used to determine defocus values. Particles were automatically picked from 5×-binned images using Signature 58 with a ribosome reference (18 representative reprojections of the EM databank map 1003 59 ). 288 × 288-pixel boxes with particles were extracted from motion-corrected images, and assembled into stacks in EMAN2 60 . To speed up processing, 2×- and 4×-binned image stacks were prepared using resample.exe, which is part of the Frealign distribution 61 . Optimization of grid preparation for time-resolved cryo-EM The conditions for complex preparation, grid freezing, and data collection were optimized to yield the conditions described in the above sections. Using small datasets (10,000–50,000 particles), we tested different plunging approaches, including a manual plunger and CP3 (Gatan Inc.) operating in a cold room (Brandeis University Cryo-EM facility); Vitrobot Mark IV (UMass Medical School Cryo-EM core facility), different grid types (holey carbon grids or carbon-coated holey carbon grids), reaction duration (4 s to 60 s), temperature (up to 10 degrees Celsius), reaction conditions (varying ternary complex to ribosome ratio and buffer composition) and dataset size. Datasets were collected on F20 or F30 electron microscopes at Brandeis University. The datasets were processed using procedures described above and classified as described below but were modified to allow for the different microscopes and detectors used. We observed the following trends. The CP3 plunger allowed us to achieve fastest reaction times from mixing to plunging within 4 seconds, but suffered from poor temperature control and inconsistent grid quality due to fast handling. We observed ~5% occupancy of EF-Tu and ~10% accommodated A-tRNA in these early experiments and were gratified to learn that 15–30 s time points led to increased populations of intermediates. Use of holey carbon or carbon-coated holey carbon grids yielded approximately equivalent EF-Tu loading onto ribosomes after correcting for ribosome density (typically, 7-times higher concentrations of the 70S complexes were used for holey carbon grids). Use of carbon-coated grids, however, yielded more consistent ice thickness and higher-resolution reconstructions. To test whether EF-Tu occupancy estimation at different time points could be biased due to the variation in dataset sizes, we analyzed 10 smaller datasets (~20,000 to ~50,000 particles) from reactions quenched at 20 to 30 seconds.
Data classification consistently revealed
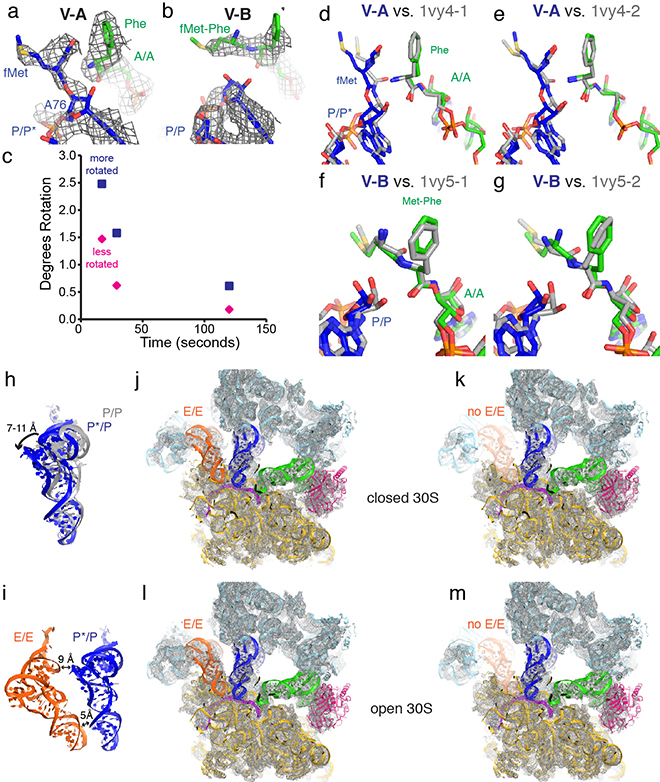
EF-Tu at 10–20% occupancy, ruling out the bias. Classifications In parallel with the classification approach shown in Extended Data Fig. 1 and 2 and described in detail below, we performed over 100 classifications that differed by the number of classes (from 2 to 48), number of classification steps, masking approaches (3D mask and spherical focus mask in Frealign), mask positions and sizes (30S, A-site, A- and P-sites, PTC, L11 stalk etc.) and resolution cutoffs (ranging from 12 Å to 4 Å). These classifications resulted in more than 1,000 maps, which generally reproduced the classes discussed in the main text. The classifications revealed different positions of the mobile parts of the ribosome, including the L1 and L11 stalks. We discovered additional features, which are consistent with elusive interactions between EF-Tu and a highly dynamic L7/L12 stalk, implicated in recruiting the ternary complex to the ribosome 28 , 62 , as described in Supplementary Information and Extended Data Fig. 3s – v . Distribution of states Extensive maximum-likelihood classification of datasets at different time points was performed to identify the intermediates that might characterize substrate-like, EF-Tu-bound, accommodation, peptidyl transfer and pre-translocation sub-states ( Fig. 1b ). EF-Tu-bound particles were found at similar abundance at the early time points (up to 30 sec) in smaller and large datasets, ruling out a bias in the classification and abundance estimation due to dataset size and clearly fell in the 120s time point (see above). We observed no A/A, EA or A/P tRNA (product) states at the 0-second time point. The presence of these states upon addition of the ternary complex (at 17 s, 30 s and 120 s), in which EF-Tu was present in excess over aa-tRNA, demonstrates that the decoding, accommodation, peptidyl-transfer and pre-translocation states result from interaction with the ternary complex and are not due to pre-bound or spontaneously re-binding tRNA in the initial 70S ribosome sample. The extent of partial 30S subunit rotation, which is associated with tRNA accommodation upon EF-Tu release ( Fig. 3h ), reduces with time ( Extended Data Fig. 6c ), consistent with accommodation being a slow and potentially rate-limiting step 31 . By contrast, ribosome populations within EF-Tu-bound states (Structures II-A to II-C2 and III-A to III-C) at 17 and 120 seconds are similar to those at 29 seconds. This suggests that interconversions among EF-Tu-bound states occur with fast rates, and involve ribosomes that bind the ternary complex at earlier and later time points. At the later time points, EF-Tu-bound intermediates likely report on ribosomes that proceeded through multiple cycles of binding and dissociation of EF-Tu ternary complex, and/or dissociation of the accommodating tRNA. Similarly, the distribution of product states in non-rotated and rotated 70S conformations (Structures V and VI) remain similar with respect to each other, consistent with fast interconversions observed by FRET studies 63 . High-resolution classifications, map refinement and reconstruction FREALIGN v9.11 was used for most steps of refinement and reconstruction 61 ( Extended Data Fig. 1 and 2 ). 4×-binned image stacks were initially aligned to a ribosome reference 59 (EM databank map 1003) using three rounds of mode 3 (global search) alignment, including data in the resolution range from 300 Å to 20 Å. Next, the 2× and later unbinned image stacks were successively aligned against the common reference using mode 1 (local refinement), including data up to a high-resolution limit of 6 Å (Cognate 17 s, 29 s, 120 s, Near-cognate 30 s) or 8 Å (Cognate 0 s, 1800 s). Subsequently, the refined parameters were used for classification of 4×-binned stacks into 8 classes (Cognate 0 s, 17 s, 29 s, 1800s) or 20 classes (Cognate 120 s or Near-cognate 30 s) in 50 rounds using a spherical (50-Å radius) focus mask around EF-Tu and A/T tRNA, including resolutions from 300 to 12 Å during classification. This classification ( Classification 1 ) separated ribosomes in the classical and hybrid state from 50S subunits, and in each case included one class with density for EF-Tu. Classification of cognate EF-Tu states To find an optimal strategy to resolve distinct states of EF-Tu-containing particles, we compared individual classifications of the 17-, 29-, and 120s datasets against that of a combined stack of EF-Tu-containing particles (as described in the next paragraph). We independently classified EF-Tu-containing classes of the 17-, 29-, and 120-second datasets, using a 3D mask around the 30S shoulder domain and then a 30-Å focus mask centered around EF-Tu, as described below. We have also tested classifications with other masks encircling EF-Tu. These approaches and analyses of dozens of maps revealed that individual EF-Tu-containing states are structurally similar between these three datasets, revealing independently: the 30S domain closure, EF-Tu movements and domain rearrangements. This result suggested that similar structural states are sampled in the course of reaction, and that we might be able to improve the resolution of the final maps by combining these data. Indeed, classifications of the combined datasets have reproducibly improved the density for EF-Tu, and the average resolutions for EF-Tu-containing classes have improved by 0.1–0.3 Å. Map improvements were confirmed by visual inspections of the densities originating from the 17s, 29 s and the combined datasets. The particles bound with EF-Tu in Classification 1 of the cognate datasets were extracted using merge_classes.exe including particles with >50% occupancy and scores >0 (29,453 particles at 17 s, 47,421 particles at 29 s, and 2,964 particles at 120 s). These stacks were appended and all 79,838 particles were processed together to increase resolution of the final classes as described above. The joint stack was first aligned by running 3 rounds of mode 1 refinement including resolution from 300 to 8 Å during refinement. Next, the particles were separated into two classes using a 3D mask that included the shoulder domain of the 30S subunit to separate particles with an open 30S from those with the closed 30S conformation. Two new stacks were prepared and further subclassified into 4 (closed 30S) or 6 classes (open 30S) using a small focus mask (30 Å) centered around EF-Tu using data up to 12 Å resolution for classification only ( Extended Data Fig. 1b ). After 50 rounds of classification, maps were prepared from the unbinned stack and used without further orientation refinement. Eight of these 10 classes were modeled and refined and are described in the text as structures II-A, II-B1, II-B2, II-C1, II-C2, III-A, III-B, and III-C. To obtain the best possible map of the EF-Tu release state (II-D), the open 30S particle stack was separated into 10 classes using a larger focus mask (60 Å) centered at EF-Tu. This classification separated out particles that were interacting with L11 and L7/L12 in different ways ( Extended Data Fig. 3s – v ), particles in which EF-Tu was close to other ribosomes (not shown), and a cleaner release intermediate state which was fit as state II-D. Classification of accommodation and peptidyl transfer intermediates Classical-state 70S classes (with non-rotated or partially-rotated 30S) with either 2 tRNAs and a weak ASL in the A site or 3 well-ordered tRNAs from Classification 1 were merged using merge_classes.exe including particles with >50% occupancy and scores >0 (201,764 particles) and were further subclassified into 24 classes using a 46-Å focus mask around the A and P sites of the 30S and 50S ribosomal subunits using data up to 12 Å resolution ( Extended Data Fig. 1a ). After 250 rounds of classification, 13 classes contained three tRNA, 3 classes were accommodation or intermediates, 5 classes had empty A sites in the classical (4) or hybrid (1) conformation, and 3 classes were low resolution. The particles from the 13 classes with three tRNA were extracted using merge_classes.exe including particles with >50% occupancy and scores >20 (83,981 particles) and separated into two classes using the same 46-Å focus mask, 50 rounds, and data to 12 Å. This classification yielded maps corresponding to models V-A and V-B. These classes were extracted for further exploratory subclassifications (see Supplementary Information ) and were independently refined to improve map resolution. Particles belonging to the accommodation intermediate with the elbow at the A-site finger and a disordered acceptor arm were extracted using merge_classes.exe including particles with >50% occupancy and scores >0 (8,072 particles) and were separated into five classes using a 30-Å focus mask centered around the disordered acceptor arm using 50 rounds and data to 12 Å resolution. Two of these maps with the best features are modeled as states IV-A and IV-B. Classification of hybrid states The hybrid-state particles (with fully rotated 30S) from Classification 1 were also extracted using merge_classes.exe including particles with >25% occupancy and scores >0 (141,604 particles) and were further subclassified into 8 classes using the same 50-Å focus mask as Classification 1 ( Extended Data Fig. 1a ). After 50 rounds of classification, 2 classes contained two tRNAs (one dipeptidyl-tRNA in A/P site and one deacylated tRNA in the P/E sites differing the position of A/P tRNA elbow) similar to states VI-A and VI-B. The 6 remaining classes contained one tRNA in the P/E conformation, and the class with the best resolved features was modeled as class I-B. Limiting the hybrid-state particle stack to those particles with >50% occupancy and scores >20 from Classification 1 and repeating the classification, yielded the product ribosome states exhibiting higher resolution features in the PTC, and ultimately these were modeled as states VI-A and VI-B. Classification of the partially occupied E site To investigate the occupancy of the E site, we used maximum likelihood classification of the 29-s particle substack within a 30-Å focus mask centered on the E-site. To this end, the substrate-like particles (non-rotated 70S with empty A site, 104,795 particles), EF-Tu-containing particles with the domain-open 30S (24,120 particles), EF-Tu-containing particles with the domain-closed 30S (15,216 particles), elbow-accommodation particles (8,072 particles), and peptidyl-transfer-like particles (83,981 particles) (see Extended Data Fig. 1a ) were separately classified into 8 classes for 50 rounds, using data up to 12-Å resolution. In each case, 1–2 classes contained no E-tRNA and 0–1 classes contained weak tRNA-elbow-like density at the L1 stalk with no density for the acceptor arm and ASL. The population of the weak/vacant E-site is constant (~20–25%) among the substrate-like, EF-Tu-bound, accommodation and peptidyl-transfer states. The maps with the vacant and tRNA-bound E site were similarly resolved. In the E-tRNA bound states, non-cognate tRNA does not base-pair with the E-site codon (AAA), similarly to that in previous structures 64 . Unlike the well-resolved P-site and A-site tRNAs, the identities of the E-tRNA nucleotides could not be unambiguously ascribed to tRNA fMet or tRNA Phe due to lower resolution, consistent with conformational and compositional heterogeneity. Both particle populations and visual inspection of the maps with the vacant E and tRNA-bound E site do not reveal obvious correlations with the occupancy or with structural features of the 30S A site or EF-Tu, suggested by the allosteric three-site model 65 , 66 . Although our observations are consistent with biochemical 67 , 68 and biophysical 69 findings of the absence of the allosteric interaction between the E and A sites, non-cognate E-tRNA in our study prevents direct addressing of the allostery hypothesis.
Classification of the near-cognate dataset
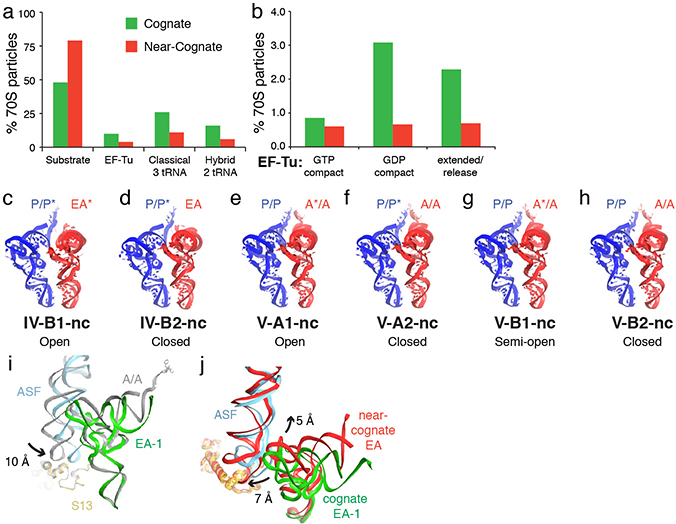
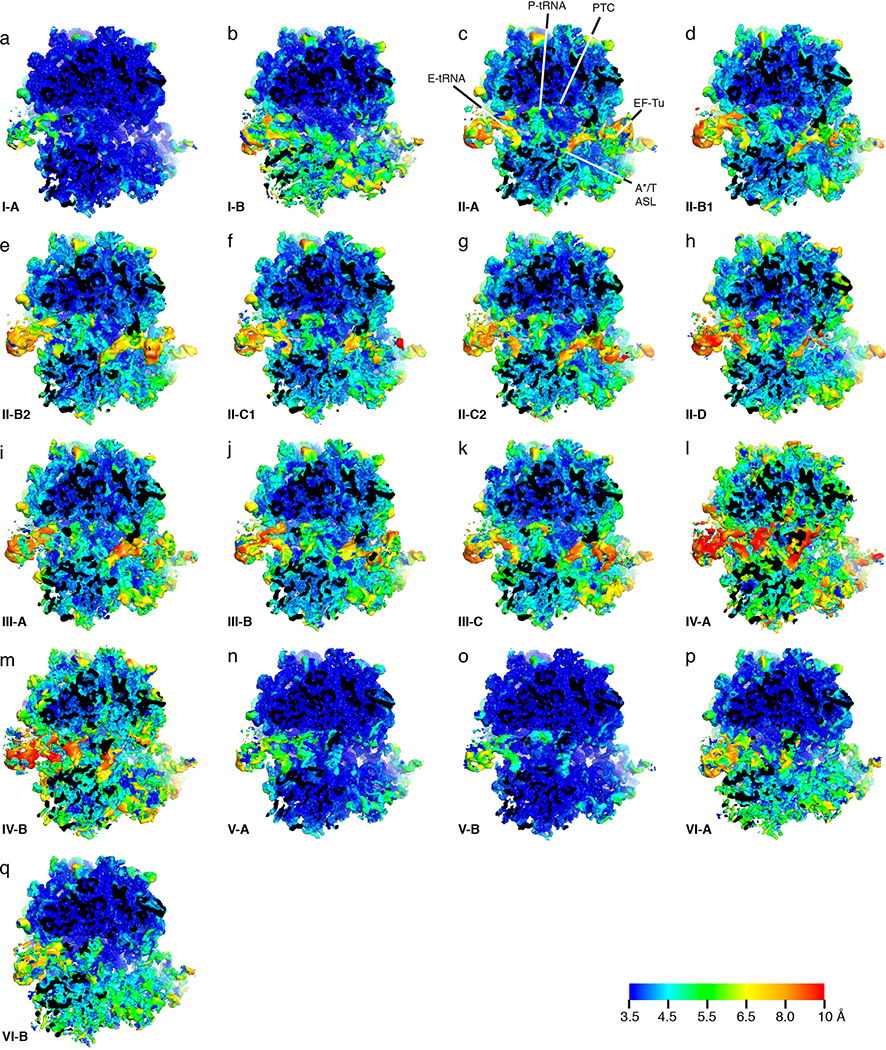
The near-cognate dataset was processed in a similar fashion ( Extended Data Fig. 2a ) except that the EF-Tu-bound particles were processed independently and 3D masking of the shoulder separated states nc-IV and nc-V. First, EF-Tu-bound particles from Classification 1 were extracted using merge_classes.exe including particles with > 50% occupancy and scores > 0 (11,091 particles). Multiple strategies were tried to find particles with a closed 30S domain. First, the particles were separated into two or four classes using a 3D mask that included the shoulder domain of the 30S subunit. While classes with an intermediate domain closure were apparent, no class with a fully closed 30S domain with residues 1492 and 1493 in the ON conformation emerged. Alternatively, a small focus mask (30 Å radius) around EF-Tu was used to separate particles into 4–8 classes based on EF-Tu features. Classification was limited to 12 Å resolution and 50–100 rounds. Classification into 6 models yielded the most interpretable classes. These classes revealed EF-Tu conformations such as GTP-like conformation with an ordered or disordered switch I region, the extended post-hydrolysis conformation, and a pre-release conformation including a weak domain 2 matching those previously observed in the cognate data. In this classification too, none of the near-cognate EF-Tu maps had a closed 30S conformation. To quantify differences between EF-Tu states in the near-cognate and cognate datasets, the cognate 29 s data was processed identically to near-cognate 30 s dataset using 6 models and the 30-Å focus mask. In addition to the classes described above for the near-cognate, a class with EF-Tu at the SRL and the 30S in the closed conformation was readily apparent in the cognate dataset. The percentage of 70S particles assigned to these classes is quantified in Fig. 3l and Extended Data Fig. 7b . Separation of near-cognate accommodation and peptidyl transfer states benefitted from a 3D mask around the shoulder domain of the 30S rather than focus masks as used in the cognate dataset. This type of classification revealed differences in the rotation of the 30S and 30S domain opening. To answer if domain opening occurs during accommodation with cognate tRNA ( Fig. 3l ), particles belonging to the cognate 29 s elbow accommodation states were also separated with the 3D mask around the shoulder into either 2 or 6 classes, but an open 30S was not observed. Assessing optimal reconstruction parameters for low-population classes (< 10,000 particles) using: (a) a test with simulated stacks; and (b) classes II-A and IV-A (a) Test with simulated stacks Because our classifications yielded several classes comprising less than 10,000 particles (see below), we tested which approach to particle parameter (orientation and shift) refinements yields most resolved maps. Specifically, we asked how the maps with original particle orientation parameters (i.e. entire stack aligned together then no orientation refinement after classification ) compare with those, in which particle orientation parameters are refined after classification . Here, we describe a simulation, in which we also asked whether and how the number of particles affects the resolution of the maps. To this end, we tested three approaches, employing Frealign v9.11, cisTEM −1.0.0-beta 70 and Relion-3-beta 71 to process particle stacks with different numbers of particles. To ensure that the different particle stacks contain particles with similar structural features (i.e. the same Structure class) to allow map comparisons, they were generated from a single large high-resolution stack of 31232 particles (class V-A; 3.2 Å average resolution) in triplicates, yielding stacks of approximately 500, 1000, 2000, 4000, 8000, and 16000 particles (18 stacks in total). To this end, the occupancy column of the Frealign parameter file was replaced with random numbers from 0–100, and the stacks and parameter files of appropriate sizes were extracted by varying the occupancy threshold using merge_classes.exe. For each substack, we next obtained reconstructions using: 1) FrealignX_calc_reconstruction (using the original particle orientation parameters determined before classification), 2) cisTEM’s autorefine procedure with “Initial Res. Limit” set either to (a) 60 Å to match initial resolution in the Relion procedure or to (b) 50 Å, which resulted in improved maps for small stacks; or 3) Relion 3D autorefine procedure with default parameters. Procedure 1 is identical to our typical map calculations, described above, in that the original refinement (orientation and shift) parameters were used to create 1x binned reconstructions. Procedures 2a and 2b in cisTEM were used to determine and refine the orientation and shift parameters independently for each substack, using default cisTEM settings. The reference for particle alignment was EMD-1003 prepared in EMAN2 by changing pixel size. Procedure 3 in Relion was performed with default settings to determine the orientation and shift parameters and limit data resolution according to “gold-standard” settings. The reference for particle alignment was filtered to 60 Å as per default settings in Relion. For all procedures, the final resolution was obtained from the masked reconstruction (FSC_part in Frealign/cisTEM or Post-Process step in Relion), without additional beam-tilt or other corrections. This test revealed that the average map resolutions decrease with the decreasing number of particles, consistent with published results 72 . Importantly, post-classification particle parameter refinement (procedures 2 and 3) is detrimental for smaller stacks, resulting in poorly resolved maps, as described in the next paragraph. Furthermore, the resolutions estimated from triplicate stacks are highly variable for small stacks (ranging from 6 to 21 Å for 1000 and 500 particles), further emphasizing suboptimal particle parameter refinement when the particle numbers are low. Instead, original orientation parameters (procedure 1) result in interpretable maps with well-resolved features even for 500 particles (~4.84±0.09 Å resolution). By contrast, for the reconstructions calculated for the full large stack of 31,232 particles with the original and refined particle parameters, the map quality and resolutions were similar: 3.40 Å (procedure 1), 3.37 Å (procedure 2) and 3.76 Å (procedure 3). Relion’s performance may be suboptimal in our tests because we have not used the complete particle-picking and data processing pipeline in Relion, to ensure that the same particles are used here in all three procedures. Nevertheless, the trends observed for Relion-processed data were similar to those for Frealign and CisTEM. In general, our classification attempts in GPU-accelerated Relion with default parameters have yielded high-quality initial reconstructions, similar to those in Frealign and cisTEM, but have not separated the classes as efficiently as Frealign. Frealign was more time-efficient than cisTEM or Relion, allowing us to test and compare numerous classification approaches, and thus representing an optimal classification strategy. Maps with the original and refined particle parameters differed most for the stacks with less than 4,000 particles. At 4,000 particles, the resulting maps show similar resolutions for procedures 1 and 2a and 2b (3.87±0.02 Å (1), 3.97±0.05 Å (2a) and 4.06±0.05 Å (2b), respectively) and a lower resolution for procedure 3 (5.01±0.03 Å). Maps obtained for 2000 particles had substantially more diverging resolution estimates from the triplicates in each approach, and particle-parameter refinement yielded less resolved maps (4.14±0.05 Å (1), 4.53±0.11 Å (2a), 4.37±0.06 (2b) and 6.7±0.07 Å (3)). At 1000 and 500 particles, the differences in resolution and map quality were even more pronounced (1000 particles: 4.46±0.06 Å (1), 14.12±7.5 Å (2a), 5.21±0.2 (2b) and 9.22±0.2 Å (3); 500 particles: 4.84±0.09 Å (1), 20.5±1.3 Å (2a), 8.0±4.1 (2b) and 12.3±2.6 Å (3)). Visual inspection of the small-stack maps confirmed that the procedure employing original refinement parameters (1) resulted in superior maps, which retained some higher-resolution features such as RNA nucleotide separation, unlike the procedures with orientation parameters refined for individual substacks (2a, 2b and 3). (b) Refinement of particle parameters for II-A and IV-A In parallel with the simulation test, we tested the three reconstruction and refinement procedures described above on the classification-derived states with different numbers of particles: II-A (7,320 particles) and IV-A (1,471 particles). Similarly to the simulation results for the least-populated stacks, reconstructions for the sparse class IV-A are most well resolved with the default original particle parameters, whereas post-classification particle parameter refinement is detrimental to map quality. Specifically, our default reconstruction with subsequent beam-tilt corrections yielded a 4.0 Å (average resolution) reconstruction (map 1). Visual inspection confirmed that local features correspond to this average resolution, with some regions containing higher-resolution features, such as separated stacked nucleotides. Being part of the larger stack, the particles in this class have partial occupancies (calculated by frealign_run_refine in the original refinement procedure), and frealign_calc_stats reports they correspond to 1471 particles. To test particle parameter refinement in cisTEM (procedure 2) and Relion (procedure 3), we extracted particles belonging to state IV-A using merge_classes.exe including particles with >50% occupancy and scores >0, yielding a 1790 particle stack with occupancies reset to 100%. This stack was imported with CTF parameters into cisTEM and refined against EMD-1003 using default autorefine parameters, followed by beam-tilt correction, yielding a map at 4.63 Å resolution (map 2). Similarly we exported the stack and par file to Relion and performed 3D-autorefine against EMD-1003 as a reference using default parameters, followed by beam-tilt refinement, 3D-autorefine and post-processing (all steps in Relion), yielding a 6.61 Å reconstruction (map 3). Both cisTEM and Relion maps contained similar lower-resolution features, including EA-1 tRNA, but lacked high-resolution detail, indicating suboptimal particle parameter refinement, likely due to the small particle number. Indeed, for the modestly populated class II-A of more than 7,000 particles, the map resolutions and structural details were improved to: 3.6 Å (procedure 1), 3.8 Å (procedure 2) and 4.9 Å (procedure 3). Nevertheless, visual inspection confirmed that both the highly resolved regions (e.g. peptidyl transferase center) and less resolved features (e.g. secondary structure of peripheral proteins) were superior in map 1 obtained with the original particle parameters. Finalizing maps After the final classifications were completed, we were able to improve each map by 0.1–0.4 Å by applying a beam tilt correction using cisTEM 70 . The beam tilt parameters were calculated once for each dataset using all particles and then were applied to the classified maps. In the case of EF-Tu, where 3 datasets were joined, the beam tilt parameters were calculated using the 79,838 EF-Tu bound particle stack then applied to each of the 10 classes described in the text. FSC curves were calculated by FREALIGN (FSC_part) for even and odd particle half-sets ( Extended Data Fig. 1c – f , 2b ). The maps used for structure docking and refinement were softened or sharpened by using bfactor.exe, part of the FREALIGN v9.11 distribution. To assess the local resolution of the cryo-EM maps and filter them for structure refinements, we used blocres and blocfilt from the Bsoft package 73 , after testing several local-resolution filtering approaches. Briefly, a mask was created for each map by low-pass filtering the map to 30 Å in Bsoft, then binarizing, expanding by 3 pixels and applying a 3-pixel Gaussian edge in EMAN2. Blocres was run with a box size of 26 pixels for maps with average resolutions near 4 Å, or a box size of 20 pixels for maps I-A, V-A, V-B, VI-A, and VI-B with resolutions closer to 3 Å. In each case, the resolution criterion was FSC with cutoff of 0.143. The output of Blocres was used to filter maps according to local resolution using blocfilt. Visual inspections and structure refinements against (1) original Frealign maps, (2) blocfilt maps and (3) blocfilt maps followed by filtering with different B-factors at different resolutions revealed that optimal balance between high-resolution and lower-resolution regions is achieved for blocfilt maps filtered with a constant B-factor of −50 Å 2 to the average resolution as determined by FSC_part. These maps were used for final structure refinements ( Tables S1 , S2 , S3 ). Local regions described in the manuscript were nevertheless inspected using a series of maps (for each class) obtained with different filtering approaches to minimize bias in interpretation. Model building and refinement The 3.2-Å cryo-EM structure of 70S•tRNA•EF-Tu•GDPCP (PDB: 5UYM, 5 ) was used as a starting model for structure refinements. A*/T for Structures II-A to II-D was adopted from PDB: 5UYL 5 ). The starting model for domain 1 of EF-Tu bound with GDP was taken from PDB: 1DG1 74 . The starting models for the EA, A/A, and A/P tRNA Phe were adapted from PDB: 1VY5 75 . fMet and Phe and fMet-Phe dipeptide were adapted from PDB: 1VY4 and PDB: 1VY5 75 . E-site tRNA was modeled as tRNA fMet 5 . E/P tRNA fMet was modeled using PDB: 4V80 76 while H69 of 23S rRNA in the hybrid states was modeled using PDB: 4V9D 18 . All Structures were domain-fitted using Chimera 77 and refined using real-space simulated-annealing refinement using RSRef 78 , 79 against corresponding maps. Local structural elements that differed between structures, such as the decoding center or mRNA codon, were manually fitted and modeled into cryo-EM maps in PyMol 80 and Coot 81 . Refinement parameters, such as the relative weighting of stereochemical restraints and experimental energy term, were optimized to produce the optimal structure stereochemistry, real-space correlation coefficient and R-factor, which report on the fit of the model to the map 82 . Lower-resolution (~4 Å) structures were refined conservatively and visual inspection confirmed good fits. Secondary-structure restraints, comprising hydrogen-bonding restraints for ribosomal proteins and base-pairing restraints for RNA molecules were employed as described 83 and allowed for a conservative and stereochemically-restrained refinement into lower-resolution maps. The structures were next refined using phenix.real_space_refine 84 followed by a round of refinement in RSRef applying harmonic restraints to preserve protein backbone geometry 78 , 79 . Phenix was used to refine B-factors of the models against their respective maps 84 . The resulting structural models have good stereochemical parameters, characterized by low deviation from ideal bond lengths and angles and agree closely with the corresponding maps as indicated by high correlation coefficients and low real-space R factors ( Tables S1 , S2 and S3 ). Visual inspection of key functional regions was performed for each structure to ensure reasonable fits. Structure superpositions and distance calculations were performed in PyMol. To calculate an angle of the 30S subunit rotation for accommodation and peptidyl-transfer states with respect to Structure III-B, 23S rRNAs were aligned with 23S rRNA from Structure III-B using Pymol, and the angle between 16S body regions (residues 2–920 and 1398–1540) was measured in Chimera. Figures were prepared in PyMol and Chimera.
Data Availability
The models generated and analyzed during the current study will be available from the RCSB Protein Data Bank: 6WD0 (Structure I-A), 6WD1 (Structure I-B), 6WD2 (Structure II-A), 6WD3 (Structure II-B1), 6WD4 (Structure II-B2), 6WD5 (Structure II-C1), 6WD6 (Structure II-C2), 6WD7 (Structure II-D), 6WD8 (Structure III-A), 6WD9 (Structure III-B), 6WDA (Structure III-C), 6WDB (Structure IV-A), 6WDC (Structure IV-B), 6WDD (Structure V-A), 6WDE (Structure V-B), 6WDF (Structure VI-A), 6WDG (Structure VI-B), 6WDH (Structure IV-B1-nc), 6WDI (Structure IV-B2-nc), 6WDJ (Structure V-A1-nc), 6WDK (Structure V-A2-nc), 6WDL (Structure V-B1-nc), and 6WDM (Structure V-B2-nc). The cryo-EM maps used to generate models will be available from the Electron Microscopy Database: EMD-21619 (Structure I-A), EMD-21620 (Structure I-B), EMD-21621 (Structure II-A), EMD-21622 (Structure II-B1), EMD-21623 (Structure II-B2), EMD-21624 (Structure II-C1), EMD-21625 (Structure II-C2), EMD-21626 (Structure II-D), EMD-21627 (Structure III-A), EMD-21628 (Structure III-B), EMD-21629 (Structure III-C), EMD-21630 (Structure IV-A), EMD-21631 (Structure IV-B), EMD-21632 (Structure V-A), EMD-21633 (Structure V-B), EMD-21634 (Structure VI-A), EMD-21635 (Structure VI-B), EMD-21636 (Structure IV-B1-nc), EMD-21637 (Structure IV-B2-nc), EMD-21638 (Structure V-A1-nc), EMD-21639 (Structure V-A2-nc), EMD-21640 (Structure V-B1-nc), and EMD-21641 (Structure V-B2-nc).
Supplementary Material 1583975_Supp_Material 1583975_SuppVideo1
📊 Figures
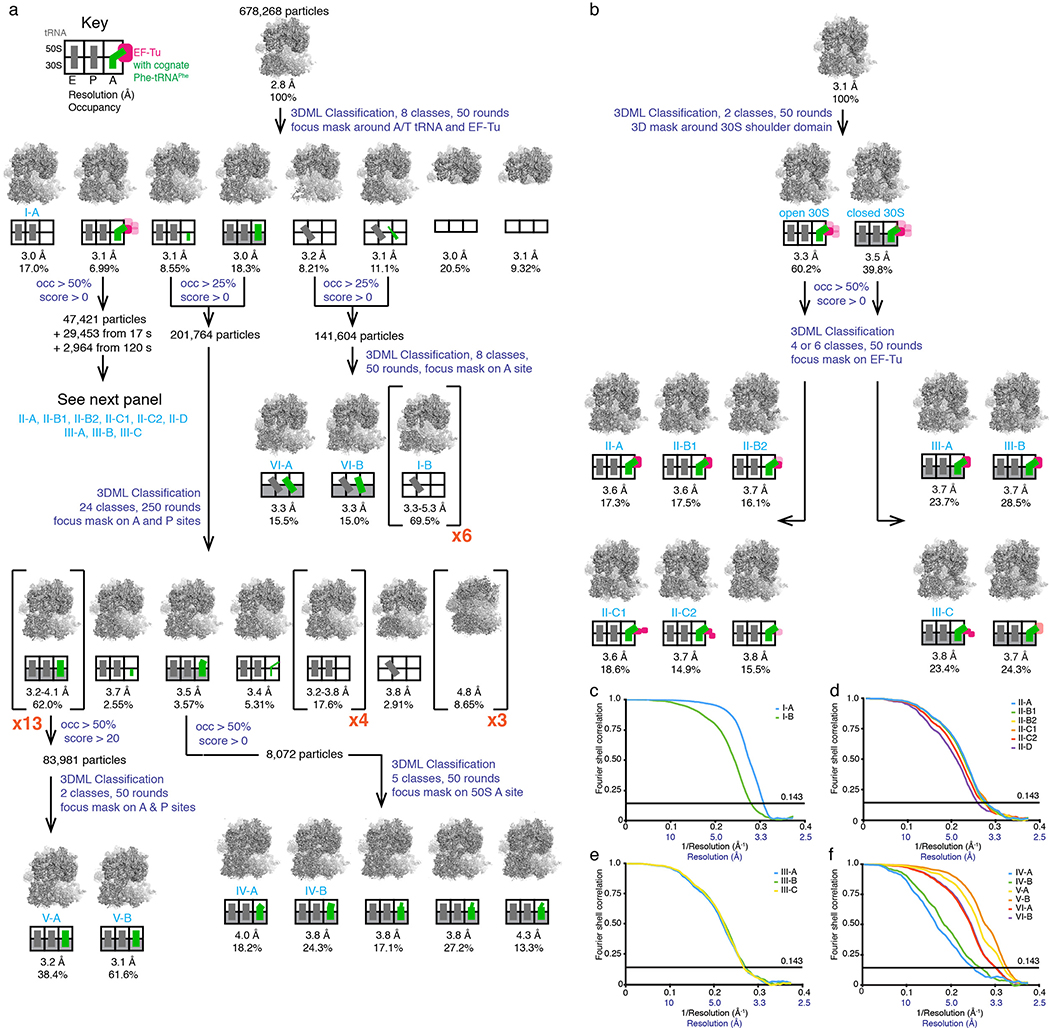
Extended Data Fig. 1.
Classification procedure and FSC curves for maps of cognate ternary complex decoding ( a ) Scheme of the maximum-likelihood classification strategy to obtain the final maps and state occupancies for t...
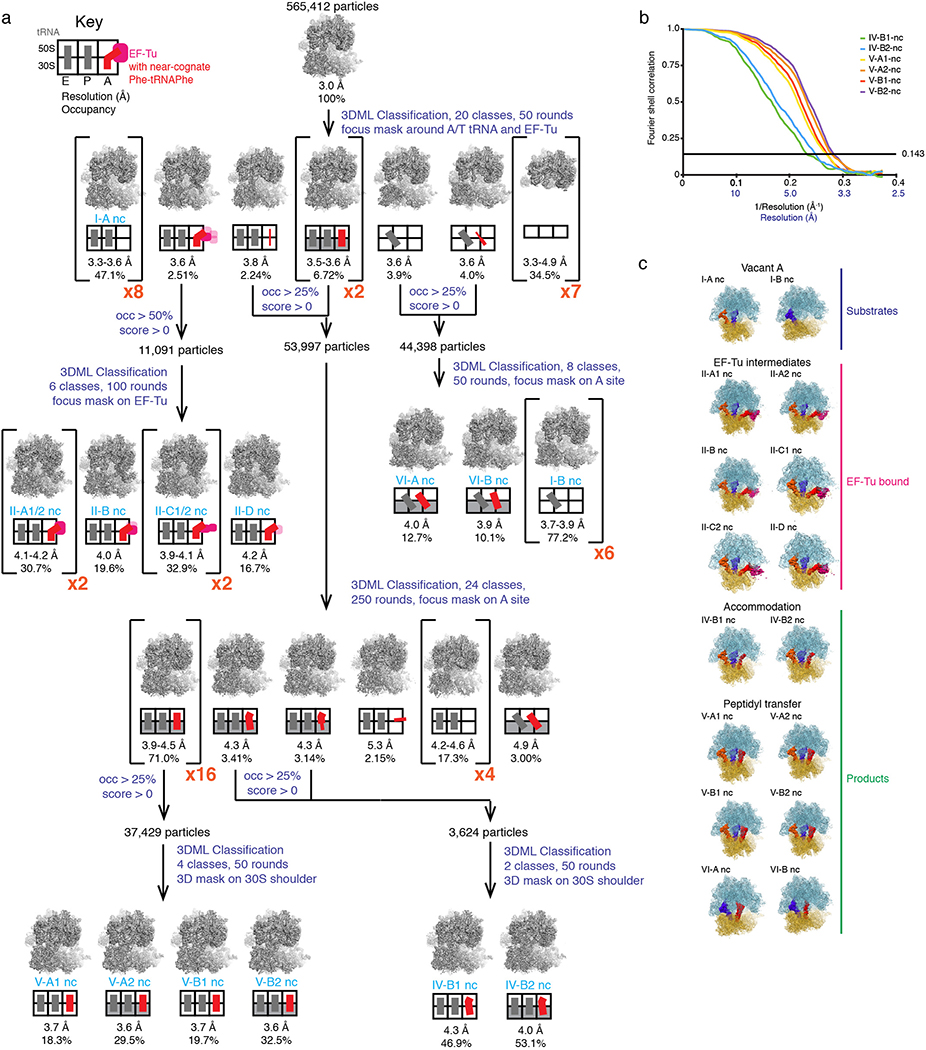
Extended Data Fig. 2.
Classification procedure and FSC curves for maps of near-cognate ternary complex decoding ( a ) Scheme depicts maximum-likelihood classification strategy to obtain the final maps and state occupancies...
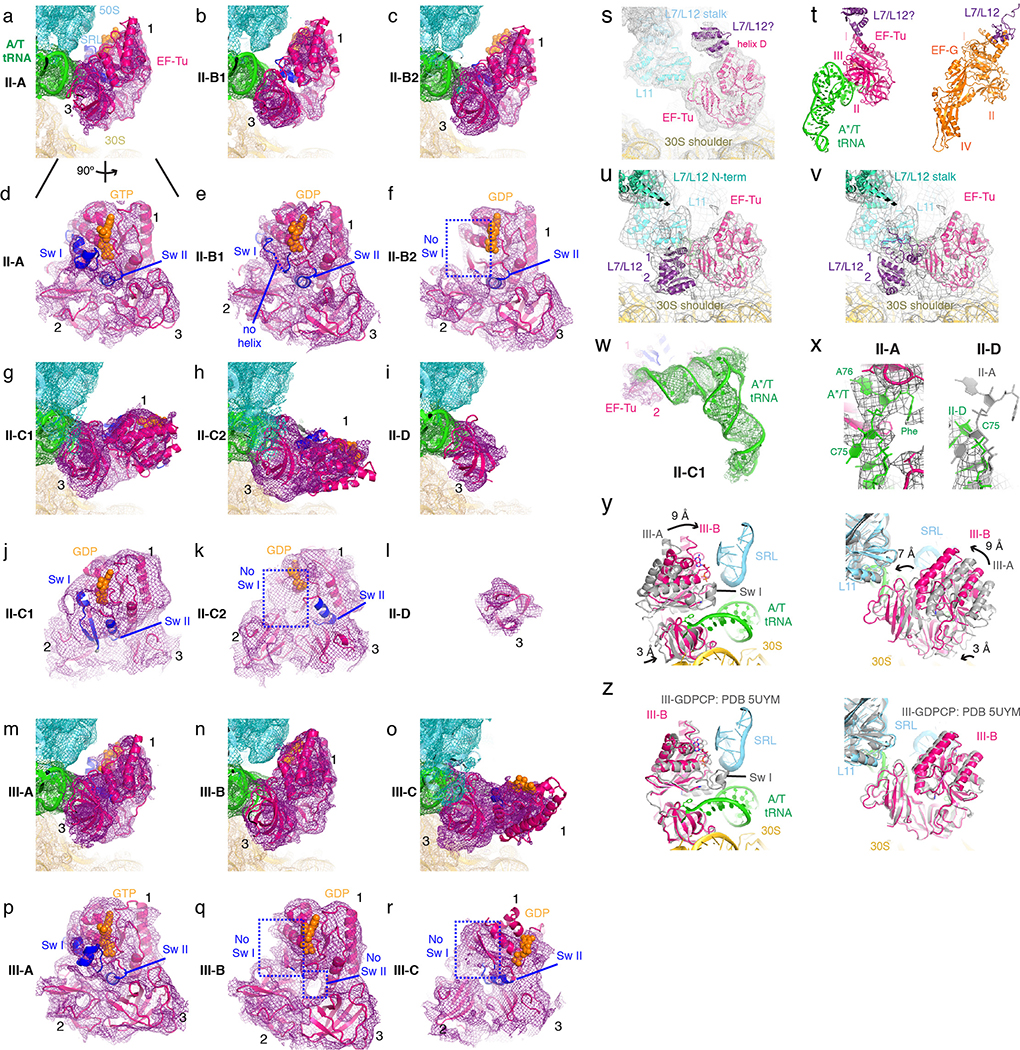
Extended Data Fig. 3.
Cryo-EM density and interactions of EF-Tu. ( a-r ) Density for EF-Tu in 30S-open (II) and 30S-closed (III) conformations is shown relative to the sarcin-ricin loop (SRL) (panels a-c , g-i , and m-o ) ...
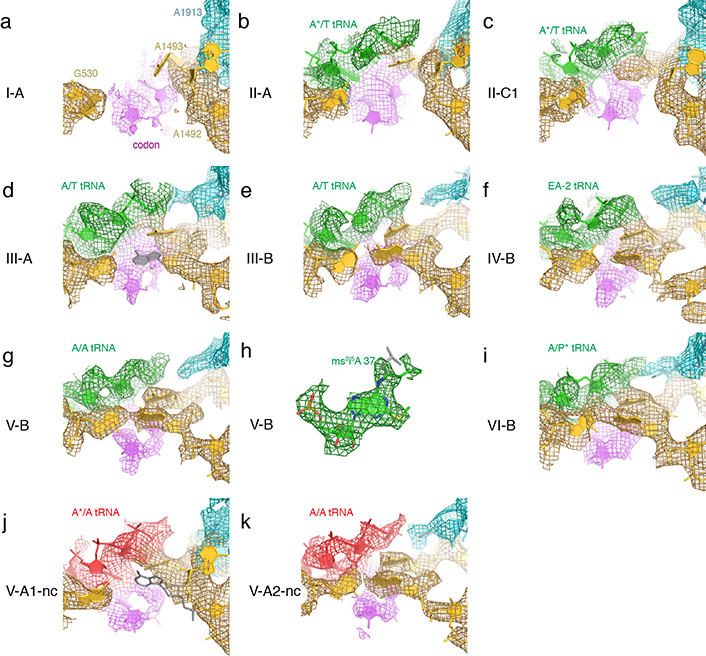
Extended Data Fig. 4.
Cryo-EM density of the decoding center of the open and closed 30S conformations. 16S rRNA is shown in yellow, 23S rRNA is shown in cyan, codon is shown in magenta, cognate tRNA is shown in green and n...
Extended Data Fig. 5.
Cryo-EM density for tRNAs during cognate and near-cognate tRNA decoding. Cognate tRNA is shown in green, near-cognate tRNA is shown in red, 23S rRNA including ASF (residues 860:915), H89 (residues 245...
Extended Data Fig. 6.
30S rotation in accommodation states and tRNA conformations in peptidyl-transfer states. ( a ) In state V-A, with a partially rotated 30S subunit, cryo-EM density is consistent with substrate aminoacy...
Extended Data Fig. 7.
Differences between near-cognate and cognate structural ensembles. ( a ) Comparison of particle populations in cognate and near-cognate samples (at 30 s) reveals more substrate and less intermediate (...
Extended Data Fig. 8.
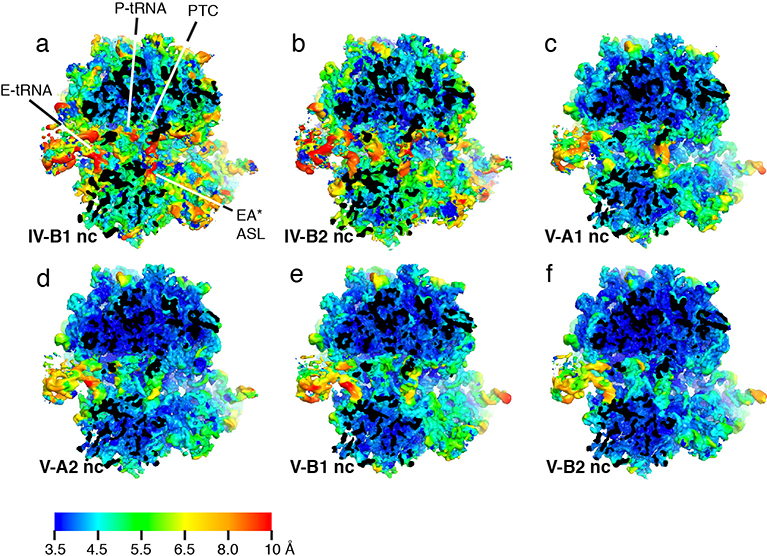
Local resolutions of each cognate modeled class assessed by blocres ( Methods ).
Extended Data Fig. 9.
Local resolutions of each near-cognate modeled class assessed by blocres ( Methods ).
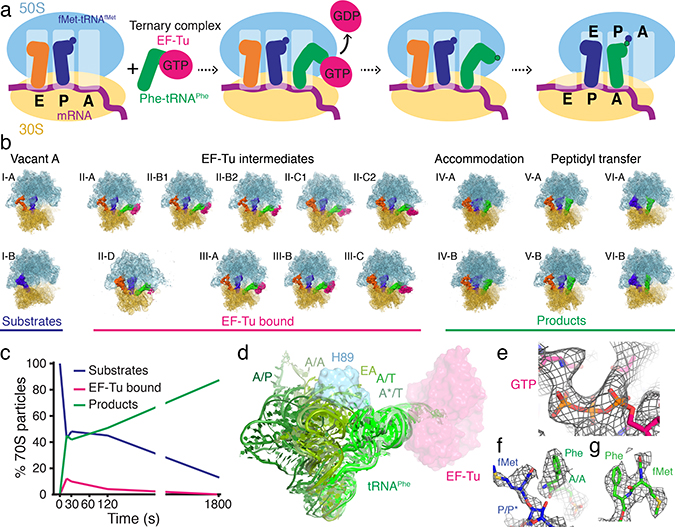
Fig. 1.
Cryo-EM of an elongation event reveals structural intermediates. ( a ) Scheme of the reaction of initiation 70Su2022fMet-tRNA fMet complex with cognate Phe-tRNA Phe u2022EF-Tuu2022GTP complex to form ...
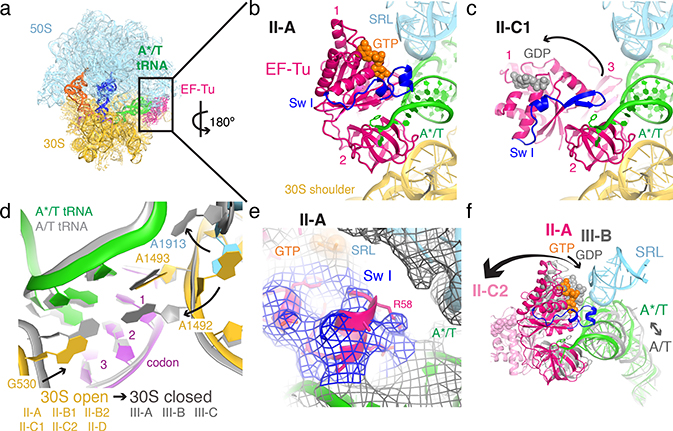
Fig. 2.
EF-Tu and ribosome rearrangements during mRNA decoding. ( a ) Overview of the 70S ribosome bound with ternary complex of Phe-tRNA Phe u2022EF-Tuu2022GTP (Structure II-A). ( b ) Compact EF-Tuu2022GTP w...
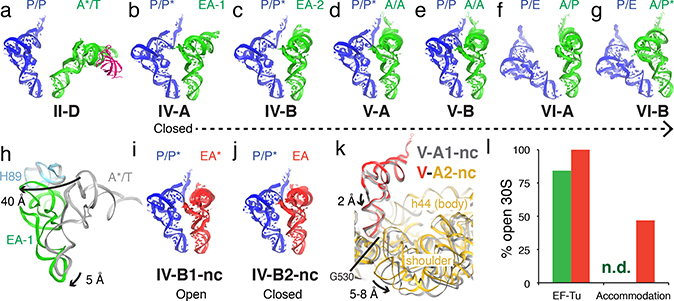
Fig. 3.
Differences between cognate (green) and near-cognate (red) tRNA accommodation.
( a-g ) Cognate tRNA after EF-Tu release samples closed 30S conformations from accommodation to peptidyl transfer to pre-translocation states: ( a ) EF-Tu domain 3 (magenta) is last to release from A*...
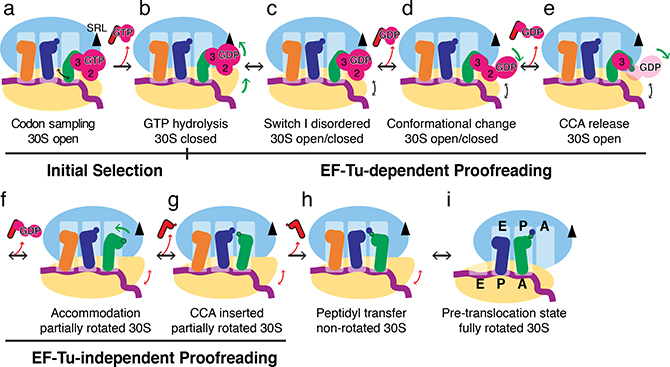
Fig. 4.
Schematic of mRNA decoding. Black arrows denote events and conformational changes (EF-Tu rearrangements, 30S domain closure, and/or tRNA or EF-Tu dissociation) on both cognate (green tRNA) and near-co...
Figure images are served from the NIH/NLM PubMed Central Open Access Subset or Europe PMC; copyright remains with the publishers and authors.
💬 Discussion
0 commentsNo comments yet. Be the first to start a discussion!
Leave a Comment