Abstract
The replicative DNA polymerase PolIIIα from Escherichia coli is a uniquely fast and processive enzyme. For its activity it relies on the DNA sliding clamp β, the proofreading exonuclease ε and the C-terminal domain of the clamp loader subunit τ. Due to the dynamic nature of the four-protein complex it has long been refractory to structural characterization. Here we present the 8 Å resolution cryo-electron microscopy structures of DNA-bound and DNA-free states of the PolIII-clamp-exonuclease-τc complex. The structures show how the polymerase is tethered to the DNA through multiple contacts with the clamp and exonuclease. A novel contact between the polymerase and clamp is made in the DNA bound state, facilitated by a large movement of the polymerase tail domain and τc. These structures provide crucial insights into the organization of the catalytic core of the replisome and form an important step towards determining the structure of the complete holoenzyme.
🔬 Techniques
🧬 Organisms
🔬 Cell Lines
🏭 Microscope Brands
🧪 Reagent Suppliers
💻 Software Details
📋 Protocols
💾 Data Repositories
🏛️ Research Organizations (ROR)
Affiliated research institutions:
📋 Methods
Materials All chemicals and oligonucleotides were purchased from Sigma-Aldrich (Gillingham, United Kingdom) and chromatography columns from GE healthcare (Little Chalfont, United Kingdom).
Protein expression and purification
To increase binding to the clamp, amino acid residues 920–924 of E. coli PolIIIα were changed by site directed mutagenesis from QADMF to QLDLF, while in the exonuclease residues 182–187 were changed from QTSMAF to QLSLPL, based on sequences described in ( Wijffels et al., 2004 ). All proteins were expressed in E. coli (DE3) BL21. PolIIIα, clamp and exonuclease were expressed and purified as described before ( Toste Rêgo et al., 2013 ). τ 500 was purified by Histrap HP column, Resource S column, and a Superdex 75 gel filtration column. His-tags were removed by proteolytic cleavage with human rhinovirus 3C protease. Proteins were flash frozen in liquid nitrogen and stored at -80°.
Gel filtration analysis
Proteins were analyzed by gel filtration using a 2.4 mL Superdex 200 Increase column (GE healthcare) in 25 mM Hepes pH 7.5, 150 mM NaCl, and 2 mM DTT. PolIIIα-clamp-exonuclease complex was assembled at 10, 1, and 0.1 μM and 50 μL injected onto the column. Electro mobility shift assay A DNA substrate identical to the substrate used for the cryo-EM samples was used, with the exception of a 6-carboxyfluorescein (6-FAM) at the 5' end of the primer strand and a phosphorothioate link at the 3' terminal bond to prevent exonuclease digestion. 5 nM DNA was incubated with 2.5 μM polymerase ( E. coli Pol I (Klenow fragment), Pol II, Pol IIIα, or Pol IV) for 10 min at room temperature. Reaction mixtures contained 20 mM Tris pH 7.5, 4% glycerol, 5 mM DTT, 40 μg/ml BSA, and 40 mM Potassium Glutamate. Half of the sample was separated on a native 6% acrylamide gel and imaged on a Typhoon laser scanner (GE Healthcare). The remaining half of the sample was analyzed on a denaturing 4–12% SDS acrylamide gel and stained with Coomassie blue. Sample preparation for cryo-EM The PolIIIα-clamp-exonuclease-τ 500 protein complex was assembled from the individual components to a final concentration of 15 μM and purified on a 2.4 mL Superdex 200 Increase gel filtration column (GE Healthcare) in 25 mM Hepes pH 7.5, 50 mM Potassium Glutamate, 3 mM Magnesium Acetate, and 2 mM DTT. The peak fraction (∼4 μM) was retrieved and incubated for 5 min with 20 μM of a 25 bp DNA substrate with a 4 nt overhang (template: 5′-TCAGGAGTCCTTCGTCCTAGTACTACTCC-3′, primer: 5′-GGAGTAGTACTAGGACGAAGGACTC-3′) for 5 min at room temperature. Subsequently, 0.1 volume of 0.05% (V/V) Tween 20 was added and incubated for another 5 min before the samples were pipetted onto glow-discharged holey carbon cryo-EM grids (Quantifoil Cu R1.2/1.3), and frozen in liquid ethane using a Vitrobot (FEI, Hillsboro, OR).
Show full methods section
Materials All chemicals and oligonucleotides were purchased from Sigma-Aldrich (Gillingham, United Kingdom) and chromatography columns from GE healthcare (Little Chalfont, United Kingdom).
Protein expression and purification
To increase binding to the clamp, amino acid residues 920–924 of E. coli PolIIIα were changed by site directed mutagenesis from QADMF to QLDLF, while in the exonuclease residues 182–187 were changed from QTSMAF to QLSLPL, based on sequences described in ( Wijffels et al., 2004 ). All proteins were expressed in E. coli (DE3) BL21. PolIIIα, clamp and exonuclease were expressed and purified as described before ( Toste Rêgo et al., 2013 ). τ 500 was purified by Histrap HP column, Resource S column, and a Superdex 75 gel filtration column. His-tags were removed by proteolytic cleavage with human rhinovirus 3C protease. Proteins were flash frozen in liquid nitrogen and stored at -80°.
Gel filtration analysis
Proteins were analyzed by gel filtration using a 2.4 mL Superdex 200 Increase column (GE healthcare) in 25 mM Hepes pH 7.5, 150 mM NaCl, and 2 mM DTT. PolIIIα-clamp-exonuclease complex was assembled at 10, 1, and 0.1 μM and 50 μL injected onto the column. Electro mobility shift assay A DNA substrate identical to the substrate used for the cryo-EM samples was used, with the exception of a 6-carboxyfluorescein (6-FAM) at the 5' end of the primer strand and a phosphorothioate link at the 3' terminal bond to prevent exonuclease digestion. 5 nM DNA was incubated with 2.5 μM polymerase ( E. coli Pol I (Klenow fragment), Pol II, Pol IIIα, or Pol IV) for 10 min at room temperature. Reaction mixtures contained 20 mM Tris pH 7.5, 4% glycerol, 5 mM DTT, 40 μg/ml BSA, and 40 mM Potassium Glutamate. Half of the sample was separated on a native 6% acrylamide gel and imaged on a Typhoon laser scanner (GE Healthcare). The remaining half of the sample was analyzed on a denaturing 4–12% SDS acrylamide gel and stained with Coomassie blue. Sample preparation for cryo-EM The PolIIIα-clamp-exonuclease-τ 500 protein complex was assembled from the individual components to a final concentration of 15 μM and purified on a 2.4 mL Superdex 200 Increase gel filtration column (GE Healthcare) in 25 mM Hepes pH 7.5, 50 mM Potassium Glutamate, 3 mM Magnesium Acetate, and 2 mM DTT. The peak fraction (∼4 μM) was retrieved and incubated for 5 min with 20 μM of a 25 bp DNA substrate with a 4 nt overhang (template: 5′-TCAGGAGTCCTTCGTCCTAGTACTACTCC-3′, primer: 5′-GGAGTAGTACTAGGACGAAGGACTC-3′) for 5 min at room temperature. Subsequently, 0.1 volume of 0.05% (V/V) Tween 20 was added and incubated for another 5 min before the samples were pipetted onto glow-discharged holey carbon cryo-EM grids (Quantifoil Cu R1.2/1.3), and frozen in liquid ethane using a Vitrobot (FEI, Hillsboro, OR).
Data collection and image processing
All data was collected using a Titan Krios electron microscope (FEI) operated at 300 kV equipped with a K2 summit direct electron detector (Gatan, Pleasaston, CA). Although this detector was mounted after a Gatan Imaging Filter (GIF), the filter was not used to remove any inelastic scattering. Images were collected in single-electron counting mode at a calibrated magnification of 28.571x (1.76 Å/pixel), using a flux of 2 e/Å 2 /sec and a total dose of 40 e/Å 2 over a total of 20 frames. Frames were aligned and averaged using whole-image movement correction using MOTIONCORR ( Li et al., 2013 ). Contrast transfer function parameters were calculated using CTFFIND3 ( Mindell and Grigorieff, 2003 ). All subsequent particle picking and data processing was performed using Relion-1.3 ( Scheres, 2012 ), with the exception of the generation of the initial model, which was done using Eman2 ( Tang et al., 2007 ). A total of 1350 micrographs were recorded from which >550,000 particles were picked automatically in Relion. After 2D classification, a large number of spurious particles as well as particles that show free polymerase or free clamp were removed, yielding a dataset of ∼90,000 particles. After 3D classification a another ∼27,000 were removed to yield a final dataset of 63,215 particles. From these, six 3D classes were calculated that were subsequently merged into the final three 3D classes of 'DNA-free' (16,970 particles), 'DNA-bound' (5663 particles) and 'DNA-bound, no tail' (40,582 particles). Particle-based movement correction and per-frame B-factor weighting to account for radiation damage and unresolved particle movement was performed in the later stages of refinement using the particle polishing option in Relion ( Scheres, 2014 ). Reported resolutions are based on the gold-standard FSC-0.143 criterion ( Scheres and Chen, 2012 ) and FSC-curves were corrected for the convolution effects of a soft mask using high-resolution noise-substitution ( Chen et al., 2013 ). All density maps were sharpened by applying a negative B-factor that was estimated using automated procedures ( Rosenthal and Henderson, 2003 ). We believe that the resolution of these reconstructions is limited by both the relatively small size of the complex (250 kDa), which hampers accurate alignment and classification, and the inherent flexibility of this four-protein and DNA complex. Still, the maps are of excellent quality, with individual helices, β-sheets, and loops clearly visible in the map ( Figure 1C ). Fitting of the crystal structures into the cryo-EM map Individual crystal or NMR structures were manually placed into the cryo-EM map in PyMOL ( Schrödinger, LLC 2010 ) and subsequently rigid-body fitted into the density using Coot ( Emsley et al., 2010 ). PDB codes of the fitted structures are: PolIIIα: 2HNH ( Lamers et al., 2006 ), clamp: 2POL ( Kong et al., 1992 ), exonuclease: 1J54 ( Hamdan, et al., 2002 ), τ 500 : 2AYA ( Su et al., 2007 ). The C-terminal tail of Eco PolIIIα that is lacking in the crystal structure (2HNH) was modeled as described in ( Toste Rêgo et al., 2013 ). The PolIIIα structure was divided into five domains that were further fitted independently into density as rigid bodies (see Figure 1—figure supplement 3B,C ). These domains were: PHP (residues 1–280), palm-fingers (residues 281–432 + 510–810), thumb (residues 433–509), tip-of-fingers (residues 811–928) and C-terminal tail (residues 929–1160). Clamp binding motifs of PolIIIα and exonuclease were manually built into the clamp in Coot guided by the crystal structures of clamp-bound peptides from Pol II and Pol IV, ( Bunting et al., 2003 ; Georgescu et al., 2008b ; Jeruzalmi et al., 2001 ). The DNA substrate was generated with Coot, and the last four base pairs of the DNA were adjusted guided by the DNA from Taq Pol IIIα ( Wing et al., 2008 ). Comparison of DNA polymerase structures The following crystal structures of C family DNA polymerases were used to compare DNA binding and τ binding.
DNA bound Taq PolIIIα
(PDB code: 3E0D [ Wing et al., 2008 ]), τ bound Taq PolIIIα (PDB code: 4IQJ [ Liu et al., 2013 ]), DNA bound G. kaustophilus PolC (PDB code: 3F2B [ Evans et al., 2008 ]). Crystal structures of bacterial DNA polymerases in complex with DNA were used to compare the distance between the polymerase active site and the opening to the clamp. The following structures were used: T. aquaticus DNA Pol I (PDB code: 1QTM [ Li et al., 1999 ]), E. coli Pol II (PDB code: 3K57 [ Wang and Yang, 2009 ]), E. coli PolIIIα (this work), and E. coli Pol IV (PDB code: 4IRD [ Sharma et al., 2013 ]). For the structures of Pol I, Pol II, and Pol IV, the sliding clamp (PDB code: 2POL [ Kong et al., 1992 ]) was manually placed close to the clamp binding sequences in the different polymerases, taking care not to cause any clashes with other parts of the polymerase.
Materials All chemicals and oligonucleotides were purchased from Sigma-Aldrich (Gillingham, United Kingdom) and chromatography columns from GE healthcare (Little Chalfont, United Kingdom).
📊 Figures
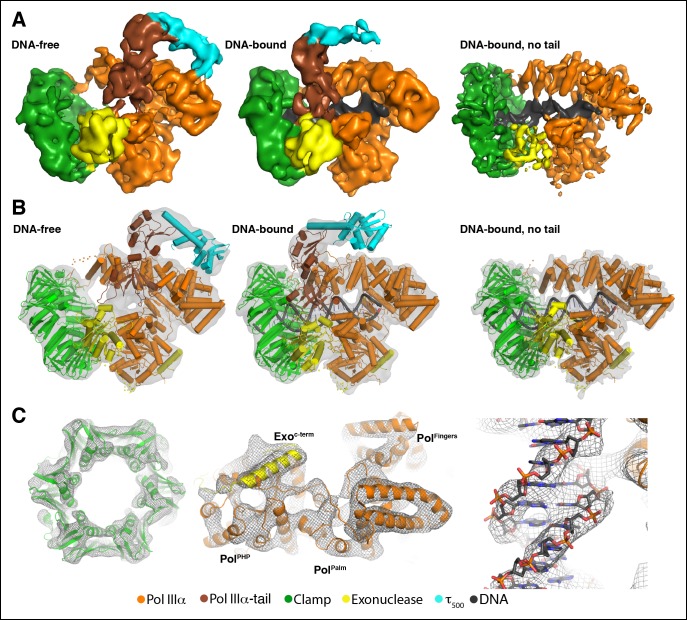
Figure 1.
Cryo-EM structures of the E. coli PolIIIu03b1-clamp-exonuclease-u03c4 500 complex.
( A ) Surface representation of the three structures, shown atn5 u03c3. Left to right: DNA-free, DNA-bound, and DNA-bound without tail.nColors indicate the position of the different proteinsn( B ) Ind...
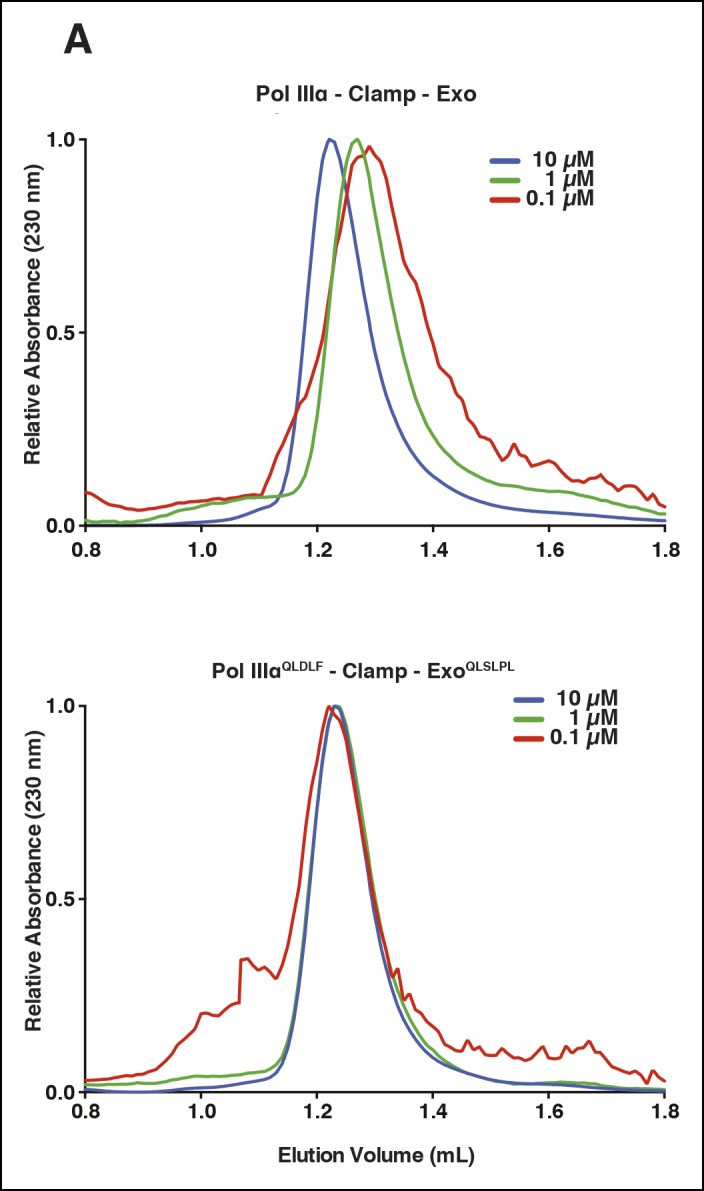
Figure 1u2014figure supplement 1.
Characterization of improved clamp binding mutants.
( A ) Gel filtration analysis of the wild-typenPolIIIu03b1-clamp-exonuclease complex (top panel) and thenPolIIIu03b1 QLDLF -clamp-exonuclease QLSLPL complexn(lower panel). The wild-type complex dissoc...
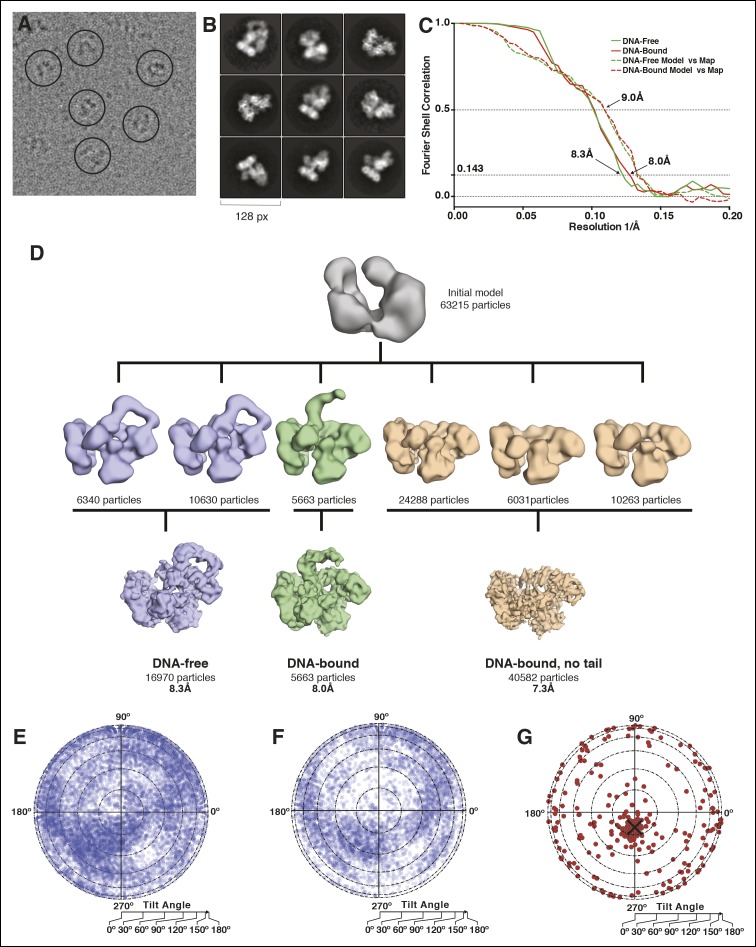
Figure 1u2014figure supplement 2.
Microscopy data analysis and validation.
( A ) Typical micrograph of thenPolIIIu03b1-clamp-exonuclease-u03c4 500 -DNA complex.n( B ) 2D class averages derived from thenfinal 63,215 particle dataset ( C ) Fourier shellncorrelation for the DNA...
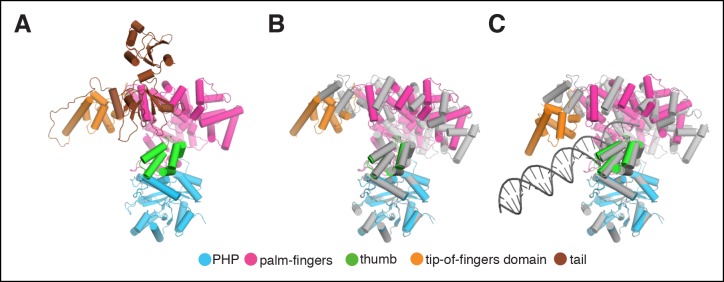
Figure 1u2014figure supplement 3.
Rigid body movements in PolIIIu03b1.
( A ) Domain definitions used for the rigid bodynfitting of the PolIIIu03b1 structure into the cryo-EM maps. Domain boundariesnare: PHP (residues 1u2013280), palm-fingers (residues 281u2013432 + 510u2...
Video 1.
Structure of the DNA-free complex of PolIIu03b1-clamp-exonuclease-u03c4 500 , Related to Figure 1 .
Fitting of the high-resolution structures into the cryo-EM map of the DNA-freencomplex. DOI: http://dx.doi.org/10.7554/eLife.11134.007
Video 2.
Structure of the DNA-bound complex of PolIIu03b1-clamp-exonuclease-u03c4 500 , Related to Figure 1 .
Fitting of the high-resolution structures into the cryo-EM map of the DNA-boundncomplex. DOI: http://dx.doi.org/10.7554/eLife.11134.008
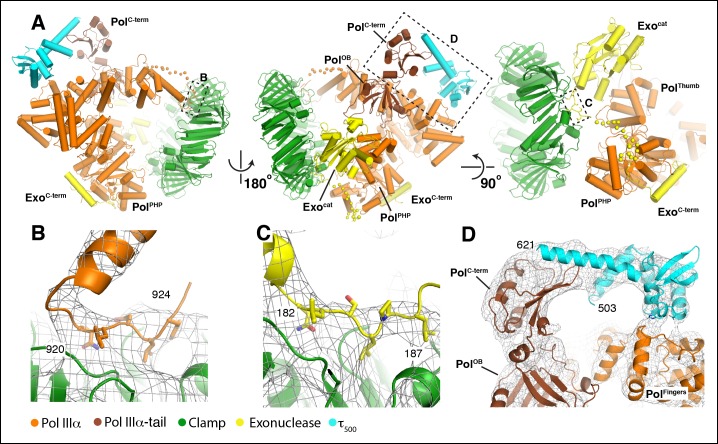
Figure 2.
Multiple contacts between the subunits hold the complex together.
( A ) Three different views of the DNA-freencomplex of PolIIIu03b1-clamp-exonuclease-u03c4 500 showing extensivencontacts between the polymerase and other subunits. Missing loops innPolIIIu03b1 (resid...
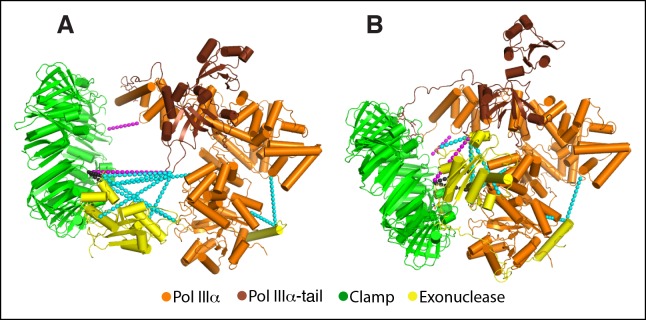
Figure 2u2014figure supplement 1.
Previously determined cross-links fit accurately with the cryo-EM model.
( A ) Model of the polymerase-clamp-exonucleasencomplex based on chemical cross-links reported in ( Toste Ru00eago et al., 2013 ). Magenta dashed lines:npolymerase-clamp cross-links. Cyan dashed lines...
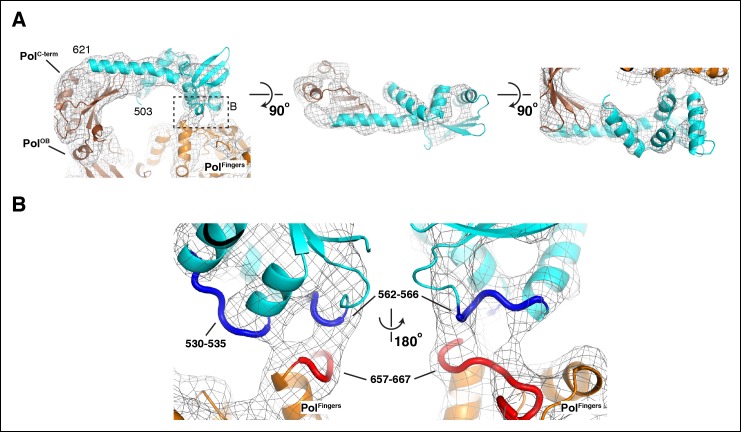
Figure 2u2014figure supplement 2.
Details of the interactions between u03c4 500 and the PolIIIu03b1 fingers domain.
( A ) Three orthogonal views of the fit of u03c4 500 into the cryo-EM density. Dashed box in left panel indicates view shownnin panel B. ( B ) Detailed view of thenu03c4 500 - PolIIIu03b1 fingers doma...
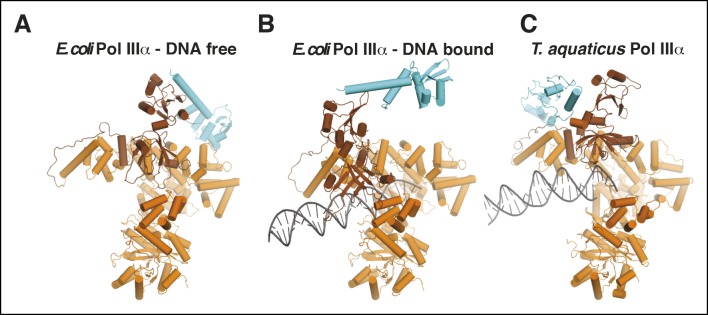
Figure 2u2014figure supplement 3.
Comparison of u03c4 binding in E. coli and Taq PolIIIu03b1.
( A,B ) DNA-free and DNA-bound E. colinPolIIIu03b1-u03c4 500 . The clamp and exonuclease are omitted fornclarity. ( C ) Taq PolIIIu03b1-u03c4 c ( Liu et al., 2013 ). DOI: http://dx.doi.org/10.7554/eLi...
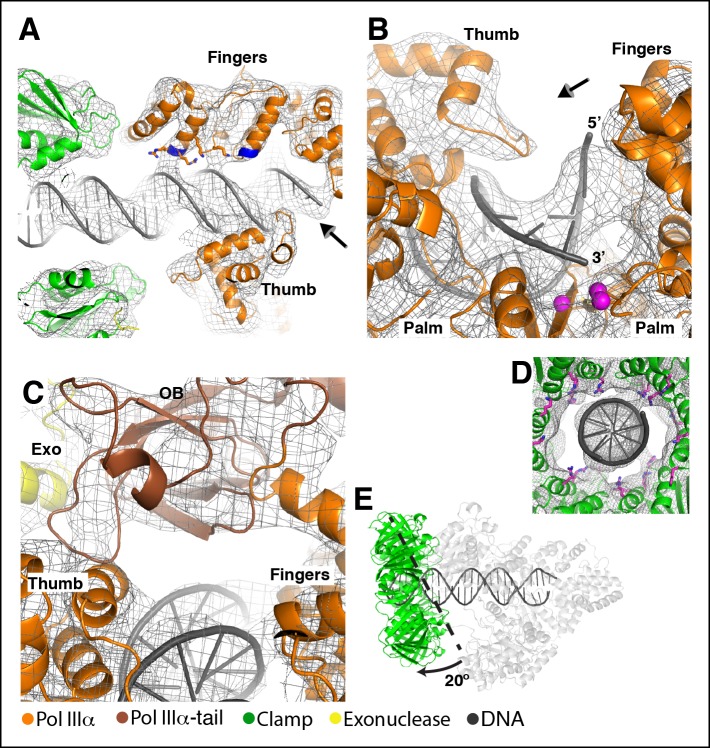
Figure 3.
The DNA has extensive contacts with PolIIIu03b1 and clamp.
( A ) Overview of the DNA-bound complex. ThenN-termini of the two helices that point at the DNA backbone are colorednin blue. Potential DNA interacting side chains are shown in sticks. Thentail of Pol...
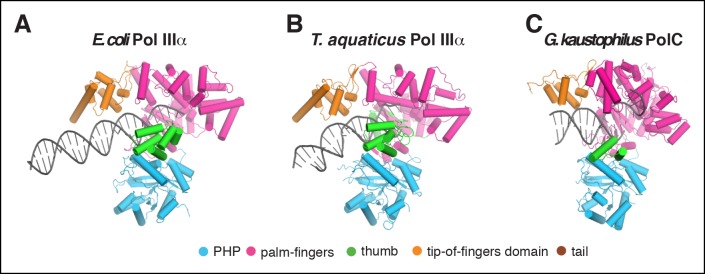
Figure 3u2014figure supplement 1.
Comparison of DNA binding by C family DNA polymerases.
( A ) E. coli PolIIIu03b1, ( B ) T. aquaticus PolIIIu03b1 ( Wing et al., 2008 ), ( C ) G.nkaustophilus PolC ( Evans etnal., 2008 ). DOI: http://dx.doi.org/10.7554/eLife.11134.014
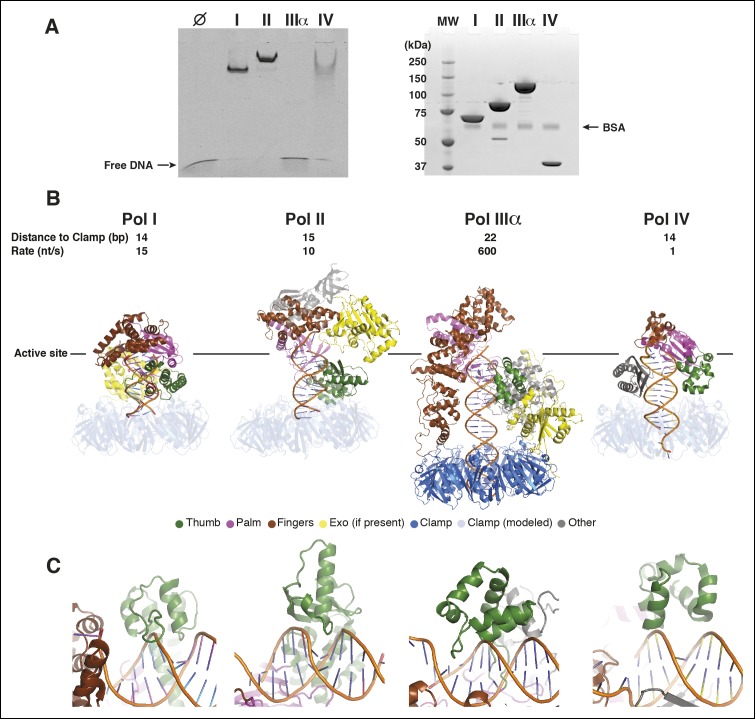
Figure 3u2014figure supplement 2.
Polu00a0IIIu03b1 has more extensive DNA interactions than other DNA polymerases.
( A ) Left panel: Electro-mobility shift assaynwith the E. coli DNA polymerases Pol I (Klenownfragment), Pol II, Pol IIIu03b1, and Pol IV. At 2.5 u03bcM Pol I, Pol II, and PolnIV retain DNA, whereas P...
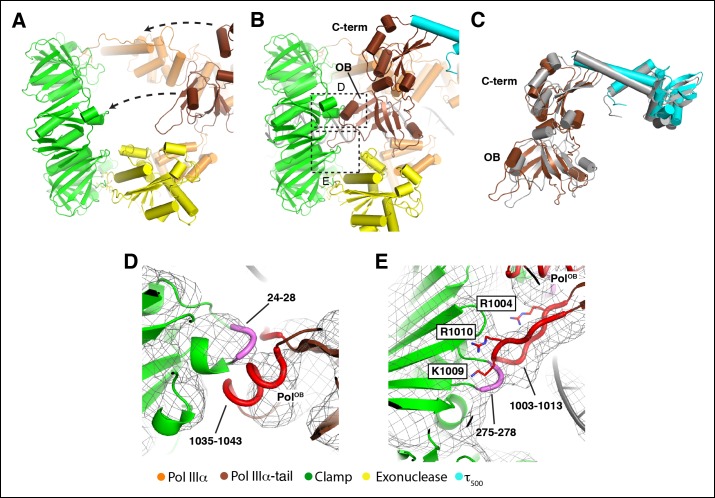
Figure 4.
DNA binding induces large conformational changes in the polymerase.
( A ) Clamp binding by PolIIIu03b1 in the DNA-freencomplex. Arrows indicate movement of the PolIIIu03b1 tail (see also Video 3 ).n( B ) Clamp binding by PolIIIu03b1 in the DNA-boundncomplex. Dashed bo...
Video 3.
DNA binding induces large conformational changes in the complex, Related to Figure 4 .
Linear morphing of the DNA-free to DNA-bound state showing the largenconformational change between the two states. DOI: http://dx.doi.org/10.7554/eLife.11134.017
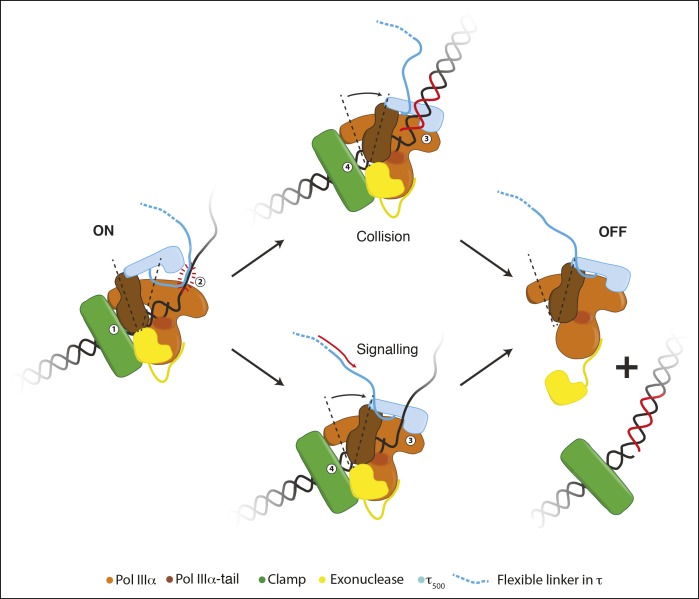
Figure 5.
Schematic representation for a possible role of the conformational changes in the polymerase.
During processive DNA synthesis, the tail of the polymerase is attached to thenclamp (indicated with u20181u2019) and pulls u03c4 500 away from the polymerasenfingers domain. This conformation may be ...
Figure images are served from the NIH/NLM PubMed Central Open Access Subset or Europe PMC; copyright remains with the publishers and authors.
💬 Discussion
0 commentsNo comments yet. Be the first to start a discussion!
Leave a Comment