Abstract
Methanogenic archaea use a [NiFe]-hydrogenase, Frh, for oxidation/reduction of F420, an important hydride carrier in the methanogenesis pathway from H2 and CO2. Frh accounts for about 1% of the cytoplasmic protein and forms a huge complex consisting of FrhABG heterotrimers with each a [NiFe] center, four Fe-S clusters and an FAD. Here, we report the structure determined by near-atomic resolution cryo-EM of Frh with and without bound substrate F420. The polypeptide chains of FrhB, for which there was no homolog, was traced de novo from the EM map. The 1.2-MDa complex contains 12 copies of the heterotrimer, which unexpectedly form a spherical protein shell with a hollow core. The cryo-EM map reveals strong electron density of the chains of metal clusters running parallel to the protein shell, and the F420-binding site is located at the end of the chain near the outside of the spherical structure. DOI:http://dx.doi.org/10.7554/eLife.00218.001.
🔬 Techniques
🔭 Microscopes
🧬 Organisms
🧪 Sample Preparation
🏭 Microscope Brands
📷 Detectors
💻 Software Details
📋 Protocols
💾 Data Repositories
🏛️ Research Organizations (ROR)
Affiliated research institutions:
📋 Methods
Cultivation Methanothermobacter marburgensis (DSM 2133) was obtained from the Deutsche Sammlung von Mikroorganismen (DSMZ, Braunschweig, Germany). The archaeon was grown anaerobically at 65°C on 80% H 2 /20% CO 2 /0.1% H 2 S in a 12-L fermenter containing 10 L complete mineral salt medium ( Schönheit et al., 1980 ). Cells were harvested by the use of a continuous-flow centrifuge under anoxic conditions at the late exponential phase and stored at −80°C.
Purification of the Frh complex from M. marburgensis
Purification was performed under strictly anaerobic conditions at 18°C in an anaerobic camper (Coy Laboratory Products, Grass Lake, MI). All buffers used contained 2 mM DTT and 25 µM FAD. Cell extracts were routinely prepared from 20 g (wet mass) of M. marburgensis cells. The cells were suspended in 35 ml 50 mM Tris/HCl pH 7.6 (buffer A), and passed four times through a French pressure cell at 125 MPa. Cell debris were removed by centrifugation at 15,000×g for 30 min. The supernatant, designated cell extract and containing ∼1000 mg protein, was adjusted to 800 mM ammonium sulfate in buffer A and stirred for 20 min. The cell extract was applied to a Phenyl Sepharose 6 Fast Flow column (6 × 10 cm) equilibrated with 800 mM (NH 4 ) 2 SO 4 in buffer A. Protein was eluted by a (NH 4 ) 2 SO 4 step gradient in buffer A: 800 mM (NH 4 ) 2 SO 4 for 250 ml, 200 mM (NH 4 ) 2 SO 4 for 250 ml, and 0 mM (NH 4 ) 2 SO 4 for 50 ml (flow rate: 8 ml/min). The Frh activity was eluted in the 0 mM (NH 4 ) 2 SO 4 fractions. The protein solution was concentrated with ultrafiltration by Amicon filters (100-kDa cutoff) to 4–5 ml, which were then applied to a Sephacryl S-400 HR column (2.6 × 60 cm) equilibrated with buffer B (buffer A + 150 mM NaCl). The Frh activity was eluted after washing the column with 180 ml buffer B (flow rate: 1 ml/min). The pooled fractions were concentrated with ultrafiltration by Amicon filters (100-kDa cutoff) to 20 mg/ml. CHAPS was added to the concentrate (48 mM final concentration), and the solution was incubated for 12 hr at room temperature with slow stirring. The protein solution was washed 5 times on Amicon filters (100-kDa cutoff) with buffer A with 4 mM CHAPS (buffer A2) and applied to a MonoQ column (1 × 8 cm) equilibrated with buffer A2. Protein was eluted by a NaCl linear gradient in buffer A2: 0–400 mM NaCl in 25 ml and then 400–600 mM NaCl in 20 ml (flow rate: 0.8 ml/min). In the linear gradient of 400–600 mM NaCl, the active Frh was eluted from the column at a concentration of 540 mM NaCl. The protein solution was concentrated on Amicon filters (100-kDa cutoff) to 2 ml and further purified on a Sephacryl S-400 HR column in order to remove remaining smaller particles and bigger aggregates. F 420 was isolated from M. marburgensis by established methods ( Shima and Thauer, 2001 ). Cryo-electron microscopy 3 µl of a 0.7 mg/ml Frh sample was applied to freshly glow discharged Quantifoil R1/4 grids (Quantifoil Micro Tools, Jena, Germany) that had been pretreated for 15 s in chloroform. The |grids were blotted in an FEI Vitrobot using a 2.5 s blotting time at 70% humidity and 10°C and plunge-frozen in liquid ethane. For collection of data of Frh in the presence of substrate, 0.5, 1.0, or 10 mM F 420 was added to the sample under oxygen-free conditions just prior to grid preparation. Images were collected at liquid nitrogen temperature on an FEI Tecnai Polara operated at 200 kV. Before images were recorded, the microscope was carefully aligned in an iterative process to correct for objective astigmatism and beam tilt by coma-free alignment ( Glaeser et al., 2011 ). The corrections were carried out at a dose of 15 e − /Å 2 and at half the defocus value used for collecting the images, and were repeated for each grid square from which images were collected. The alignments were done with a Gatan 4k × 4k CCD using unbinned images. Images were recorded on Kodak SO-163 film at a magnification of 59,000× with a dose of 10–15 e − /Å 2 at a defocus of 1.5–2.8 µm. The film was developed for 12 min in full-strength Kodak D-19 developer and fixed for 8 min in Kodak Rapid Fix. Five hundred and six negatives were collected of substrate-free Frh and 512 of Frh with F 420 . Films that showed obvious flaws (too thin ice with particles just around the edge of the Quantifoil hole, too high particle concentration, broken ice, obvious drift) were discarded. Four hundred and two negatives of substrate-free Frh were scanned and 277 of F 420 with Frh. The latter preparation had a higher protein concentration, resulting in many films with too many overlapping particles. This was more than compensated by the higher number of particles per film.
Show full methods section
Cultivation Methanothermobacter marburgensis (DSM 2133) was obtained from the Deutsche Sammlung von Mikroorganismen (DSMZ, Braunschweig, Germany). The archaeon was grown anaerobically at 65°C on 80% H 2 /20% CO 2 /0.1% H 2 S in a 12-L fermenter containing 10 L complete mineral salt medium ( Schönheit et al., 1980 ). Cells were harvested by the use of a continuous-flow centrifuge under anoxic conditions at the late exponential phase and stored at −80°C.
Purification of the Frh complex from M. marburgensis
Purification was performed under strictly anaerobic conditions at 18°C in an anaerobic camper (Coy Laboratory Products, Grass Lake, MI). All buffers used contained 2 mM DTT and 25 µM FAD. Cell extracts were routinely prepared from 20 g (wet mass) of M. marburgensis cells. The cells were suspended in 35 ml 50 mM Tris/HCl pH 7.6 (buffer A), and passed four times through a French pressure cell at 125 MPa. Cell debris were removed by centrifugation at 15,000×g for 30 min. The supernatant, designated cell extract and containing ∼1000 mg protein, was adjusted to 800 mM ammonium sulfate in buffer A and stirred for 20 min. The cell extract was applied to a Phenyl Sepharose 6 Fast Flow column (6 × 10 cm) equilibrated with 800 mM (NH 4 ) 2 SO 4 in buffer A. Protein was eluted by a (NH 4 ) 2 SO 4 step gradient in buffer A: 800 mM (NH 4 ) 2 SO 4 for 250 ml, 200 mM (NH 4 ) 2 SO 4 for 250 ml, and 0 mM (NH 4 ) 2 SO 4 for 50 ml (flow rate: 8 ml/min). The Frh activity was eluted in the 0 mM (NH 4 ) 2 SO 4 fractions. The protein solution was concentrated with ultrafiltration by Amicon filters (100-kDa cutoff) to 4–5 ml, which were then applied to a Sephacryl S-400 HR column (2.6 × 60 cm) equilibrated with buffer B (buffer A + 150 mM NaCl). The Frh activity was eluted after washing the column with 180 ml buffer B (flow rate: 1 ml/min). The pooled fractions were concentrated with ultrafiltration by Amicon filters (100-kDa cutoff) to 20 mg/ml. CHAPS was added to the concentrate (48 mM final concentration), and the solution was incubated for 12 hr at room temperature with slow stirring. The protein solution was washed 5 times on Amicon filters (100-kDa cutoff) with buffer A with 4 mM CHAPS (buffer A2) and applied to a MonoQ column (1 × 8 cm) equilibrated with buffer A2. Protein was eluted by a NaCl linear gradient in buffer A2: 0–400 mM NaCl in 25 ml and then 400–600 mM NaCl in 20 ml (flow rate: 0.8 ml/min). In the linear gradient of 400–600 mM NaCl, the active Frh was eluted from the column at a concentration of 540 mM NaCl. The protein solution was concentrated on Amicon filters (100-kDa cutoff) to 2 ml and further purified on a Sephacryl S-400 HR column in order to remove remaining smaller particles and bigger aggregates. F 420 was isolated from M. marburgensis by established methods ( Shima and Thauer, 2001 ). Cryo-electron microscopy 3 µl of a 0.7 mg/ml Frh sample was applied to freshly glow discharged Quantifoil R1/4 grids (Quantifoil Micro Tools, Jena, Germany) that had been pretreated for 15 s in chloroform. The |grids were blotted in an FEI Vitrobot using a 2.5 s blotting time at 70% humidity and 10°C and plunge-frozen in liquid ethane. For collection of data of Frh in the presence of substrate, 0.5, 1.0, or 10 mM F 420 was added to the sample under oxygen-free conditions just prior to grid preparation. Images were collected at liquid nitrogen temperature on an FEI Tecnai Polara operated at 200 kV. Before images were recorded, the microscope was carefully aligned in an iterative process to correct for objective astigmatism and beam tilt by coma-free alignment ( Glaeser et al., 2011 ). The corrections were carried out at a dose of 15 e − /Å 2 and at half the defocus value used for collecting the images, and were repeated for each grid square from which images were collected. The alignments were done with a Gatan 4k × 4k CCD using unbinned images. Images were recorded on Kodak SO-163 film at a magnification of 59,000× with a dose of 10–15 e − /Å 2 at a defocus of 1.5–2.8 µm. The film was developed for 12 min in full-strength Kodak D-19 developer and fixed for 8 min in Kodak Rapid Fix. Five hundred and six negatives were collected of substrate-free Frh and 512 of Frh with F 420 . Films that showed obvious flaws (too thin ice with particles just around the edge of the Quantifoil hole, too high particle concentration, broken ice, obvious drift) were discarded. Four hundred and two negatives of substrate-free Frh were scanned and 277 of F 420 with Frh. The latter preparation had a higher protein concentration, resulting in many films with too many overlapping particles. This was more than compensated by the higher number of particles per film.
Image processing
Films were digitized on a Zeiss Photoscan scanner with a pixel size of 7 µm, corresponding to 1.14 Å on the specimen as calibrated with fatty acid synthase ( Gipson et al., 2010 ). Particle selection was done semiautomatically with the Boxer module from EMAN ( Ludtke et al., 1999 ) and data processing with EMAN2 ( Tang et al., 2007 ). The contrast transfer function (CTF) of the selected particles from each film was determined with EMAN2 and images that showed visible Thon rings in the power spectrum to high resolution and no indication of drift or astigmatism were selected for further processing and their CTF was corrected by phase flipping. A tetrahedral starting model was created by the EMAN2 program e2initialmodel from a number of class averages. This model was iteratively refined using the main EMAN2 program e2refine, which determines the 3D orientation of each particle by comparison to a set of projections of the current 3D reference map. Particles in the same orientation are aligned and averaged, and a new 3D map is constructed from the averages that are then reprojected to create references for the next refinement cycle ( Ludtke et al., 1999 ; Tang et al., 2007 ). Tetrahedral ( T ) symmetry was applied throughout. In the initial refinement steps, the data were binned to a pixel size of 2.28 Å. After the resolution reached ∼10 Å, the unbinned data were used. At every refinement step, the 30% worst members of each class were discarded. Because of the high symmetry and globular shape of the particle, all class averages had similar quality (see Figure 1B ) and were used for each reconstruction. The final data set of substrate-free Frh contained 84,000 particles from 101 negatives of the 402 scanned negatives. Between iterations, the projection angle was varied. In the last refinement step an angle of 0.9° between consecutive reference reprojections was used, yielding 2134 reference images. The F 420 data were refined with a high-resolution map of substrate-free Frh as a starting reference map. Ninety seven thousand particles were selected from 80 negatives. Smaller datasets of Frh with 0.5, 1.0, and 10 mM F 420 were used initially, but no significant differences were seen and the datasets were merged. The resolution of the maps was estimated using the command eotest in EMAN2, which calculates the Fourier shell correlation (FSC) between reconstructions made by half-data sets from the odd and even numbered particles. This indicated 3.9 and 4.0 Å for the maps without and with F 420 , respectively, using the 0.5 FSC criterion ( Figure 10A ). The resolution estimate can be inflated by the overfitting of noise at high resolution ( Grigorieff, 2000 ; Scheres and Chen, 2012 ). To test for this effect, we used the procedure e2refine-evenodd in EMAN2, where the phase of the starting model are randomized from a cutoff resolution lower than the expected resolution of the map, and then two half-data sets are refined to convergence against this model. High-resolution noise will be uncorrelated between the two maps. Subsequently, the FSC between the two resulting maps is calculated, and the resolution from these two independent half-data sets determined at 0.143 FSC ( Rosenthal and Henderson, 2003 ). This procedure yielded a resolution of 5.5 Å ( Figure 10B ). B-factors of the reconstructions were estimated with the program embfactor ( Rosenthal and Henderson, 2003 ; Fernández et al., 2008 ) in the resolution range 10–4.5 Å as 54 Å 2 for the substrate-free map and 60 Å 2 for the map with F 420 (see Figure 10D ). Model building Maps were visualized in Chimera ( Pettersen et al., 2004 ). Homologous protein structures were fitted manually in the map followed by a rigid body fit (pdb 2wpn, Marques et al., 2010 , for FrhA and the C-terminal domain of FrhG; pdb 1dur for the ferredoxin domain of FrhG). Models were then mutated to the correct amino acid and manually rebuilt in Coot ( Emsley and Cowtan, 2004 ). Regions for which no homolog was available, including all of FrhB, was built ab initio in Coot, based on secondary structure predictions done using the PSIPRED server ( Bryson et al., 2005 ). The conserved cysteines serving as ligands for the Fe-S clusters and the visibility of the Fe-S clusters in the map gave clear initial hints to the identity of secondary structure elements. Helices were built using the command Place helix . Loops and β-sheets were built by first placing C α atoms using the Baton build module. Full-atom models were built based on the visibility of side chains, which led in all cases to an unambiguous assignment. The models were refined using the Regularize Zone module. Where possible, side chains were fitted to available density (overall about 55% of side chains were visible, including most aromatic residues and arginines). During refinement, torsion angle, planar peptide, and Ramachandran restraints were used in order not to create a well-fitting but unrealistic model. The final model contains 878 residues out of a possible 903, a [NiFe] cluster, 4 [4Fe4S] clusters, an FAD and part of an F 420 molecule; 88.1% of residues lie in the most favored regions of a Ramachandran plot, 8.0% in generously allowed regions, and 3.8% are outliers. A full dodecamer model was generated in Chimera ( Pettersen et al., 2004 ) and a map was calculated from this model. An FSC curve between this map and the experimental map indicated an overall agreement of 5.8 Å at 0.5 FSC ( Figure 10C ). Figures were made using Chimera ( Pettersen et al., 2004 ) and the PyMOL Molecular Graphics System ( DeLano, 2002 ).
Additional files Major datasets
The following datasets were generated: Mills DJ , Vitt S , Strauss M , Shima S , Vonck J , 2013 , F420-reducing [NiFe] hydrogenase Frh , EMD-2096 ; http://www.ebi.ac.uk/pdbe-srv/emsearch/atlas/2096_summary.html , Publicly available at the Electron Microscopy Data Bank ( http://www.ebi.ac.uk/pdbe/emdb/ ). Mills DJ , Vitt S , Strauss M , Shima S , Vonck J , 2013 , F420-reducing [NiFe] hydrogenase Frh with bound substrate , EMD-2097 ; http://www.ebi.ac.uk/pdbe-srv/emsearch/atlas/2097_summary.html , Publicly available at the Electron Microscopy Data Bank ( http://www.ebi.ac.uk/pdbe/emdb/ ). Mills DJ , Vitt S , Strauss M , Shima S , Vonck J , 2013 , Cryo-EM structure of the F420-reducing NiFe-hydrogenase from a methanogenic archaeon with bound substrate , 3zfs ; http://www.rcsb.org/pdb/search/structidSearch.do?structureId=3zfs , Publicly available at the RCSB Protein Data Bank ( http://www.rcsb.org/pdb/ ). The following previously published datasets were used: Liesegang H , Kaster A-K , Wiezer A , Goenrich M , Wollherr A , Seedorf H , Gottschalk G , Thauer RK , 2010 , Complete Genome Sequence of Methanothermobacter marburgensis, a Methanoarchaeon Model Organism , CP001710 ; http://www.ncbi.nlm.nih.gov/nuccore/CP001710 , Publicly available at GenBank. Adman ET , Sieker LC , 2000 , The 2[4Fe-4S] Ferredoxins , 1dur ; http://www.rcsb.org/pdb/explore/explore.do?structureId=1dur , Publicly available at the RCSB Protein Data Bank ( http://www.rcsb.org/pdb/ ). Marques MC , Coelho R , De Lacey AL , Pereira IAC , Matias PM , 2010 , The three-dimensional structure of [NiFeSe] hydrogenase from Desulfovibrio vulgaris Hildenborough: a hydrogenase without a bridging ligand in the active site in its oxidised, “as-isolated” state. , 2wpn ; http://www.rcsb.org/pdb/explore/explore.do?structureId=2wpn , Publicly available at the RCSB Protein Data Bank ( http://www.rcsb.org/pdb/ ).
📊 Figures
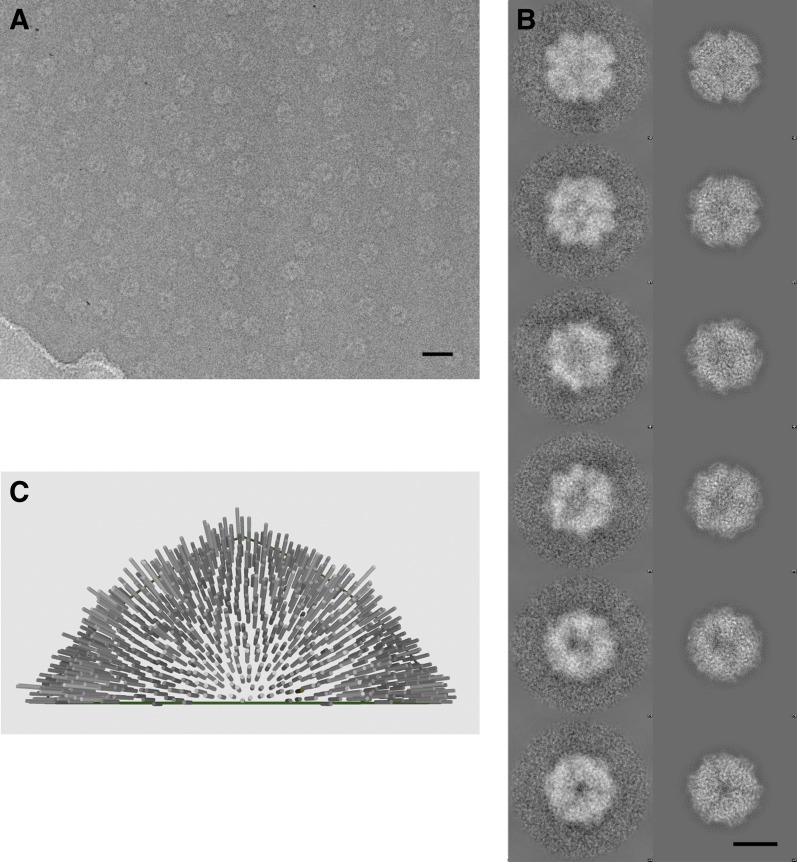
Figure 1.
Cryo-electron microscopy and image processing.
( A ) A representative area of an electron micrograph taken at 200 kV on an FEI Polara. The defocus was determined as 2.05 u00b5m. The scale bar represents 25 nm. ( B ) Representative class averages a...
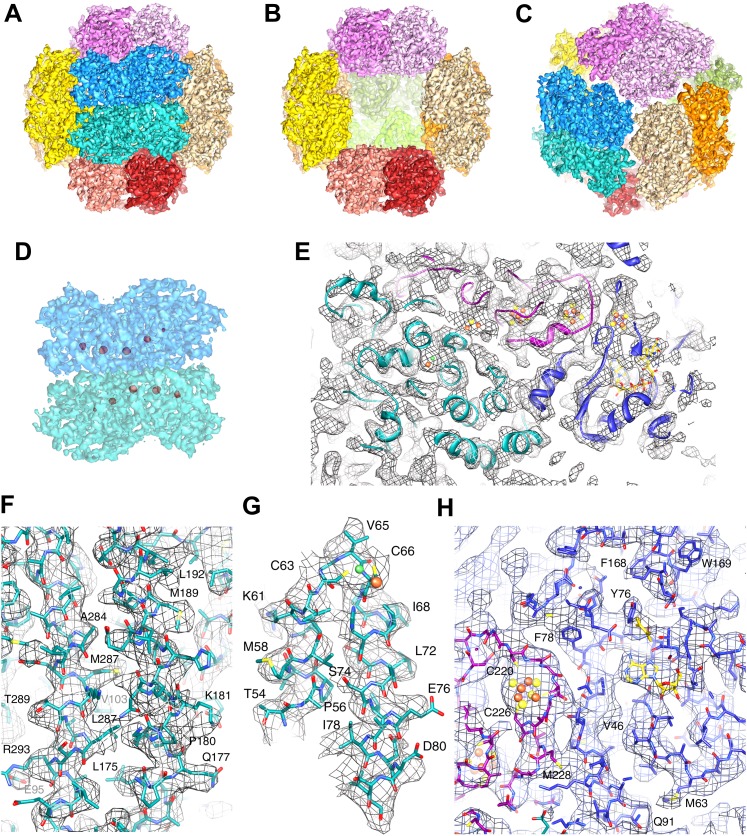
Figure 2.
High-resolution cryo-EM map of Frh.
( A ) view down the twofold axis. Each of the 12 FrhABG heterotrimers is shown in a different color. ( B ) The same view as ( A ) with the two trimers at the front removed, ( C ) view down the threefo...
Video 1.
The Frh map at different density levels.
The Frh map contains high densities corresponding to the metal clusters. The map, filtered to 5.5 u00c5 for clarity, is shown at increasing isosurface levels. At density level 1 (gray), the whole comp...
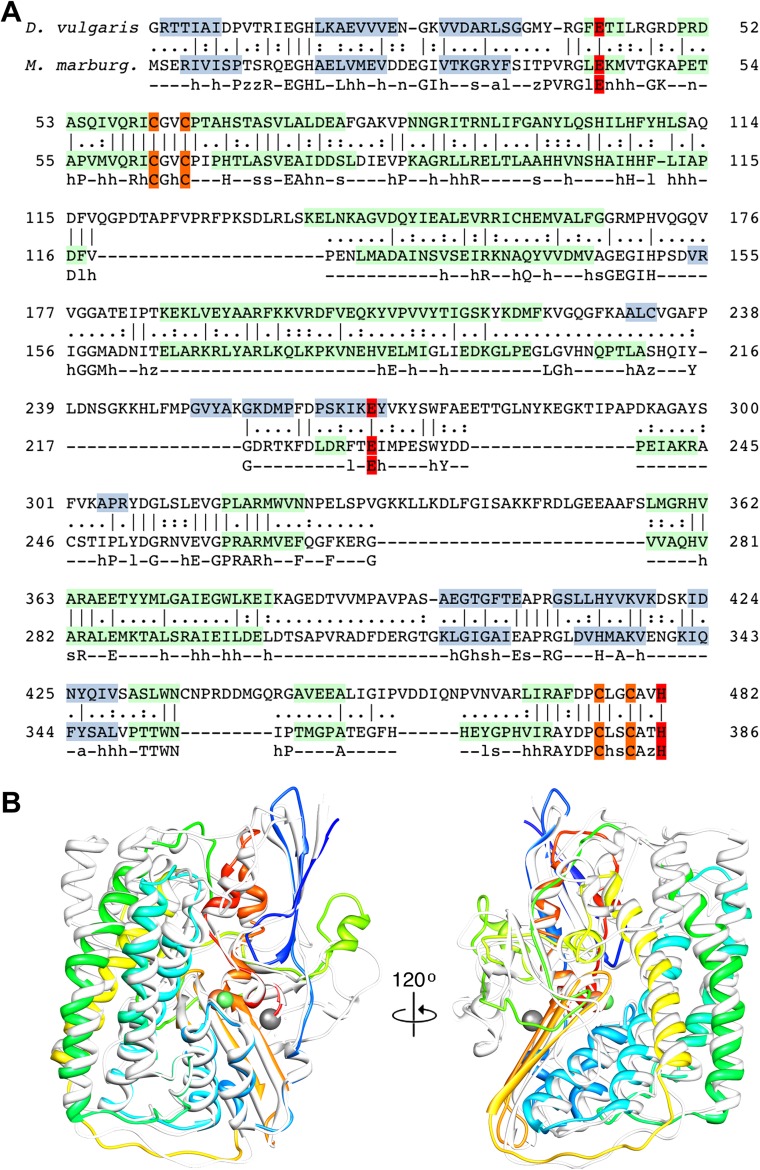
Figure 3.
Sequence and secondary structure of FrhA and a comparison with homologous proteins.
( A ) Alignment of the [NiFe]-hydrogenase large subunit from Desulfovibrio vulgaris Hildenborough (first line) with Methanothermobacter marburgensis FrhA (third line). The second line shows the identi...
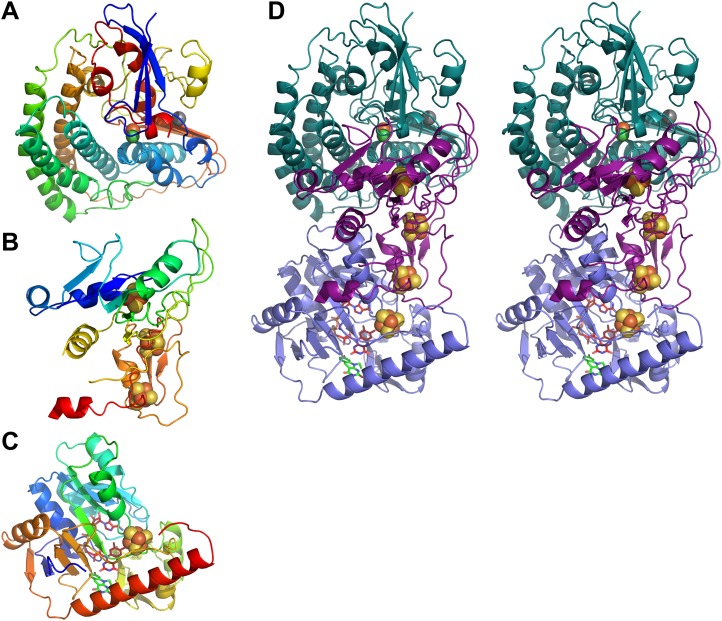
Figure 4.
Models of Frh subunits.
( A ) FrhA, ( B ) FrhG, and ( C ) FrhB in rainbow colors from blue (N-terminus) to red (C-terminus). ( D ) Stereo pair of the FrhABG heterotrimer with the string of four bound Fe-S clusters (orange/ye...
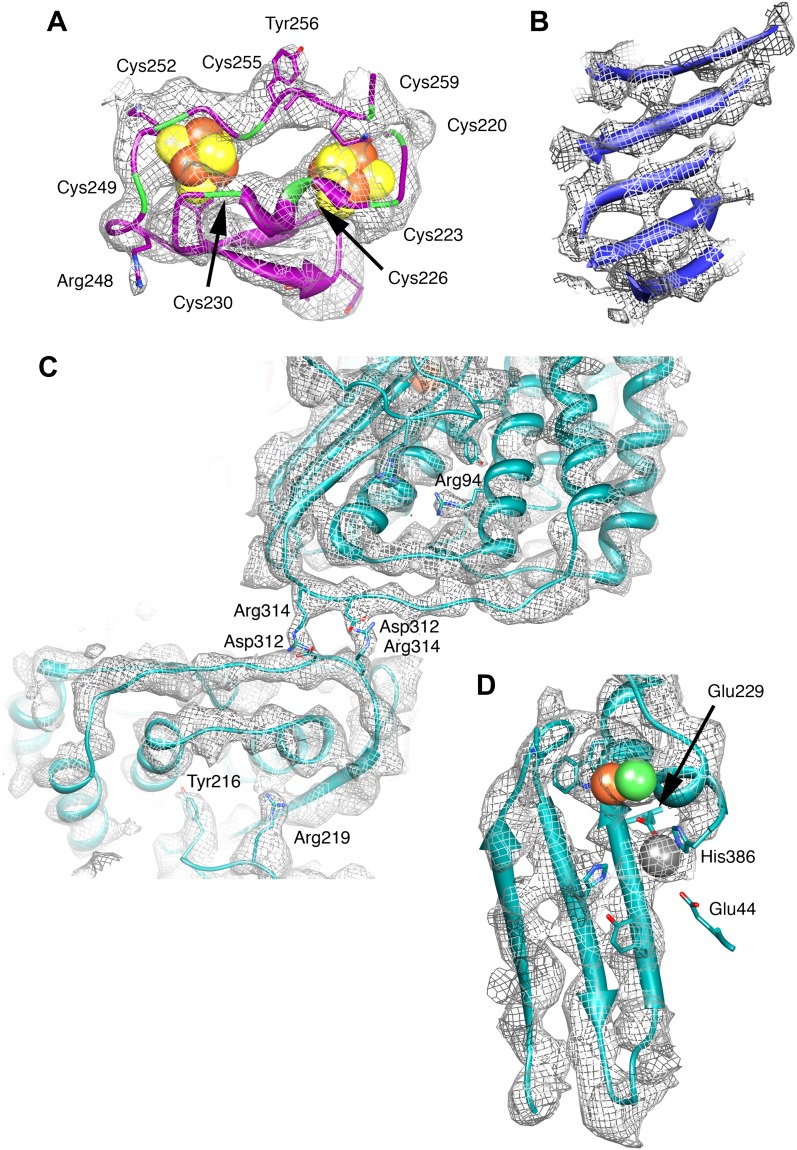
Figure 5.
Details of the model and map.
( A ) The ferredoxin domain of FrhG. The eight cysteine residues surrounding the two [Fe4S4] clusters are shown in green. ( B ) u03b2-Sheet in FrhB. The strands are clearly separated. ( C ) The dimer ...
Video 2.
FrhA.
The model of FrhA is shown superimposed on the map. DOI: http://dx.doi.org/10.7554/eLife.00218.009
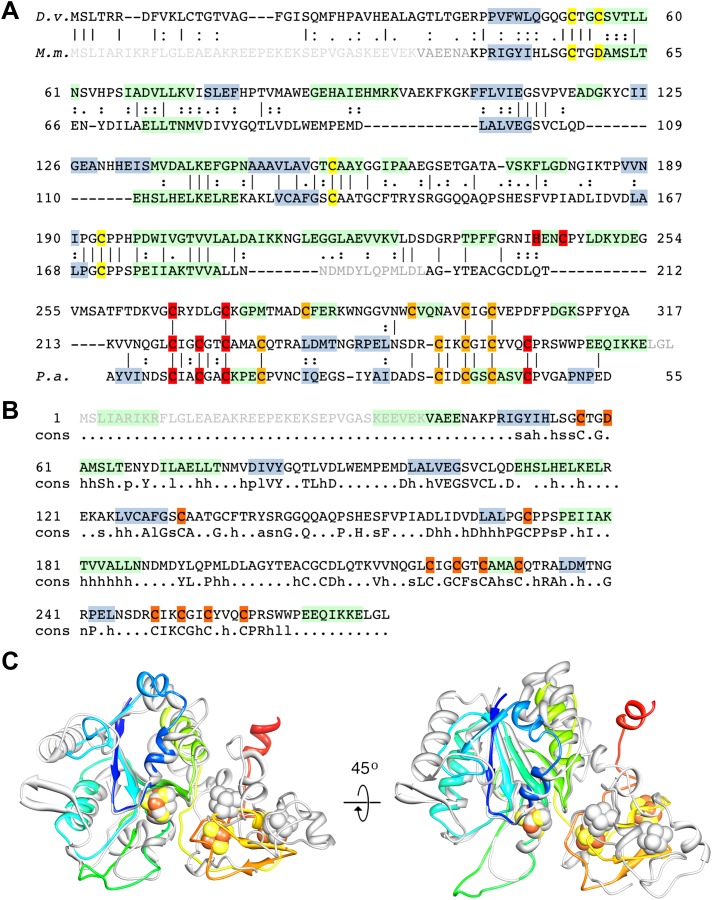
Figure 6.
Sequence and secondary structure of FrhG and a comparison with homologous proteins.
( A ) Alignment of the [NiFe]-hydrogenase small subunit from Desulfovibrio vulgaris Hildenborough (first line) with Methanothermobacter marburgensis FrhG (third line) and ferredoxin from Peptostreptoc...
Video 3.
FrhG.
The model of FrhG is shown superimposed on the map. DOI: http://dx.doi.org/10.7554/eLife.00218.011
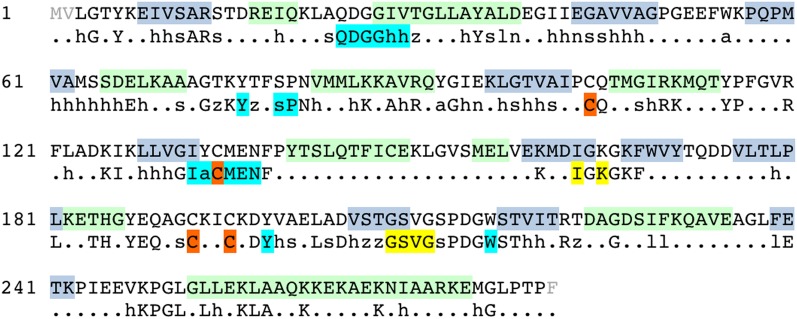
Figure 7.
Sequence and secondary structure of FrhB.
Light gray font: No density; green highlight: u03b1-helix; gray highlight: u03b2-strand. Second line: Consensus sequence of FrhB species. Capitals: conserved residues; lower case: similar residues (h:...
Video 4.
FrhB.
The model of FrhB is shown superimposed on the map. DOI: http://dx.doi.org/10.7554/eLife.00218.013
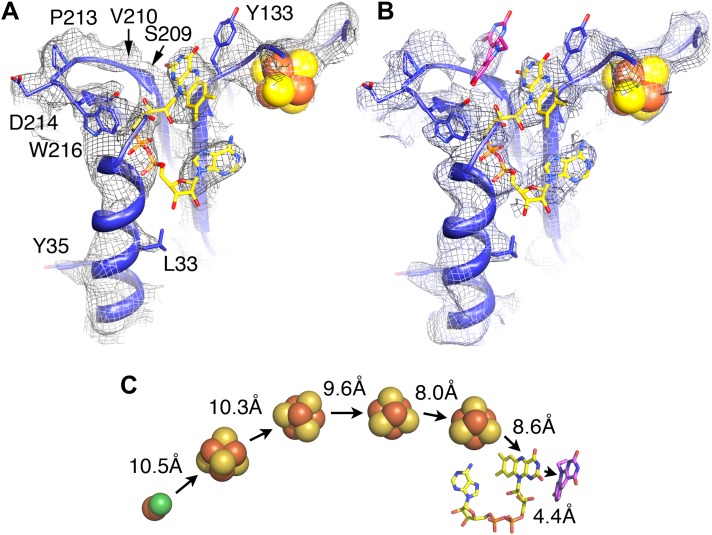
Figure 8.
Electron-transfer chain and F 420 .
Maps in the absence ( A ) and presence ( B ) of the substrate F 420 differ in a region near a conserved loop between two u03b2-strands near the FAD (carbons in yellow). The isoalloxazine ring of F 420...
Video 5.
Conserved residues in FrhB.
The FrhB model is shown with conserved residues in red, similar residues in orange and unconserved residues in gray (see Figure 7 for sequence). FAD is yellow and F 420 green. Highly conserved regions...
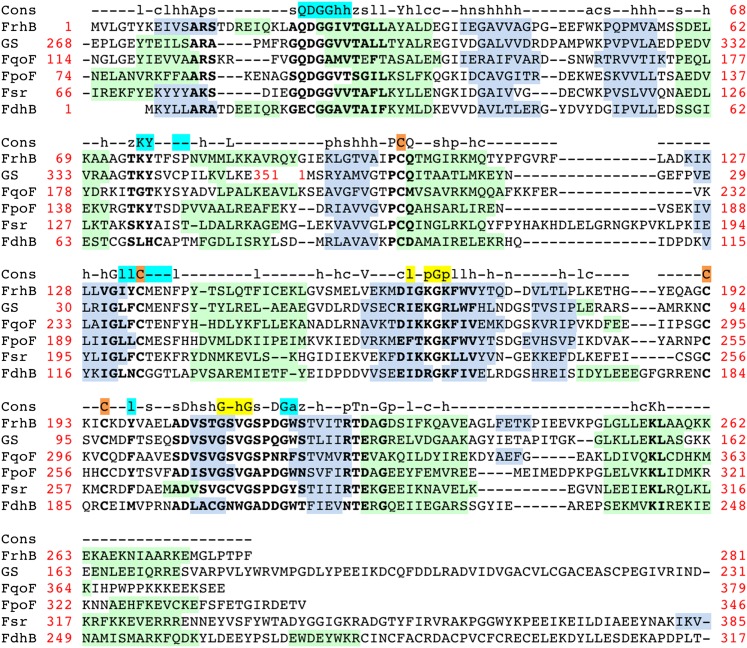
Figure 9.
Alignment of the FrhB family of F 420 -binding proteins.
FrhB: FrhB of Methanothermobacter marburgensis DSM 2133; GS: F 420 -dependent glutamate synthase from M. marburgensis , ADL58239 ; FqoF: F 420 H 2 :quinone oxidoreductase subunit F from Archaeoglobus ...
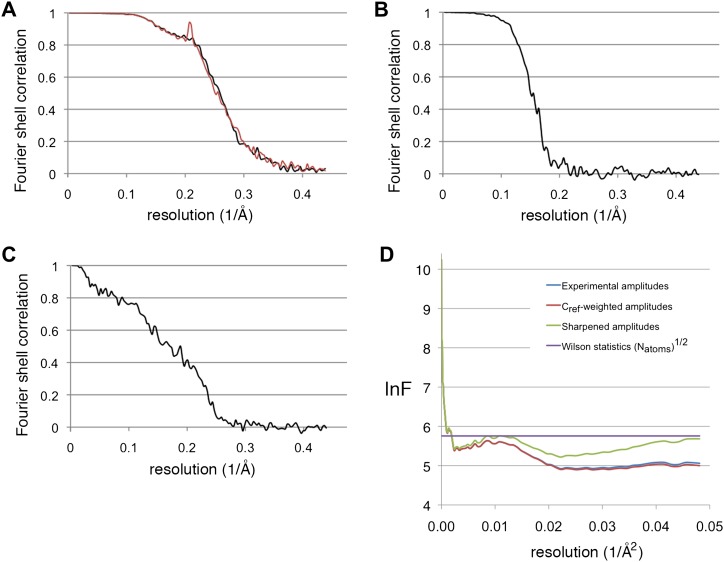
Figure 10.
Resolution estimations and B-factor determination.
( A ) Fourier shell correlation plot, showing the resolution for the substrate-free map (black) and the F 420 -containing map (red). At the 0.5 FSC criterion, the resolution is 3.9 and 4.0 u00c5, resp...
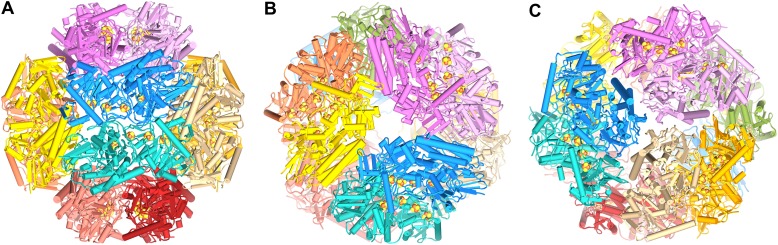
Figure 11.
Model of the dodecameric Frh complex.
Each FrhABG heterotrimer is colored differently with the same color scheme as the map in Figure 1 . ( A ) View down the twofold axis, ( B ) view of the FrhB trimer, and ( C ) view of the closely packe...
Video 6.
The Frh dodecamer.
A model of the tetrameric Frh complex. DOI: http://dx.doi.org/10.7554/eLife.00218.019
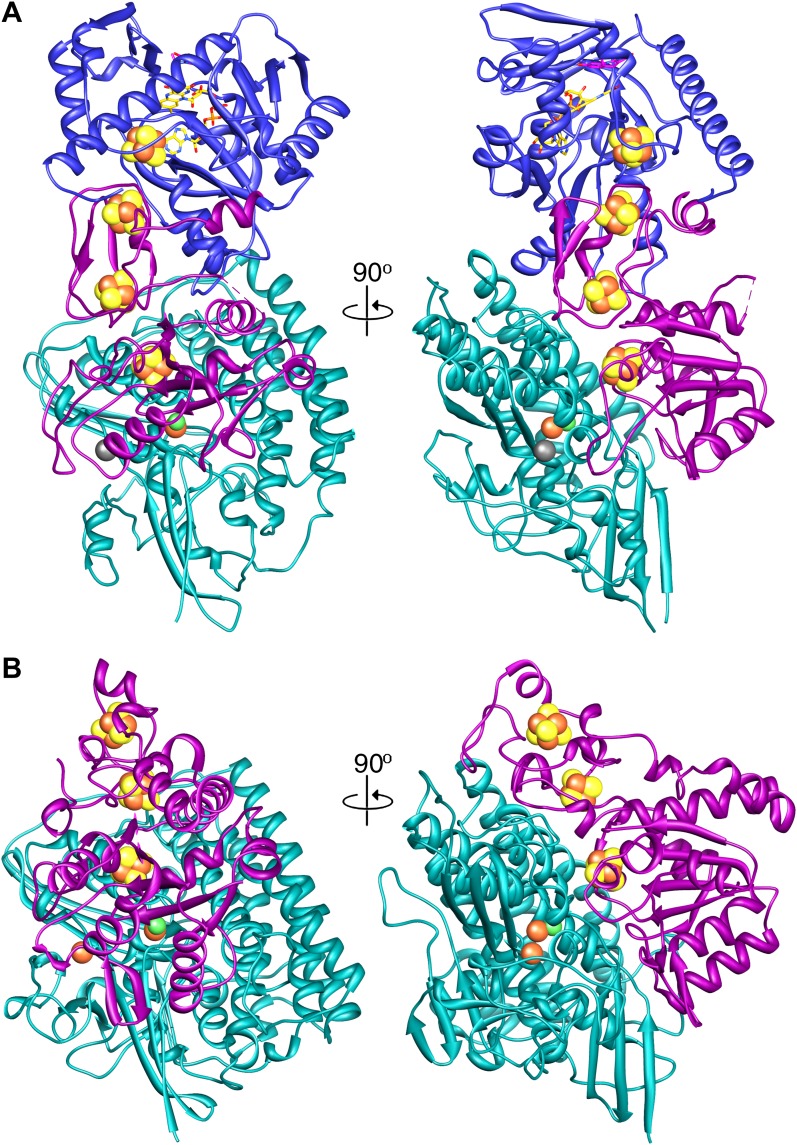
Figure 12.
A comparison of (A) Frh and (B) the group I [NiFe] hydrogenase from Desulfovibrio gigas (2wpn) ( Marques et al., 2010 ) shows a lower intersubunit contact area in the former. The large subunit/FrhA is...
Figure images are served from the NIH/NLM PubMed Central Open Access Subset or Europe PMC; copyright remains with the publishers and authors.
💬 Discussion
0 commentsNo comments yet. Be the first to start a discussion!
Leave a Comment