Abstract
Behaviors emerge from activity throughout the brain, but noninvasive optical access in adult vertebrate brains is limited. We show that three-photon (3P) imaging through the head of intact adult zebrafish allows structural and functional imaging at cellular resolution throughout the telencephalon and deep into the cerebellum and optic tectum. With 3P imaging, considerable portions of the brain become noninvasively accessible from embryo to sexually mature adult in a vertebrate model.
🔬 Techniques
💻 Software
✨ Fluorophores
🧪 Sample Preparation
🏭 Microscope Brands
🧪 Reagent Suppliers
📷 Detectors
🎨 Filters
💻 Software Details
🏛️ Research Organizations (ROR)
Affiliated research institutions:
📋 Methods
Animal Preparation
Adult zebrafish between 3 to 7 months post-fertilization (Casper, Tg(elavl3::H2B-GCaMP6s) 6 ; Tg(vglut2a:loxP-DsRed-loxP-GFP) 16 ; Tg(vglut2a:EGFP) 17 ; Tg(vglut2a: mtdtomato) were used. Fish have indeterminate growth with the rate varying with parameters such as feeding and fish density, so adults can vary widely in size. We primarily chose small to medium-sized adults to facilitate the percentage of brain structure accessible with deep imaging (mean size in our experiments = 20 mm standard length (tip of head to base of tail), 14.1–24.2 mm range). Animals were anesthetized in 0.2 mg/mL tricaine solution (pH 7.2) and then injected with 2 μL of pancuronium bromide (0.4 μg/μL in Hanks). The fish were stabilized by placing them in a “V” shaped groove cut in agar and held in place by a Kimwipe draped over the fish caudal to the head and glued onto the agar surface. A drop of bupivacaine was place on the surface of the head for anaesthetic. Fish were perfused through the mouth and over the gills at a rate of 2 mL/min with an ESI MP2 Peristaltic Pump (Elemental Scientific) with well-oxygenated temperature-controlled fish system water (4 L reservoir heated with a Finnex 800W heater controlled via a Heater Controller set to 80F). Adult Danionella dracula were anesthetized in 0.03% benzocaine solution and their vasculature labeled via injection of a 10% solution of dextran fluorescein (10000 MW, Invitrogen) into blood vessels in a highly vascularized region caudal to the operculum and rostral to the heart. Fish were stabilized by positioning them on a cured Sylgard 184 Silicone Elastomer (Dow Consumer Solutions)-containing dish and kept upright with stainless steel supports embedded in the cured Sylgard. Fish were perfused through the mouth and over the gills at a rate of 1 mL/min with an ESI MP2 Peristaltic Pump (Elemental Scientific) with well-oxygenated temperature-controlled fish system water (4 L reservoir heated with a Top Fin Betta Aquarium Heater set to 77F (25C). All procedures were in accord with the U.S. National Institutes of Health guidelines for animal use in experiments, and were approved by Cornell University’s Institutional Animal Care and Use Committee. Computerized Tomography (CT) Scanning of Zebrafish and Danionella Adult zebrafish were sacrificed in tricaine solution. Whole fish were fixed in 4% paraformaldehye at 4° C for 48 hours. They were then transferred to a solution containing 0.1% iodine metal (I2) and 0.2% potassium iodide (KI) in water until imaging 4 days later. Zebrafish were scanned on a Zeiss Versa 520 CT scanner at 80 kV/7W. The instrument was set to yield a 4.9 μm resolution using a 4x objective. The CT image was reconstructed from 2001 x-ray fluoroscopy images with an exposure time of 3 s each, using the standard Zeiss reconstruction software. Skull thickness above telencephalon, optic tectum, and cerebellum was measured on the CT by averaging three dorsal locations above each brain region. Adult Danionella were sacrificed in benzocaine solution. Whole fish were fixed in 4% paraformaldehyde at 4° C for 24 hours and then stained with 1% iodine metal and 2% potassium iodide. The stained fish was scanned at 120 kV/10W on the Zeiss Versa 520, using the 4x objective and a resolution of 2.7 μm. The machine took 2401 exposures of 0.7 seconds each, and the CT data was reconstructed using the standard Zeiss reconstruction software. 3P system The 3P imaging was done with a previously published custom-built system. 12 , 13 . A schematic description of the system is shown in Supplementary Fig. 7. Experimental setup at 1300 nm Excitation Source The excitation source for 3PM at 1300 nm was a noncollinear optical parametric amplifier (NOPA, Spectra Physics) pumped by a regenerative amplifier (Spirit, Spectra Physics). The NOPA provided an average power of ~500 mW (1,250 nJ per pulse at 400 kHz repetition rate). A half-wave plate (HWP) and a polarization beamsplitter cube (PBS) were used for power control. Pulse compression A two-prism (SF11 glass) compressor was used to compensate for the normal dispersion of the optics of the light source and the microscope, including the objective. The pulse duration (measured by second-order interferometric autocorrelation) under the objective was ~60 fs after optimizing the prism compressor (Supp. Fig. 7).
Show full methods section
Animal Preparation
Adult zebrafish between 3 to 7 months post-fertilization (Casper, Tg(elavl3::H2B-GCaMP6s) 6 ; Tg(vglut2a:loxP-DsRed-loxP-GFP) 16 ; Tg(vglut2a:EGFP) 17 ; Tg(vglut2a: mtdtomato) were used. Fish have indeterminate growth with the rate varying with parameters such as feeding and fish density, so adults can vary widely in size. We primarily chose small to medium-sized adults to facilitate the percentage of brain structure accessible with deep imaging (mean size in our experiments = 20 mm standard length (tip of head to base of tail), 14.1–24.2 mm range). Animals were anesthetized in 0.2 mg/mL tricaine solution (pH 7.2) and then injected with 2 μL of pancuronium bromide (0.4 μg/μL in Hanks). The fish were stabilized by placing them in a “V” shaped groove cut in agar and held in place by a Kimwipe draped over the fish caudal to the head and glued onto the agar surface. A drop of bupivacaine was place on the surface of the head for anaesthetic. Fish were perfused through the mouth and over the gills at a rate of 2 mL/min with an ESI MP2 Peristaltic Pump (Elemental Scientific) with well-oxygenated temperature-controlled fish system water (4 L reservoir heated with a Finnex 800W heater controlled via a Heater Controller set to 80F). Adult Danionella dracula were anesthetized in 0.03% benzocaine solution and their vasculature labeled via injection of a 10% solution of dextran fluorescein (10000 MW, Invitrogen) into blood vessels in a highly vascularized region caudal to the operculum and rostral to the heart. Fish were stabilized by positioning them on a cured Sylgard 184 Silicone Elastomer (Dow Consumer Solutions)-containing dish and kept upright with stainless steel supports embedded in the cured Sylgard. Fish were perfused through the mouth and over the gills at a rate of 1 mL/min with an ESI MP2 Peristaltic Pump (Elemental Scientific) with well-oxygenated temperature-controlled fish system water (4 L reservoir heated with a Top Fin Betta Aquarium Heater set to 77F (25C). All procedures were in accord with the U.S. National Institutes of Health guidelines for animal use in experiments, and were approved by Cornell University’s Institutional Animal Care and Use Committee. Computerized Tomography (CT) Scanning of Zebrafish and Danionella Adult zebrafish were sacrificed in tricaine solution. Whole fish were fixed in 4% paraformaldehye at 4° C for 48 hours. They were then transferred to a solution containing 0.1% iodine metal (I2) and 0.2% potassium iodide (KI) in water until imaging 4 days later. Zebrafish were scanned on a Zeiss Versa 520 CT scanner at 80 kV/7W. The instrument was set to yield a 4.9 μm resolution using a 4x objective. The CT image was reconstructed from 2001 x-ray fluoroscopy images with an exposure time of 3 s each, using the standard Zeiss reconstruction software. Skull thickness above telencephalon, optic tectum, and cerebellum was measured on the CT by averaging three dorsal locations above each brain region. Adult Danionella were sacrificed in benzocaine solution. Whole fish were fixed in 4% paraformaldehyde at 4° C for 24 hours and then stained with 1% iodine metal and 2% potassium iodide. The stained fish was scanned at 120 kV/10W on the Zeiss Versa 520, using the 4x objective and a resolution of 2.7 μm. The machine took 2401 exposures of 0.7 seconds each, and the CT data was reconstructed using the standard Zeiss reconstruction software. 3P system The 3P imaging was done with a previously published custom-built system. 12 , 13 . A schematic description of the system is shown in Supplementary Fig. 7. Experimental setup at 1300 nm Excitation Source The excitation source for 3PM at 1300 nm was a noncollinear optical parametric amplifier (NOPA, Spectra Physics) pumped by a regenerative amplifier (Spirit, Spectra Physics). The NOPA provided an average power of ~500 mW (1,250 nJ per pulse at 400 kHz repetition rate). A half-wave plate (HWP) and a polarization beamsplitter cube (PBS) were used for power control. Pulse compression A two-prism (SF11 glass) compressor was used to compensate for the normal dispersion of the optics of the light source and the microscope, including the objective. The pulse duration (measured by second-order interferometric autocorrelation) under the objective was ~60 fs after optimizing the prism compressor (Supp. Fig. 7).
Imaging setup
Images were taken with a custom-built microscope with a high-numerical aperture objective (Olympus XLPLN25XWMP2, 25X, NA 1.05). The signal was epi-collected through the objective and then reflected by a dichroic beam splitter (FF705-Di01–25 × 36, Semrock) to the detectors. The detection system had two channels: one for the green fluorescence signal emitted by the calcium indicator and the other for third harmonic generation (THG) signal at λ = 433 nm. A 488-nm dichroic beam splitter (Di02-R488–25×36, Semrock) was inserted in the signal path at 45° between the two PMTs to separate the THG and fluorescence. We used a photomultiplier tube (PMT) with GaAsP photocathode (H7422–40) for the fluorescence signal and an ultra bialkali PMT (R7600U–200) for the THG signal. The optical filters for the fluorescence and the THG channels were 520/60 and 420/40 bandpass filters (Semrock), respectively. Experimental setup at 1700 nm Excitation Source The excitation source for 3PM at 1700 nm was an optical parametric amplifier (OPA, Opera-F, Coherent) pumped by an amplifier (Monaco, Coherent). The excitation wavelength was ~ 1,680 nm. The average power of the source was ~330 mW (1,000 nJ per pulse at 333 kHz repetition rate). A half-wave plate (HWP) and a polarization beamsplitter cube (PBS) were used for power control. Pulse compression A 4 mm thick silicon plate was placed in the optical beam path to compensate for the anomalous dispersion of the optical elements of the light source and the microscope, including the objective. In order to maximize transmission, the silicon plate was placed at the Brewster’s angle. The pulse duration (measured by second-order interferometric autocorrelation) under the objective was ~70 fs.
Imaging setup
Images were taken with a custom-built microscope with a high-numerical aperture objective (Olympus XLPLN25XWMP2, 25X, NA 1.05). The signal was epi-collected through the objective and then reflected by a dichroic beam splitter (FF705-Di01–25 × 36, Semrock) to the detectors. The detection system had two channels: one for the red fluorescence signal emitted by DSRed or tdTomato and the other for third harmonic generation (THG) signal at λ = 560 nm. A 573-nm dichroic beam splitter (Di02-R561–25×36, Semrock) was inserted in the signal path at 45° between the two PMTs to separate the THG and fluorescence. We used a photomultiplier tube (PMT) with GaAsP photocathode (H7422–40) for the fluorescence signal and an ultra bialkali PMT (R7600U–200) for the THG signal. The optical filters for the fluorescence and THG channels were 593/40 and 556/25 bandpass filters (Semrock), respectively. For both systems, the fish was placed on a motorized stage (M-285, Sutter Instrument Company). A computer running the ScanImage 3.8 module on MATLAB (MathWorks) software was used to control the stage translation and image acquisition. The PMT current was converted to voltage and amplified using a transimpedance amplifier (c7319, Hamamatsu). Analog-to-digital conversion was performed by a data acquisition card (NI PCI-6115, National Instruments). The field of view ranged from 200 to 650 um. The pixel rate for 3P imaging is limited by the repetition rate of the excitation source, which is lower than that in 2P imaging. The fast, 4.25Hz per frame scanning rate used for functional imaging corresponds to about one laser pulse per pixel. For activity imaging, however, signal from the entire nucleus was integrated to generate the activity trace. Depending on the exact size, a single neuron consists of tens to hundreds of pixels within the field of view. Therefore, the number of excitation pulses per neuron per frame is large, even at the limit of 1 excitation pulse per pixel, enabling a high frame rate at a relatively low repetition rate. For structural imaging, longer pixel dwell time and/or averaging over multiple frames eliminates any impact of the low repetition rate. More details of dwell times, averaging etc. for structural and functional imaging are below. Navigation around the head and brain of the fish Navigation under the 3P imaging conditions initially proved challenging, as surface features under magnification, and using the THG channel, were not intuitive without familiarity. In order to ease navigation to known areas for imaging, we implemented a wider field of view light objective and white light imaging using a camera system to establish a relative coordinate system, defining reference points based on skull sutures and other anatomical features of the head. With experience, we were eventually able to more easily identify regions in single slices based on the THG signal from the surface structures, fiber patterns and the disposition of neurons (see Supp. Figs. 1, 2).
Decay Length Measurements
Decay lengths were quantified by examining signal intensities at different depths by imaging fluorescent dye injected into the bloodstream of wild-type unlabeled Casper fish. Approximately 1 μL of the dye, (20% concentration, 500 kDa MW fluorescein dextran or 70 kDa MW Texas Red dextran in Hanks solution for 1300 nm and 1700 nm excitation, respectively) was injected by hand retro-orbitally on the morning of the experiment. Positively labeled fish were screened by imaging the tail with a fluorescent dissecting microscope (Leica M205 FA) immediately after injection to look for clearly labeled blood vessels. For each region to be measured, stacks were taken at 5 to 10 μm steps starting deepest and moving shallower, and power was adjusted in order to avoid saturation of the PMTs and potential damage to the fish. For analysis, after background subtraction and averaging, regions containing blood vessels were segmented from the image for each slice using a custom Matlab script to extract pixels 2–3 standard deviations above the mean intensity. An average signal intensity was produced for each slice by averaging the segmented pixels. Linear decay curves were fit to log(avg. signal / power^3) and reported as (3/slope) of the fit, which gives the length in microns through which the signal intensity will decay by a factor of 1/e 3 . Alternatively, the top 0.1% of pixels was also identified as over 3.29 standard deviation above background. The results were similar with both approaches. Nonlinear and linear damage thresholds Nonlinear damage was assessed in the telencephalon or optic tectum by imaging at 4.25 Hz (the rate used for our functional data) or 8.5 Hz for 4 minutes at a depth between 200 to 300 μm (including skin and skull) in the telencephalic or optic tectal regions with a repetition rate of 333 kHz in animals expressing GCaMP6s ( Tg(elavl3:H2B-GCaMP6s) ). When power was sufficiently high to start damaging tissue, damage was apparent during live imaging by sustained increase in brightness of GCaMP signals of neurons followed by a development of absence in the signal that appears as a black area with a whiter halo, where the tissue damage was likely most severe ( Supp. video 2 ). Linear damage was assessed by examining the presence or absence of blood flow on the THG channel in living animals near the surface of the optic tectum after sustained exposure for 10 minutes to a beam of systematically varying power focused at a depth of 800 μm below the surface. Animals were considered heat-damaged if blood flow occurred pre-exposure in a region but not post-exposure to deep imaging at the tested intensity. The overall viability of the animal was evident by assessing blood flow outside the exposed area.
Structural Imaging
For structural imaging using both 1300 and 1700 nm excitation, the maximum power was limited to about 90 mW at the deepest depths imaged in order to ensure a lack of damage to the tissue. As this appeared to be well below the damage limit, it is possible that additional power usage could result in good signal-to-noise ratios at even greater depths than reported here. Surface imaging required approximately 3 mW power. As we imaged deeper into the brain, power and the number of averages per slice were increased. Structural images were collected at exposures of 6 microseconds per pixel and frame rates of 0.53 Hz, with averaging of 3–10 images depending on depth. The longest structural imaging, for the entire telencephalon lobe, took over 4 hours, about 3 of which was actual scanning to collect the stacks. For structural reconstructions, image stacks were assembled using a Matlab program autoAssembleStacks.m and Imaris (Bitplane). The program averaged .tif files and placed them according to the z-coordinates present in the header of the ScanImage.tif files. To obtain a concatenated stack from substacks collected at increasing power with depth, each substack was normalized such that the 99th percentile of pixels was at 2^15 (half the range of a 16bit number). Overlaps between stacks were averaged. For more complex multi-column assemblies, such as that of the entire telencephalon on one side of the brain, each averaged substack was normalized to a single shallow slice with many labeled cells. The intensities in the reference slice were converted into the range [0, 2^15] and then the imhist function in Matlab was used to compute a histogram. Histogram equalization of the other substacks was accomplished by using the histeq contrast matching function. The larger assembly was then produced by using image coordinates from the microscope motor and the program XUVstitch. Finally, the normalize layers function in Imaris was used, followed by median smoothing (3×3×1) to produce the final images. Adult female Danionella dracula (3 fish total) with a range in standard length from 15.7–16.7 mm were imaged. We used an injection of fluorescein caudal to the operculum to fill blood vessels in the fish, which we then imaged intact and alive. One to three image stacks ranging in z depth from 400–1000 μm were taken per fish at the midline near caudal midbrain and rostral cerebellum, where the brain is thickest in z. For structural imaging using 1300 nm excitation, maximum imaging power was 13.6 mW at the deepest depths imaged. Surface imaging required at most 3 mW power after the objective. As we imaged deeper into the brain, power was increased. Structural images were collected at exposures of 6 and 13 microseconds(μs) per pixel and frame rates of 0.47 and 0.23 Hz, with averaging of 3–10 images, depending on depth. Figure 1H (right panel) shows an example imaging at 6 us/pixel with a frame rate of 0.47 Hz. Images were assembled and viewed as for zebrafish above. While our imaging was 3P, Danionella dracula are so transparent that even 2P imaging may make much of their brain accessible.
Ca++ Imaging
Ca++ imaging was performed in healthy animals as assessed by blood flow visible on the THG channel. Images were acquired at a 3 μs exposure per pixel and a frame rate of 4.25 Hz, at minimal power needed to visualize the label. As expected with the differences in decay length, the ability to functionally image deep into the zebrafish adult brain varied across the major brain regions. The changes in neuronal calcium could be observed in telencephalon greater than 600 μm (see Fig. 2 , 656 μm). The deepest functional imaging in the optic tectum was at 561 μm , and the deepest calcium imaging in the cerebellum was at 372 μm. The powers used were well below those that led to linear or nonlinear damage in our testing of damage thresholds. Though most functional imaging sessions were about 4–5 minutes long at a given plane, we performed several longer experiments, including one calcium imaging experiment where we imaged continuously for 1 hour at 4.25 Hz. After acquisition of calcium imaging data, a correction was made for small lateral movements of the imaged region and background was subtracted. Cell segmentation was accomplished using Imaris (Bitplane). For each time point, a neuron’s intensity was calculated as the mean of its segmented pixels. Traces were further processed by averaging subsequent frames (halving the frequency to 2.125 Hz), smoothed using a moving average of 5 frames and passed through a low-pass Butterworth filter with cutoff at 0.43 Hz. ΔF/F was calculated by using the median of a 60 s window around each point as the baseline. For photon counts, instrument background was estimated from calcium imaging videos using the presence of shuttered pixels on the first frame of each video (approximately the first two lines). Subsequently, the mean-background-subtracted image intensity per neuron was multiplied by the number of pixels segmented for that neuron and divided by a constant factor 880 which was determined experimentally 12 , 13 as the scaling factor for photon counts of the instrumentation. Finally, flux was computed as a rate (photon counts per second per neuron) by multiplying the counts by the image acquisition frequency (typically 4.25 Hz).
Data Availability
The data that support the findings of this study are available from the corresponding author upon reasonable request.
Code Availability
The software codes used for the analyses are available from the corresponding author upon reasonable request.
Experimental setup at 1300 nm Excitation Source The excitation source for 3PM at 1300 nm was a noncollinear optical parametric amplifier (NOPA, Spectra Physics) pumped by a regenerative amplifier (Spirit, Spectra Physics). The NOPA provided an average power of ~500 mW (1,250 nJ per pulse at 400 kHz repetition rate). A half-wave plate (HWP) and a polarization beamsplitter cube (PBS) were used for power control. Pulse compression A two-prism (SF11 glass) compressor was used to compensate for the normal dispersion of the optics of the light source and the microscope, including the objective. The pulse duration (measured by second-order interferometric autocorrelation) under the objective was ~60 fs after optimizing the prism compressor (Supp. Fig. 7).
Imaging setup
Images were taken with a custom-built microscope with a high-numerical aperture objective (Olympus XLPLN25XWMP2, 25X, NA 1.05). The signal was epi-collected through the objective and then reflected by a dichroic beam splitter (FF705-Di01–25 × 36, Semrock) to the detectors. The detection system had two channels: one for the green fluorescence signal emitted by the calcium indicator and the other for third harmonic generation (THG) signal at λ = 433 nm. A 488-nm dichroic beam splitter (Di02-R488–25×36, Semrock) was inserted in the signal path at 45° between the two PMTs to separate the THG and fluorescence. We used a photomultiplier tube (PMT) with GaAsP photocathode (H7422–40) for the fluorescence signal and an ultra bialkali PMT (R7600U–200) for the THG signal. The optical filters for the fluorescence and the THG channels were 520/60 and 420/40 bandpass filters (Semrock), respectively.
Experimental setup at 1700 nm Excitation Source The excitation source for 3PM at 1700 nm was an optical parametric amplifier (OPA, Opera-F, Coherent) pumped by an amplifier (Monaco, Coherent). The excitation wavelength was ~ 1,680 nm. The average power of the source was ~330 mW (1,000 nJ per pulse at 333 kHz repetition rate). A half-wave plate (HWP) and a polarization beamsplitter cube (PBS) were used for power control. Pulse compression A 4 mm thick silicon plate was placed in the optical beam path to compensate for the anomalous dispersion of the optical elements of the light source and the microscope, including the objective. In order to maximize transmission, the silicon plate was placed at the Brewster’s angle. The pulse duration (measured by second-order interferometric autocorrelation) under the objective was ~70 fs.
Imaging setup
Images were taken with a custom-built microscope with a high-numerical aperture objective (Olympus XLPLN25XWMP2, 25X, NA 1.05). The signal was epi-collected through the objective and then reflected by a dichroic beam splitter (FF705-Di01–25 × 36, Semrock) to the detectors. The detection system had two channels: one for the red fluorescence signal emitted by DSRed or tdTomato and the other for third harmonic generation (THG) signal at λ = 560 nm. A 573-nm dichroic beam splitter (Di02-R561–25×36, Semrock) was inserted in the signal path at 45° between the two PMTs to separate the THG and fluorescence. We used a photomultiplier tube (PMT) with GaAsP photocathode (H7422–40) for the fluorescence signal and an ultra bialkali PMT (R7600U–200) for the THG signal. The optical filters for the fluorescence and THG channels were 593/40 and 556/25 bandpass filters (Semrock), respectively. For both systems, the fish was placed on a motorized stage (M-285, Sutter Instrument Company). A computer running the ScanImage 3.8 module on MATLAB (MathWorks) software was used to control the stage translation and image acquisition. The PMT current was converted to voltage and amplified using a transimpedance amplifier (c7319, Hamamatsu). Analog-to-digital conversion was performed by a data acquisition card (NI PCI-6115, National Instruments). The field of view ranged from 200 to 650 um. The pixel rate for 3P imaging is limited by the repetition rate of the excitation source, which is lower than that in 2P imaging. The fast, 4.25Hz per frame scanning rate used for functional imaging corresponds to about one laser pulse per pixel. For activity imaging, however, signal from the entire nucleus was integrated to generate the activity trace. Depending on the exact size, a single neuron consists of tens to hundreds of pixels within the field of view. Therefore, the number of excitation pulses per neuron per frame is large, even at the limit of 1 excitation pulse per pixel, enabling a high frame rate at a relatively low repetition rate. For structural imaging, longer pixel dwell time and/or averaging over multiple frames eliminates any impact of the low repetition rate. More details of dwell times, averaging etc. for structural and functional imaging are below.
Supplementary Material 1579451_SuppVideo2 Video of nonlinear damage induced by excessive laser intensity 1579451_SuppVideo1 Blood flow imaged with THG at 8.5 Hz 1579451_SuppVideo5 Functional imaging with GCaMP6s 300 μm deep into the optic tectum for approximately 6 minutes in a region with densely packed neurons from the same optical section and data shown in Fig. 2B . 1579451_SuppVideo3 Video from a montage of Z stacks through the depth of telencephalon on one entire side of the brain from superficial to deep 1579451_SuppVideo4 3D video of one half of the telencephalon made from the Z stacks shown in Supp. video 3. SupplementaryTable1
📊 Figures
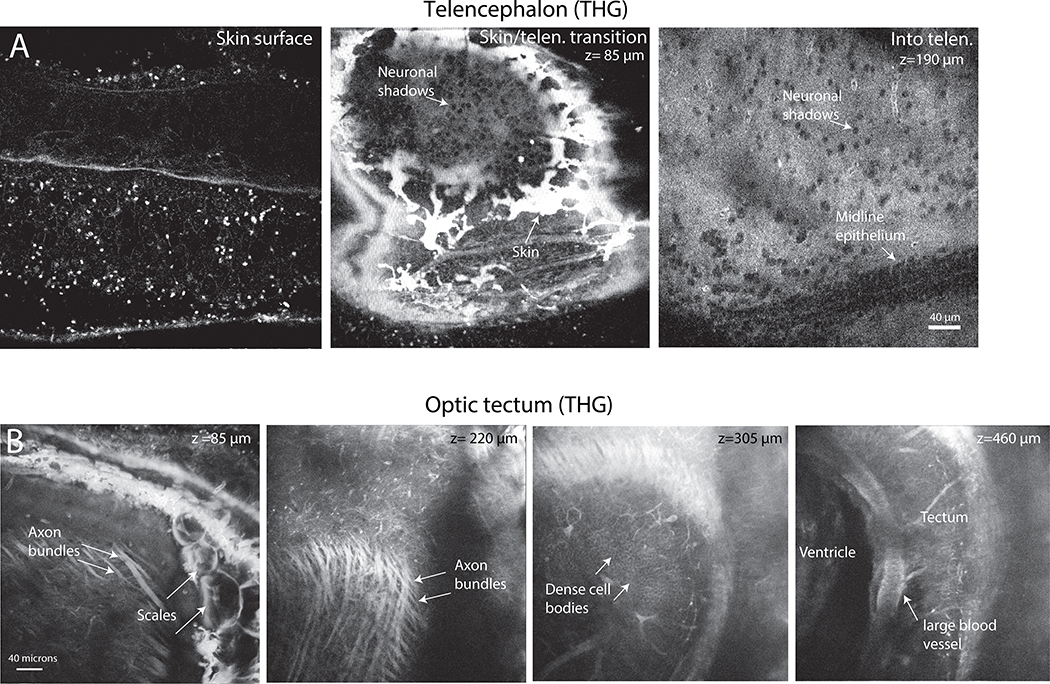
Extended Data Fig. 1
Structural features visible in optical sections with THG that facilitate navigation through the brain.
A. Telencephalic region, showing from left to right: the skin surface features; the transition into the brain as shadows of neurons become visible; and deeper in the telencephalon where the shadows of...
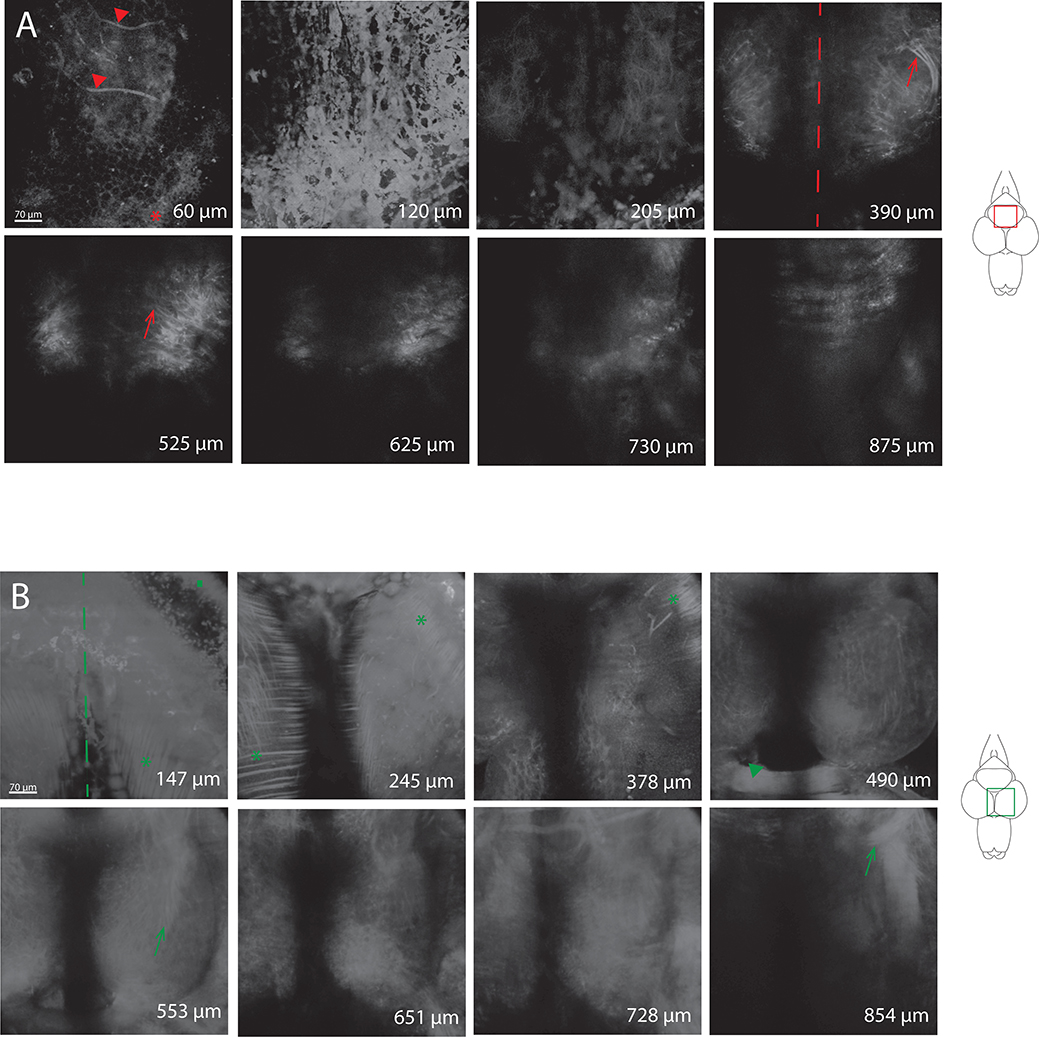
Extended Data Fig. 2
Third harmonic generation images at different depths in the cerebellar and optic tectal areas.
Squares on brain diagrams on the right show approximate areas of imaging, and dashed lines represent approximate brain midlines. A. Cerebellar region from shallow to deep imaging. At 60 u03bcm, some s...
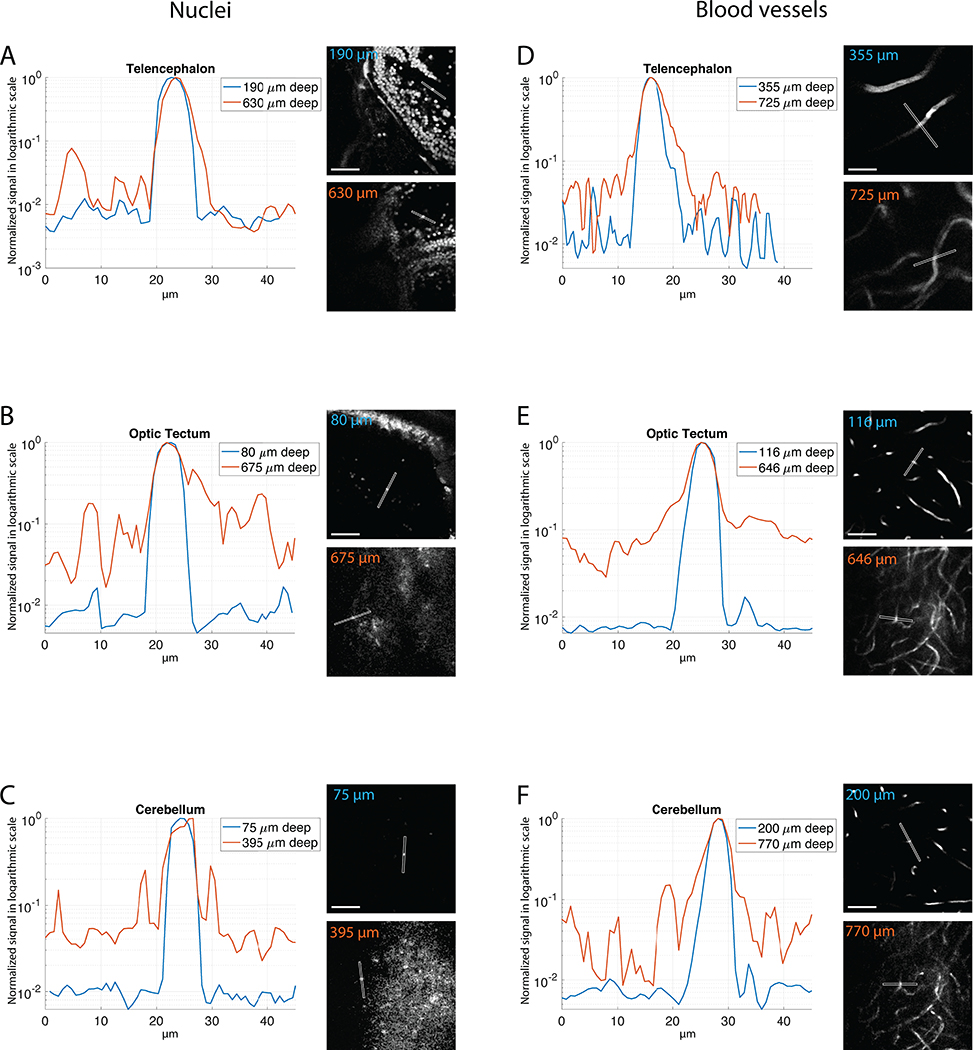
Extended Data Fig. 3
Signal to Background ratio
Signal-to-background ratio (SBR) in shallow and deep regions in three areas of the brain. ( A-C ) Fluorescence intensity profiles along the lines across GCaMP6s-labeled neuronal nuclei (N=1 each). ( D...
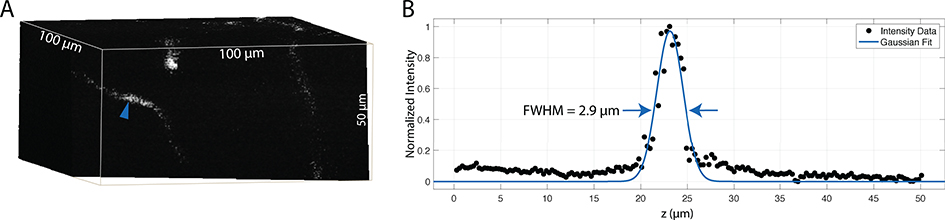
Extended Data Fig. 4
3P Axial resolution measurement
A. 3P image of a small fluorescein-labeled blood vessel (blue arrowhead) imaged about 200 u03bcm deep into the optic tectum. Image stack was taken with 0.3 u03bcm axial steps at 3 u03bcs pixel time (5...
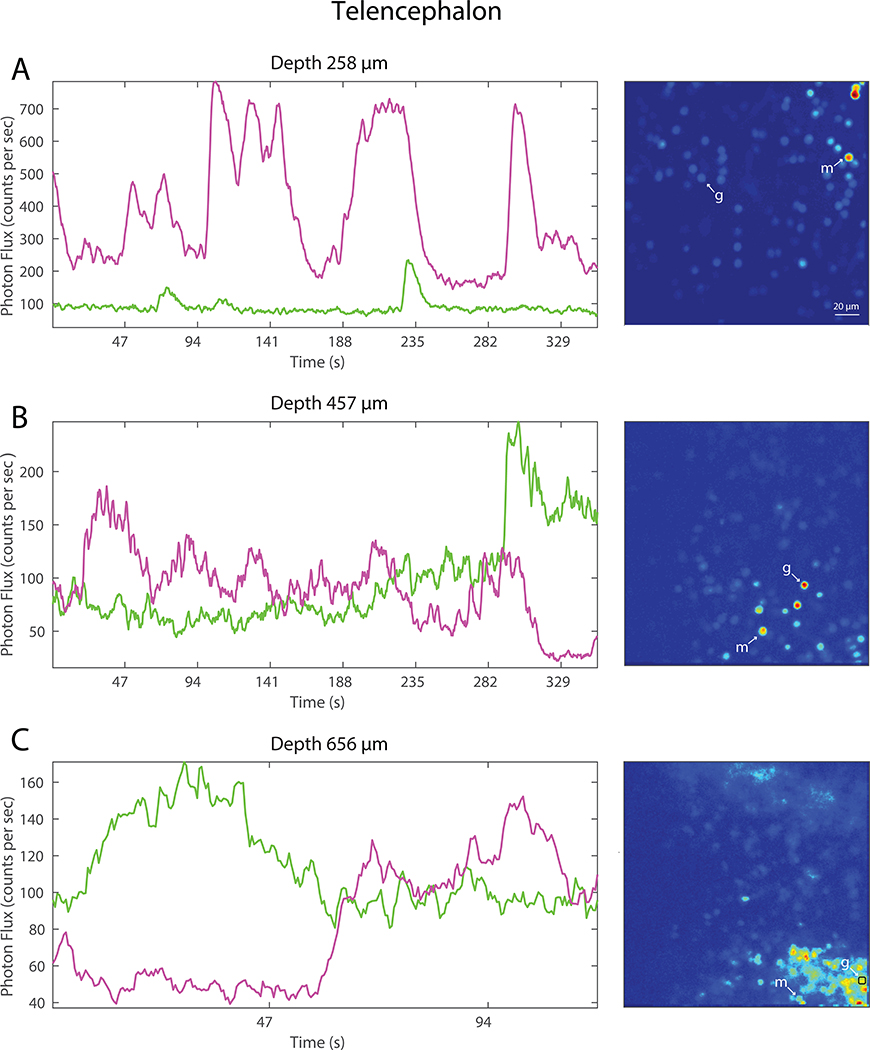
Extended Data Fig. 5
Example photon counts from telencephalic neurons
Rows A-C show neurons at different depths. In each panel, the plots in magenta and green show photon counts from two neurons at that depth, with the monitored neurons marked with m and g in the optica...
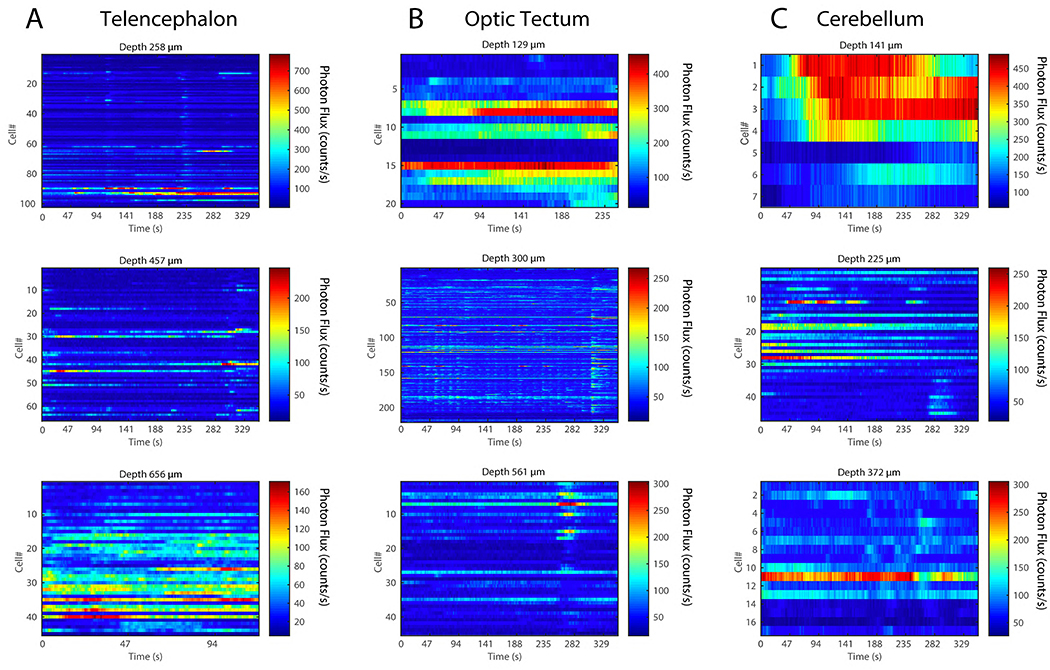
Extended Data Fig. 6
Raster plot of photon counts for all of the neurons shown in main Fig. 2
N eurons were monitored at different depths in: A. telencephalon, B. optic tectum and C . cerebellum. Functional imaging: Tel N = 9, OT N = 6, CB N = 2.
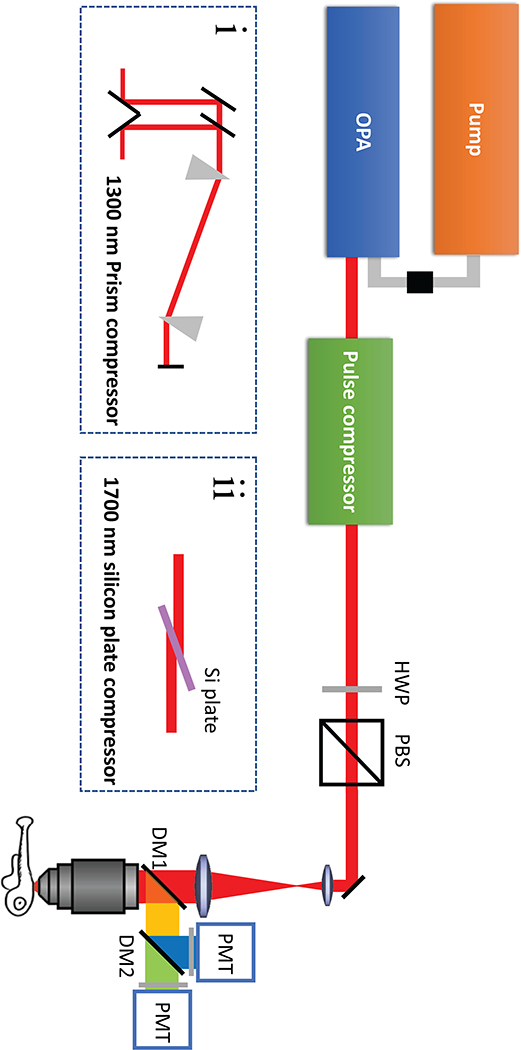
Extended Data Fig. 7
Experimental setup
(a) schematic drawing of the excitation sources and the optical path of the imaging setup. OPA u2013 optical parametric oscillator, HWP u2013 Half wave plate, PBS u2013 Polarizing Beam splitter, DM u2...
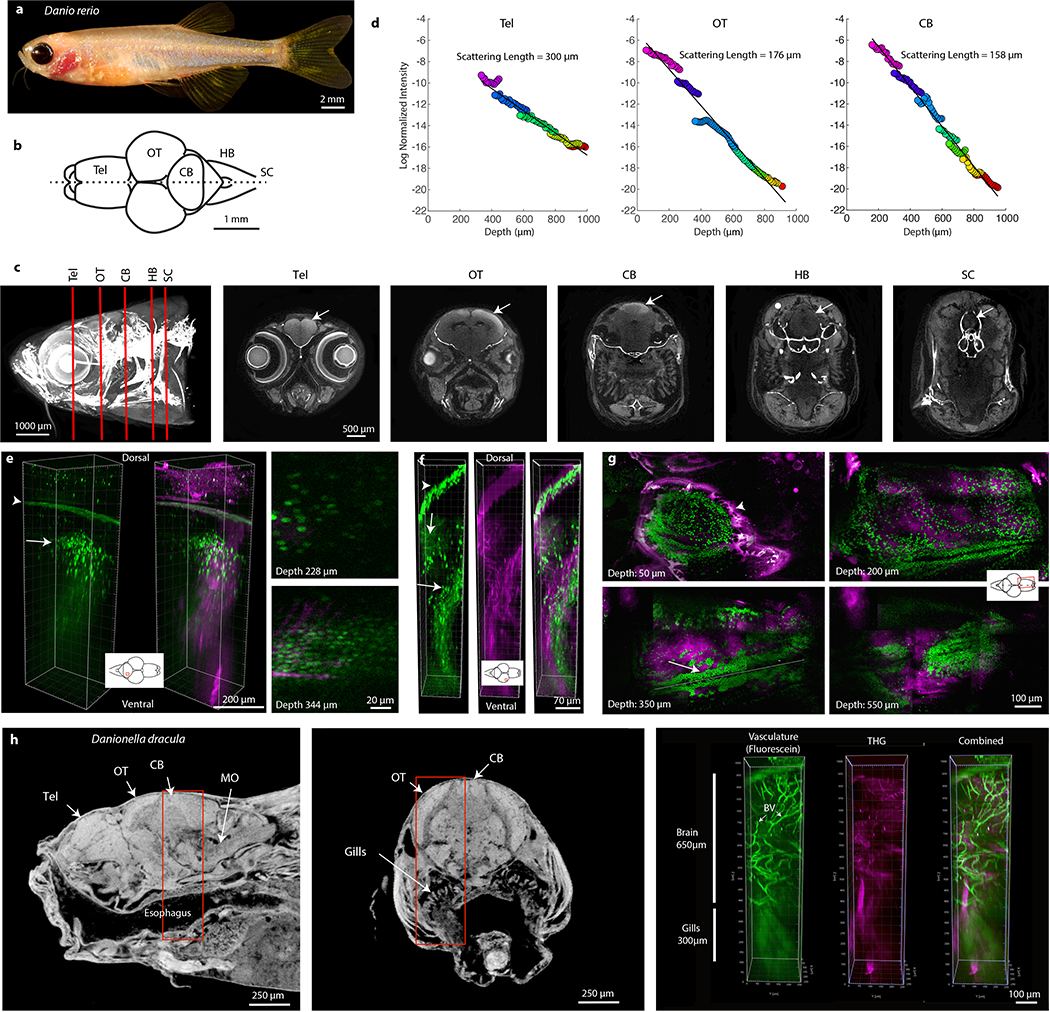
Fig. 1:
Imaging deep into zebrafish and Danionella brains.
a. Adult zebrafish. b. Dorsal view of a zebrafish brain outline. Rostral is to the left. Tel: Telencephalon, OT: Optic tectum, CB: Cerebellum, HB: Hindbrain, SC: Spinal cord. c. CT of a zebrafish head...
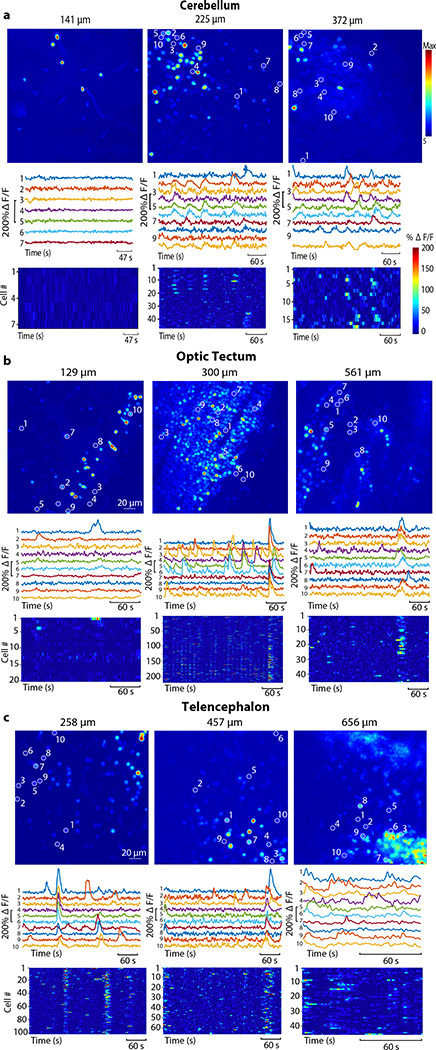
Fig. 2.
Functional imaging of major brain regions in intact adult zebrafish
Panels a-c : functional imaging in the Tg(elavl3:H2B-GCaMP6s) at different depths in cerebellum, optic tectum, and telencephalon. In each panel, the top row shows, from left to right, optical sections...
Figure images are served from the NIH/NLM PubMed Central Open Access Subset or Europe PMC; copyright remains with the publishers and authors.
💬 Discussion
0 commentsNo comments yet. Be the first to start a discussion!
Leave a Comment