Abstract
Understanding of nanoparticle-bio-interactions within living cells requires knowledge about the dynamic behavior of nanomaterials during their cellular uptake, intracellular traffic and mutual reactions with cell organelles. Here, we introduce a protocol of combined kinetic imaging techniques that enables investigation of exemplary fluorochrome-labelled nanoparticles concerning their intracellular fate. By time-lapse confocal microscopy we observe fast, dynamin-dependent uptake of polystyrene and silica nanoparticles via the cell membrane within seconds. Fluorescence recovery after photobleaching (FRAP) experiments reveal fast and complete exchange of the investigated nanoparticles at mitochondria, cytoplasmic vesicles or the nuclear envelope. Nuclear translocation is observed within minutes by free diffusion and active transport. Fluorescence correlation spectroscopy (FCS) and raster image correlation spectroscopy (RICS) indicate diffusion coefficients of polystyrene and silica nanoparticles in the nucleus and the cytoplasm that are consistent with particle motion in living cells based on diffusion. Determination of the apparent hydrodynamic radii by FCS and RICS shows that nanoparticles exert their cytoplasmic and nuclear effects mainly as mobile, monodisperse entities. Thus, a complete toolkit of fluorescence fluctuation microscopy is presented for the investigation of nanomaterial biophysics in subcellular microenvironments that contributes to develop a framework of intracellular nanoparticle delivery routes.
🔬 Techniques
🔭 Microscopes
🧬 Organisms
💻 Software
✨ Fluorophores
🧪 Sample Preparation
🔬 Cell Lines
🏭 Microscope Brands
🧪 Reagent Suppliers
💻 Software Details
🏛️ Research Organizations (ROR)
Affiliated research institutions:
📋 Methods
Particles Fluorescent particles: Carboxy-coated, yellow-orange polystyrene (COOH-PS [YO], 50 nm) NPs, carboxy-coated yellow-green polystyrene (COOH-PS [YG], 50 nm) NPs, plain yellow-green polystyrene (plain-PS [YG], 50 nm) NPs, and bulk carboxy-coated, yellow-green polystyrene (COOH-PS [YG], 200 nm) particles were from Polysciences. FITC-labelled silica NPs (50 nm) were purchased from Kisker. All particles were added directly to the cell culture medium at concentrations of 25 µg/ml. Each lot of NPs was subjected to in vitro analysis by FCS for the presence of free dye. FCS discriminates two (or more) fluorescent species of different size in the same solution by fitting the resulting autocorrelation functions with one-, two or multi-component diffusion models (see below). In all imaging experiments particle lots were used with FCS autocorrelation curves that could be fitted with one-component models of diffusion, e.g. diffusion times typical of the fluorescent NPs exclusive of free dye. Tem Nanoparticle stock solutions were diluted with water and a small aliquot was placed on 400 mesh carbon-coated formvar copper grids. After 10 min, excess fluid was discarded and the samples were negatively stained with uranyl acetate (2%) in water for 30 seconds. Finally the specimens were examined with a transmission electron microscope CEM 902A (Zeiss Oberkochen) at an acceleration voltage amounting to 80 kV.
Cell culture
HEp-2 and HeLa cells obtained from the American Tissue Culture Collection ATCC (Rockville, USA), and transformed mouse fibroblasts (NIH-3T3) from wild-type mice (a kind gift of Zhao-Qi Wang, FLI Jena) were cultured in Dulbecco's modified Eagle's medium (DMEM) supplemented with 10% fetal calf serum in a 10% CO 2 atmosphere at 37°C. For live cell imaging experiments, cells were seeded on 42 mm glass dishes (Saur Laborbedarf, Reutlingen, Germany). Viability assays of NP (COOH-PS, plain-PS or silica)-loaded HEp-2, U-2 OS and NIH-3T3 cells did not reveal cell death or retarded cell growth behavior [17] , [18] and data not shown. Consistent with unaltered cell viability, live cell imaging of cell division after intracellular COOH-PS NP-wash in appeared normal with no delays in mitotic events ( Figure S1 A ). Recombinant Proteins Full-length green and red fluorescent protein were expressed as His 6 -tagged fusion proteins in Escherichia coli BL21(DE3) by PCR-cloning of full-length GFP and RFP cDNAs. Details on the construction of the expression plasmids pTOPO-EGFP-HisMyc and pTOPO-mRFP-HisMyc will be provided upon request. Expression and purification of recombinant proteins were performed according to protocols detailed previously [49] . Protein concentrations were determined using the micro BSA protein assay kit (Pierce). Frap Fluorescence Recovery after Photobleaching (FRAP) experiments were carried out on a Zeiss LSM 510Meta or LSM 710 confocal microscope (Carl Zeiss, Jena, Germany) essentially as described before [50] , [51] . Briefly, two to ten images were taken before the bleach pulse and 50–200 images after bleaching of circular 'regions of interest' (ROIs) at 0.05% laser transmission to minimize scan bleaching. Image acquisition frequency was adapted to the recovery rate of the respective fluorescence signal. The pinhole was adjusted to 1 airy unit. FRAP data were corrected for background signals and scan bleaching signal decay according to Rabut and Ellenberg [20] . Origin software (OriginLab, Northhampton, MA, USA) was used for non-linear regression fitting of FRAP curves. FRAP data were fitted with an exponential recovery function (Eq. 1) considering two exponential terms. (1) with F(t): fluorescence at any time, F f : amount of fast fraction, F s : amount of slow fraction, y 0 : fluorescence intensity immediately after the bleach pulse, t f : rate constant of fast fraction, t s : rate constant of slow fraction. Since FRAP for NPs measured in living cells always recovered to pre-bleach values it was not necessary to include an immobile fraction into the fitting function. The two exponential terms describe the behaviour of a fast and a slow fraction of molecules in the FRAP ROI as explained in detail elsewhere [52] , [53] . Briefly, the fast fraction is assumed to be comprised of freely diffusing and randomly colliding molecules. This assumption is consistent with a very rapid fluorescence recovery in the first milliseconds after the bleach pulse. The second exponential term describes fluorescence recovery of molecules which exhibit potentially specific binding reactions at an immobile structure within the FRAP ROI [52] , [53] . For evaluation of NP dynamics in Figure 3 , only the fractions and recovery halftimes of the slower moving population was considered. This slower fraction is termed F (slow) in Figure 3 . The recovery halftime ( t 50% ) of the slow fraction was calculated as ln(2) × t s , as deduced previously by Bulinski et al. [52] .
Show full methods section
Particles Fluorescent particles: Carboxy-coated, yellow-orange polystyrene (COOH-PS [YO], 50 nm) NPs, carboxy-coated yellow-green polystyrene (COOH-PS [YG], 50 nm) NPs, plain yellow-green polystyrene (plain-PS [YG], 50 nm) NPs, and bulk carboxy-coated, yellow-green polystyrene (COOH-PS [YG], 200 nm) particles were from Polysciences. FITC-labelled silica NPs (50 nm) were purchased from Kisker. All particles were added directly to the cell culture medium at concentrations of 25 µg/ml. Each lot of NPs was subjected to in vitro analysis by FCS for the presence of free dye. FCS discriminates two (or more) fluorescent species of different size in the same solution by fitting the resulting autocorrelation functions with one-, two or multi-component diffusion models (see below). In all imaging experiments particle lots were used with FCS autocorrelation curves that could be fitted with one-component models of diffusion, e.g. diffusion times typical of the fluorescent NPs exclusive of free dye. Tem Nanoparticle stock solutions were diluted with water and a small aliquot was placed on 400 mesh carbon-coated formvar copper grids. After 10 min, excess fluid was discarded and the samples were negatively stained with uranyl acetate (2%) in water for 30 seconds. Finally the specimens were examined with a transmission electron microscope CEM 902A (Zeiss Oberkochen) at an acceleration voltage amounting to 80 kV.
Cell culture
HEp-2 and HeLa cells obtained from the American Tissue Culture Collection ATCC (Rockville, USA), and transformed mouse fibroblasts (NIH-3T3) from wild-type mice (a kind gift of Zhao-Qi Wang, FLI Jena) were cultured in Dulbecco's modified Eagle's medium (DMEM) supplemented with 10% fetal calf serum in a 10% CO 2 atmosphere at 37°C. For live cell imaging experiments, cells were seeded on 42 mm glass dishes (Saur Laborbedarf, Reutlingen, Germany). Viability assays of NP (COOH-PS, plain-PS or silica)-loaded HEp-2, U-2 OS and NIH-3T3 cells did not reveal cell death or retarded cell growth behavior [17] , [18] and data not shown. Consistent with unaltered cell viability, live cell imaging of cell division after intracellular COOH-PS NP-wash in appeared normal with no delays in mitotic events ( Figure S1 A ). Recombinant Proteins Full-length green and red fluorescent protein were expressed as His 6 -tagged fusion proteins in Escherichia coli BL21(DE3) by PCR-cloning of full-length GFP and RFP cDNAs. Details on the construction of the expression plasmids pTOPO-EGFP-HisMyc and pTOPO-mRFP-HisMyc will be provided upon request. Expression and purification of recombinant proteins were performed according to protocols detailed previously [49] . Protein concentrations were determined using the micro BSA protein assay kit (Pierce). Frap Fluorescence Recovery after Photobleaching (FRAP) experiments were carried out on a Zeiss LSM 510Meta or LSM 710 confocal microscope (Carl Zeiss, Jena, Germany) essentially as described before [50] , [51] . Briefly, two to ten images were taken before the bleach pulse and 50–200 images after bleaching of circular 'regions of interest' (ROIs) at 0.05% laser transmission to minimize scan bleaching. Image acquisition frequency was adapted to the recovery rate of the respective fluorescence signal. The pinhole was adjusted to 1 airy unit. FRAP data were corrected for background signals and scan bleaching signal decay according to Rabut and Ellenberg [20] . Origin software (OriginLab, Northhampton, MA, USA) was used for non-linear regression fitting of FRAP curves. FRAP data were fitted with an exponential recovery function (Eq. 1) considering two exponential terms. (1) with F(t): fluorescence at any time, F f : amount of fast fraction, F s : amount of slow fraction, y 0 : fluorescence intensity immediately after the bleach pulse, t f : rate constant of fast fraction, t s : rate constant of slow fraction. Since FRAP for NPs measured in living cells always recovered to pre-bleach values it was not necessary to include an immobile fraction into the fitting function. The two exponential terms describe the behaviour of a fast and a slow fraction of molecules in the FRAP ROI as explained in detail elsewhere [52] , [53] . Briefly, the fast fraction is assumed to be comprised of freely diffusing and randomly colliding molecules. This assumption is consistent with a very rapid fluorescence recovery in the first milliseconds after the bleach pulse. The second exponential term describes fluorescence recovery of molecules which exhibit potentially specific binding reactions at an immobile structure within the FRAP ROI [52] , [53] . For evaluation of NP dynamics in Figure 3 , only the fractions and recovery halftimes of the slower moving population was considered. This slower fraction is termed F (slow) in Figure 3 . The recovery halftime ( t 50% ) of the slow fraction was calculated as ln(2) × t s , as deduced previously by Bulinski et al. [52] .
Fcs Fluorescence correlation spectroscopy
(FCS) measurements were performed at 37°C on a LSM 510Meta/ConfoCor2 combi system using a C-Apochromat infinity-corrected 1.2 NA 40X water objective (Carl Zeiss, Jena, Germany) as described in detail before [54] . Briefly, NP fluorescence in vitro and in living cells was spot-illuminated with the 488 nm line of a 20 mW Argon laser at 5.5 Ampere tube current attenuated by an acousto-optical tunable filter (AOTF) to 0.1%. The detection pinhole had a diameter of 70 µm and emission was recorded through a 505–530 nm band-path filter. For the measurements, 30 time series of 10 seconds (s) each were recorded with a time resolution of 1 µs and then superimposed for fitting to a one-component-free or one-component-anomalous diffusion models in three dimensions with triplet function using Origin Software (OriginLab, Northhampton, MA, USA) or ZEN software (Carl Zeiss, Jena, Germany). Measurements were repeated at least 10 times to determine mean values and standard deviations. The calibration of the focal volume dimensions was done with Rhodamine-6G (R6G) (Sigma) dissolved in water, which has a diffusion coefficient of D R6G = 420 µm 2 s −1 [55] .
Determination of the hydrodynamic radius
According to Stokes law, the diffusion coefficient D for spherical molecules is inversely proportional to the hydrodynamic radius R h , determined by: (2) with the temperature T, Boltzmann constant k B and the viscosity η .
Rics Raster scanning image correlation spectroscopy
(RICS) was performed as described previously [55] on a LSM 710 (Carl Zeiss MicroImaging GmbH, Jena) using a C-Apochromat infinity-corrected 1.2 NA 40X water objective, a frame size of 512×512 pixels, a pixel size of 0.03 µm, and a scan speed of 6.4 µs/pixel. For RICS, cells were maintained in HEPES-buffered medium without phenol red to minimize background fluorescence. A time series of 50 images was recorded. After subtracting a moving average to remove slow moving structures and cellular movement the average spatial correlation was computed and fitted to a free 3-dimensional diffusion model provided by the inbuilt software module. The diffusion model and the spatial autocorrelation fit function are described in detail in Digman et al. [23] , [42] . Diffusion maps were created using a region of interest (ROI) size of 64×64 pixels with 32 pixel shifts in each direction and the same model for fitting.
Supporting Information Figure S1 Figure S1 shows subcellular localization of polystyrene nanoparticles throughout mitosis and their colocalization with mitochondrial structures in interphase cells. (A, B) Living HEp-2 cells were incubated simultaneously with fluorescent COOH-PS [YO] NPs (red) and plain-PS [YG] NPs. Mid-nucleus confocal sections were acquired in (A) an interphase cell or (B) a mitotic cell. (C) Living HEp-2 cells were co-labelled with Mitotracker (green) and fluorescent COOH-PS [YO] NPs (red). A representative mid-nucleus confocal section was acquired in an interphase cell. (D) COOH-PS [YO] nanoparticles do not interfere with cell division. Living HEp-2 cells were incubated with fluorescent COOH-PS [YO] NPs. A representative cell in metaphase was selected for time lapse microscopy and followed through mitosis until the early G1 phase. Images show mid-nucleus confocal sections of particle fluorescence (green, inverted color) and differential interference contrast (DIC). Bars, 10 µm. min, minutes. (TIF) Click here for additional data file. Table S1 Table S1 provides particle characterization by dynamic light scattering analysis. Particle size and zeta potential were measured using the Zetasizer Nano-ZS (Malvern Instruments Ltd). The mean size of polystyrene or silica NPs were measured by dynamic light scattering. The zeta potential was measured by laser Doppler electrophoresis. FITC, fluorescein isothiocyanate; mV, millivolt; nm, nanometer; PS, polystyrene; YG, yellow green; YO, yellow orange; ζ, zeta. (DOC) Click here for additional data file.
📊 Figures
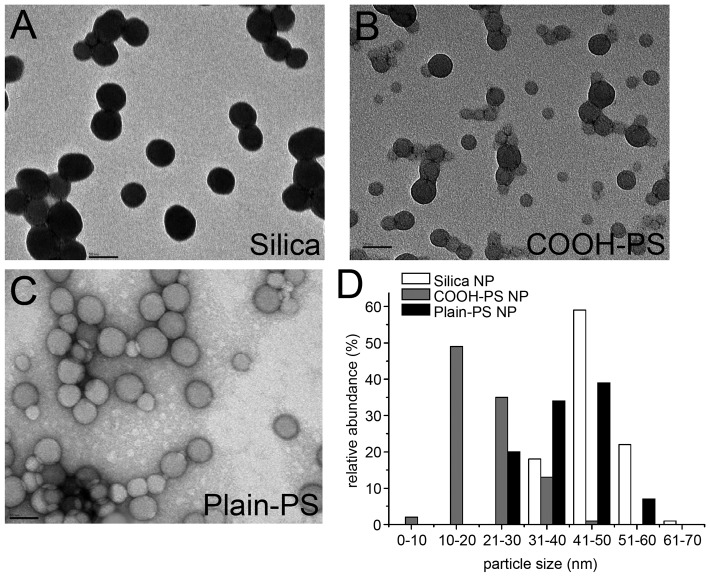
Figure 1
TEM analysis of fluorescent nanoparticles.
Fluorescent (A) silica, (B) carboxylated polystyrene (COOH-PS [YO]) and (C) plain polystyrene (plain-PS [YG]) nanoparticles (NPs) were visualized by transmission electron microscopy (TEM) at 250K-fold...
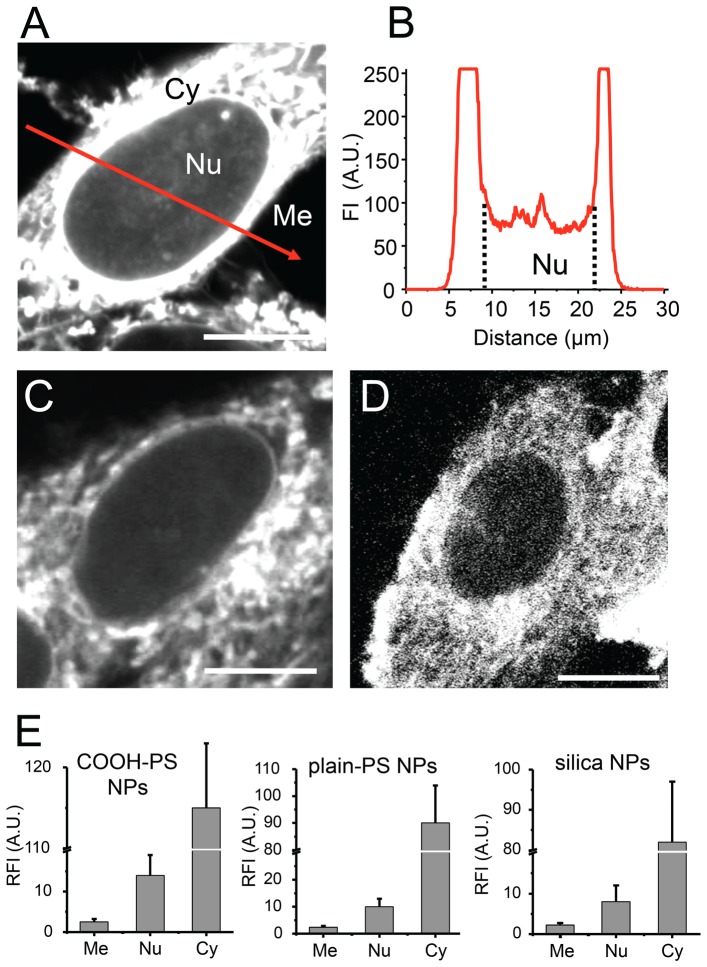
Figure 2
Cellular distribution of nanoparticles.
(A) Living HEp-2 cells were incubated with fluorescent (A) COOH-PS [YO] , (C) plain-PS YG or (D) silica NPs for one hour and analyzed by confocal microscopy. Representative micrographs show mid-nuclea...
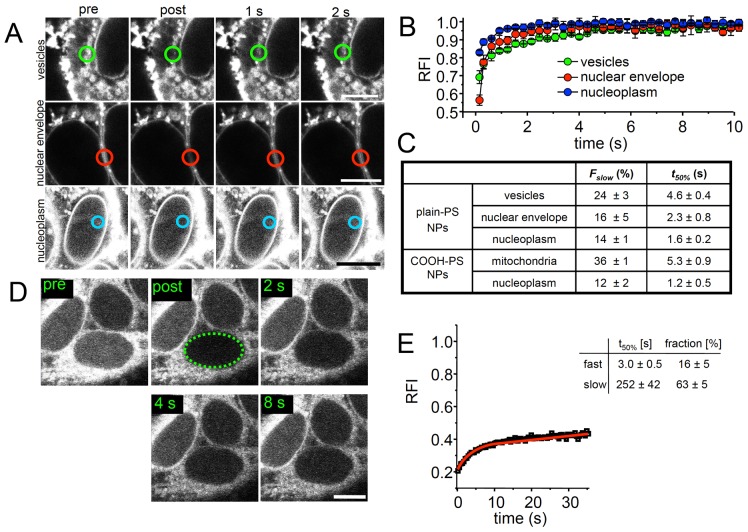
Figure 3
Quantitative analysis of PS NP dynamics in living cells by FRAP.
(A) HEp-2 cells were subjected to fluorescence recovery after photobleaching (FRAP) after incubation with fluorescent plain-PS [YG] NPs for 1 hour. Quantification was performed in circular regions con...
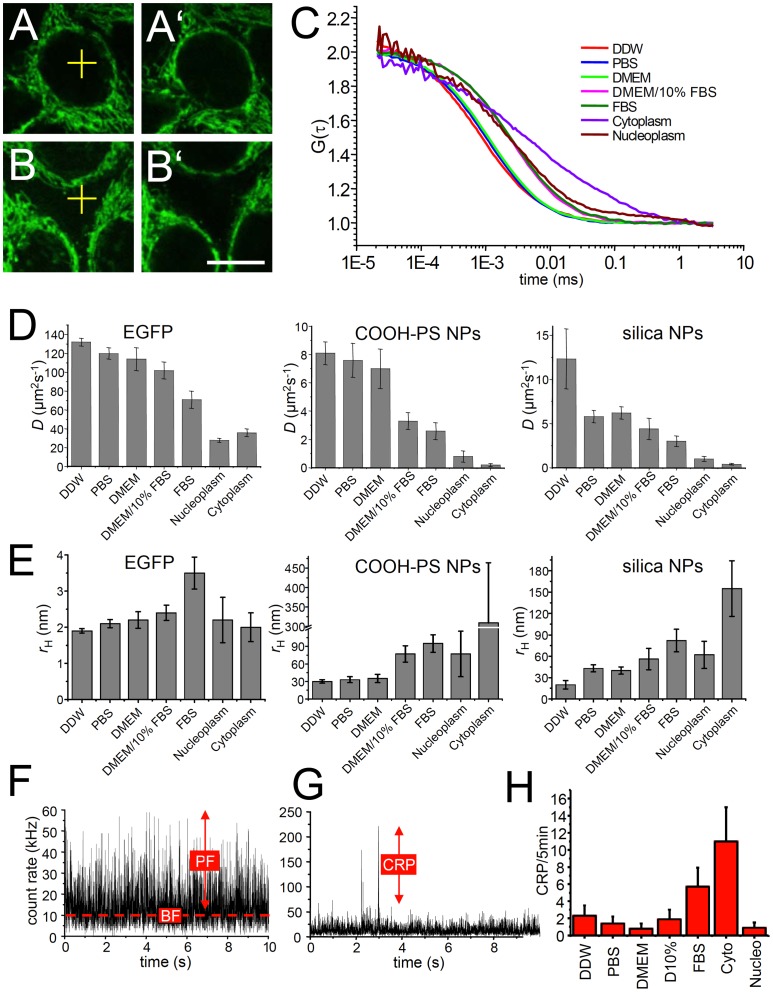
Figure 4
Diffusion behavior of nanoparticles in living cells and in vitro .
(Au2013B') Sample micrographs: HEp-2 cells were incubated with fluorescent COOH-PS [YO] NPs for 30 min and FCS measurements were performed in the nucleus (A, yellow cross) or at cytoplasmic locations ...
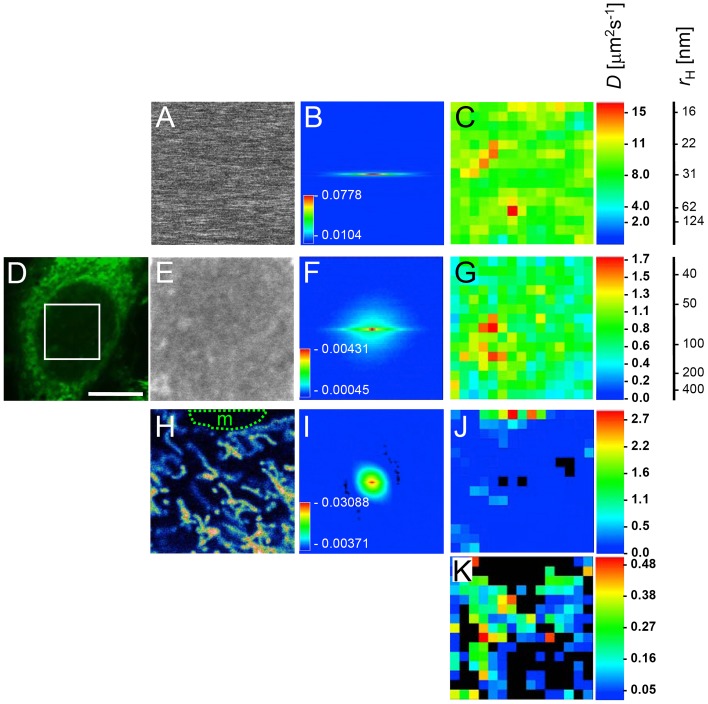
Figure 5
Nanoparticle dynamics in living cells and in vitro assessed by RICS.
(A) A time series of fluorescent COOH-PS [YO] NPs that at room temperature freely diffuse in water was acquired by confocal microscopy (frame size: 512u00d7512 pixels; pixel size: 0.03 mm; scan speed:...
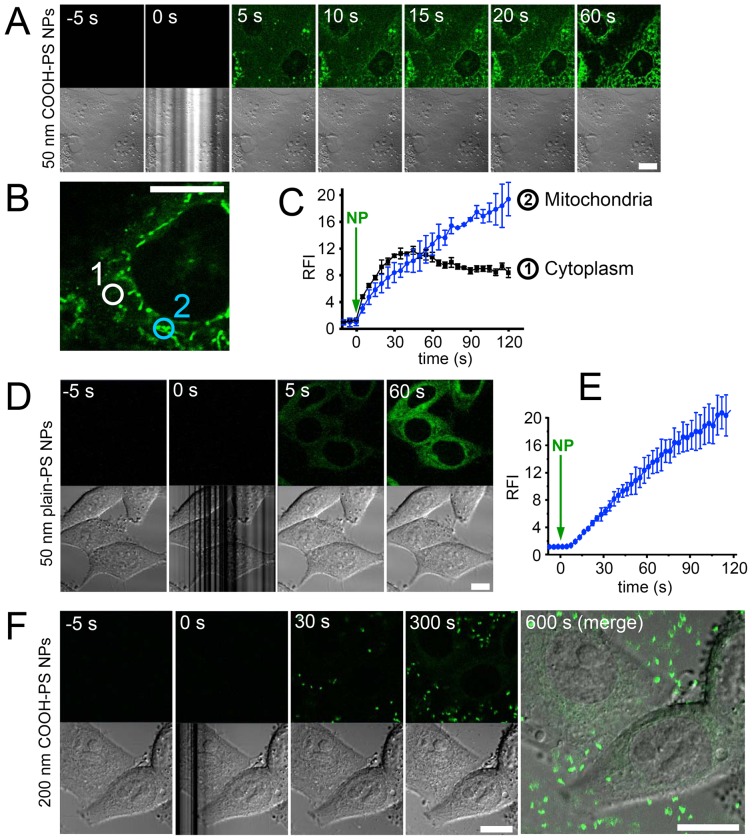
Figure 6
Rapid uptake of polystyrene nanoparticles in living cells.
(A) Living HEp-2 cells were imaged to visualize particle fluorescence by confocal microscopy (upper panel) and differential interference contrast (DIC, lower panel). Fluorescent COOH-PS [YO] NPs were ...
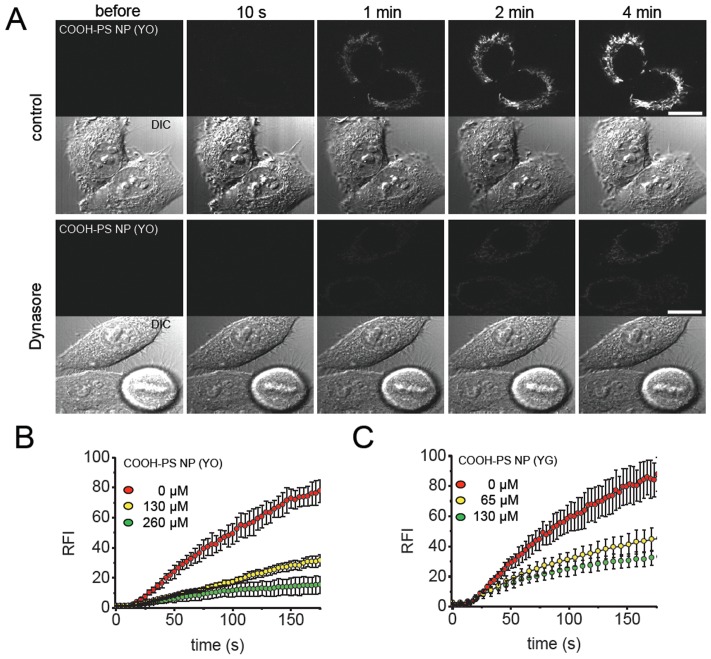
Figure 7
Dynasore inhibits uptake of COOH-PS NPs.
(A) HEp-2 cells were incubated with fluorescent COOH-PS [YO] NPs in the absence (upper panel) or presence of 130 u00b5M dynasore. Representative confocal images of fluorescence in mid-nucleus sections...
Figure images are served from the NIH/NLM PubMed Central Open Access Subset or Europe PMC; copyright remains with the publishers and authors.
💬 Discussion
0 commentsNo comments yet. Be the first to start a discussion!
Leave a Comment