Abstract
Cancer cells could be locally damaged using specifically targeted gold nanoparticles and laser pulse irradiation, while maintaining minimum damage to nearby, particle-free tissue. Here, we show that in addition to the immediate photothermal cell damage, high concentrations of reactive oxygen species (ROS) are formed within the irradiated cells. Burkitt lymphoma B cells and epithelial breast cancer cells were targeted by antibody-coated gold nanospheres and irradiated by a few resonant femtosecond pulses, resulting in significant elevation of intracellular ROS which was characterized and quantified using time-lapse microscopy of different fluorescent markers. The results suggest that techniques that involve targeting of various malignancies using gold nanoparticles and ultrashort pulses may be more effective and versatile than previously anticipated, allowing diverse, highly specific set of tools for local cancer therapy.
🔬 Techniques
🔭 Microscopes
💻 Software
✨ Fluorophores
🧪 Sample Preparation
🔬 Cell Lines
🏭 Microscope Brands
🧪 Reagent Suppliers
💻 Software Details
🏛️ Research Organizations (ROR)
Affiliated research institutions:
📋 Methods
Cell cultures
BJAB and K562 cells were grown at 37°C and 5% CO 2 in RPMI-1640 medium (Sigma) and DMEM medium (Invitrogen), respectively, supplemented by 2 mM glutamine, 5 mM sodium pyruvate and 10% heat-inactivated fetal bovine serum. Cells were maintained at a concentration below 10 6 cells per ml to allow logarithmic growth. MDA-MB-468 cells were grown at 37°C and 5% CO 2 in DMEM medium (Invitrogen) supplemented by 5 mM sodium pyruvate and 10% heat-inactivated fetal bovine serum. For contradicting the effect of ROS, cell cultures were supplemented with fresh medium containing 500 μM ascorbic acid two hours prior to irradiation.
Nanoparticle preparation
Gold nanoparticles were prepared using a citrate reduction protocol 52 resulting in an average particle diameter of 20 nm. Anti-CD20 (Rituximab, Roche Israel) coating of the gold nanoparticles was carried out according to Weiss et al. 53 . Anti-EGFR (Lab Vision, clone designation EGFR.1) coating was achieved by incubating anti-EGFR with OPSS-PEG2000-NHS (Jenkem) for 1 h in a mole ratio of 1:2500, followed by additional 1 h incubation with gold nanospheres in a mole ratio of 1:10 6 nanospheres: OPSS-PEG2000-NHS.
Cell targeting by nanoparticles
BJAB cells (10 6 cells per ml) were incubated for 15 min at 37°C with 4 × 10 10 anti CD20-coated gold nanoparticles per ml. Cells were washed off unbound gold nanoparticles (three PBS washes) prior to laser irradiation. A co-culture of 1:1 ratio BJAB:K562 cells was incubated under the same conditions as described above. MDA-MB-468 cells were incubated for 60 min at 37°C with 2 × 10 11 anti-EGFR-coated gold nanoparticles per ml. Incubation times for each cell line were set for reaching saturation of the number of nanoparticles attached to each cell.
Show full methods section
Cell cultures
BJAB and K562 cells were grown at 37°C and 5% CO 2 in RPMI-1640 medium (Sigma) and DMEM medium (Invitrogen), respectively, supplemented by 2 mM glutamine, 5 mM sodium pyruvate and 10% heat-inactivated fetal bovine serum. Cells were maintained at a concentration below 10 6 cells per ml to allow logarithmic growth. MDA-MB-468 cells were grown at 37°C and 5% CO 2 in DMEM medium (Invitrogen) supplemented by 5 mM sodium pyruvate and 10% heat-inactivated fetal bovine serum. For contradicting the effect of ROS, cell cultures were supplemented with fresh medium containing 500 μM ascorbic acid two hours prior to irradiation.
Nanoparticle preparation
Gold nanoparticles were prepared using a citrate reduction protocol 52 resulting in an average particle diameter of 20 nm. Anti-CD20 (Rituximab, Roche Israel) coating of the gold nanoparticles was carried out according to Weiss et al. 53 . Anti-EGFR (Lab Vision, clone designation EGFR.1) coating was achieved by incubating anti-EGFR with OPSS-PEG2000-NHS (Jenkem) for 1 h in a mole ratio of 1:2500, followed by additional 1 h incubation with gold nanospheres in a mole ratio of 1:10 6 nanospheres: OPSS-PEG2000-NHS.
Cell targeting by nanoparticles
BJAB cells (10 6 cells per ml) were incubated for 15 min at 37°C with 4 × 10 10 anti CD20-coated gold nanoparticles per ml. Cells were washed off unbound gold nanoparticles (three PBS washes) prior to laser irradiation. A co-culture of 1:1 ratio BJAB:K562 cells was incubated under the same conditions as described above. MDA-MB-468 cells were incubated for 60 min at 37°C with 2 × 10 11 anti-EGFR-coated gold nanoparticles per ml. Incubation times for each cell line were set for reaching saturation of the number of nanoparticles attached to each cell.
Fluorescence labeling
In the co-culture experiment, the nuclei of the BJAB cells were stained blue using 1.3 μg/ml Hoechst (Aldrich) for 4 minutes at 37°C, followed by 3 PBS washes. Cells were stained for cellular ROS by incubation with 20 μM H 2 DCFDA (Invitrogen) for 5 min at 37°C, or by incubation with 10 μM CellROX™ deep red for 1 h at 37°C. Fluorescence microscopy of the ROS levels was conducted approximately 90 min post-irradiation. The detection of intracellular ROS is highly sensitive to the physiology and metabolism of the cells; hence, different ROS markers that operate through different mechanisms are required for avoiding false positive results. While high levels of ROS in BJAB cells were effectively detected using both H 2 DCFDA and CellROX markers, ROS in MDA-MB-468 cells could not be detected by the H 2 DCFDA marker, probably due to absence of cellular esterases required for activating fluorescence 32 33 . Staining for necrosis and apoptosis was carried out using 1 μg/ml Propidium iodide (Sigma) and Annexin V kit (Roche), respectively. Mitochondrial oxidative activity was detected by incubating the cells with 200 nM MitoTracker red (CM-H 2 XRos; Invitrogen) for 25 min at 37°C.
Actinomycin D treatment of MDA-MB-468 cells
Cells were incubated with 10 μg/ml Actinomycin D for 2 h, followed by three PBS washes.
Laser pulse irradiation
A beam from a Ti:sapphire oscillator (Tsunami, Newport Corp.) was amplified (Spitfire Pro XP) and wavelength-tuned to 550 nm using an optical parametric amplifier (OPA; Topas-C). Pulse duration was 50 fs, at 1 kHz repetition rate. Cells were irradiated within eight-well chamber slides (Lab-Tek II, Thermo-scientific) placed within a microscope stage incubator (Okolab Inc.) at controlled temperature and CO 2 concentration. The irradiated area of each cell culture was approximately 100 mm 2 and 16 mm 2 for the BJAB and MDA-MB-468 cells, respectively, using repeated pulse irradiation at an array of approximately 300 μm diameter spots. Single pulse fluence was either 16.5 mJ/cm 2 (3.3 × 10 11 W/cm 2 ) or 24.5 mJ/cm 2 (4.9 × 10 11 W/cm 2 ) for the BJAB and MDA-MB-468 cells, respectively. Multiple pulse irradiations per spot was achieved by tuning the beam scanning rates so that each culture location was irradiated by the desired number of overlapping spots.
Data analysis
Selected images of BJAB and MDA-MB-468 cells, acquired 90 min after irradiation, were used to estimate the percentage of cells with high levels of ROS using NIS-Elements Advanced Research (Nikon) software. The percentage of cells with ROS levels above twice the basal level of the control cells (nanoparticle-free, non-irradiated) was evaluated for different irradiation parameters using manual cell counting. In cultures where cell fusion was abundant, each nucleus within the fused cells was considered as a single ROS-expressing cell, resulting in up to 10% bias of our estimation toward higher abundance of cells affected by ROS. Selected images of MDA-MB-468 cells, acquired 22 h and 50 h post irradiation were used to estimate the percentage of dead (necrotic, apoptotic or cell cadavers) cells for different irradiation parameters using manual counting. The statistical significance of the results was assessed using a two-proportion z-test.
Supplementary Material Supplementary Information Dataset 1-7
📊 Figures
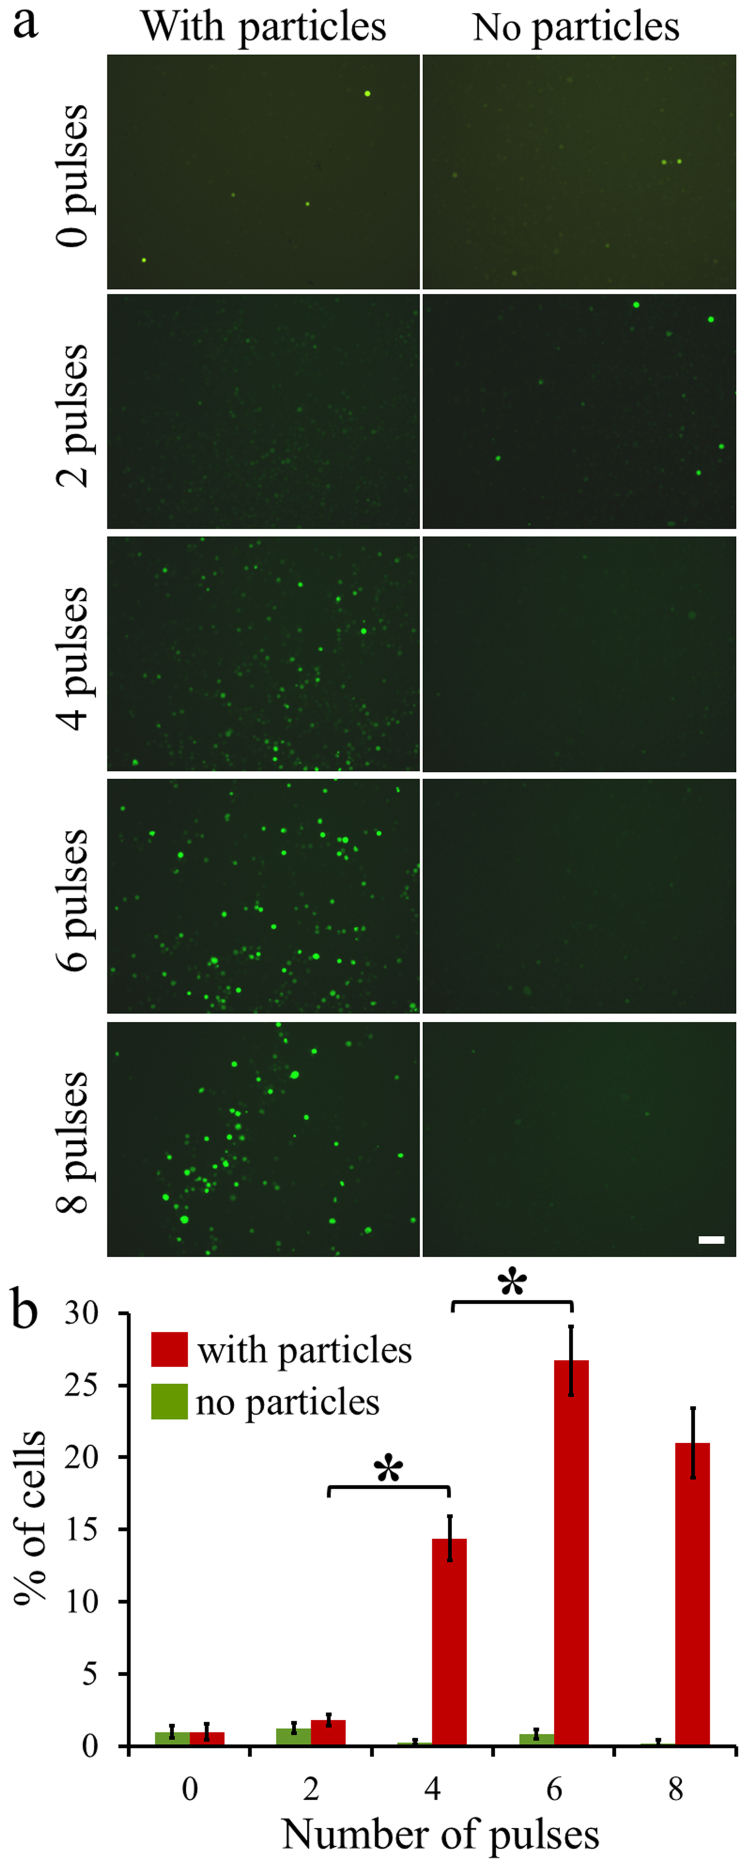
Figure 1
ROS in nanoparticle-targeted Burkitt lymphoma cells after irradiation by resonant femtosecond pulses.
(a). Fluorescence images of green ROS marker captured 90 minutes after irradiation. Each green spot corresponds to a single cell. Scale bar represents 50u2005u03bcm. (b). Percentage of cells in which ...
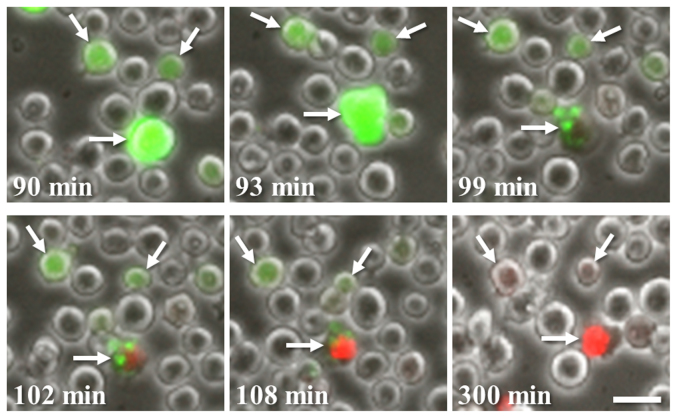
Figure 2
Necrosis in Burkitt lymphoma cells following high intracellular levels of ROS, as seen in selected frames from a time-lapse multi-channel fluorescence and phase-contrast microscopy of the nanoparticle-targeted cells irradiated by eight pulses (see lower-left panels in Fig. 1 ).
Numbers at the bottom-left of each frame denote the time elapsed from the moment of irradiation. White arrows point to three representative cells in which excessive ROS (green) is accumulated, followe...
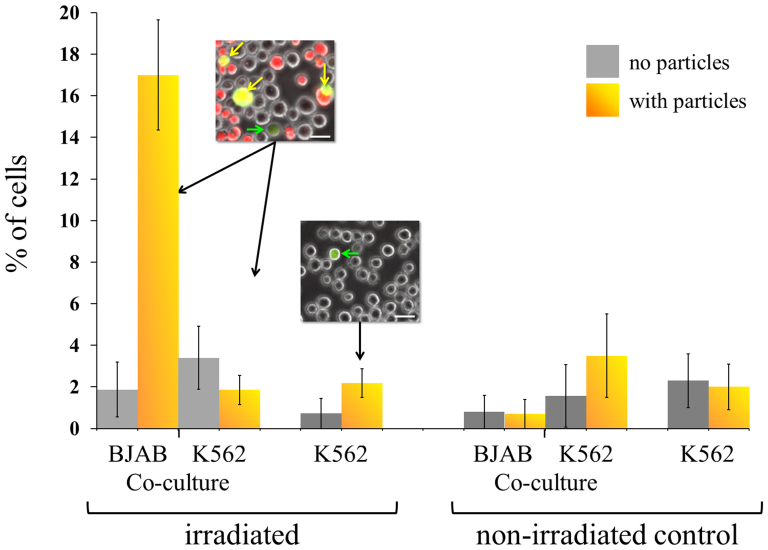
Figure 3
ROS levels in a Burkitt lymphoma (BJAB) and K562 leukemia cell co-culture, and in a homogenous K562 cell culture.
The CD20-expressing BJAB cells respond well to the irradiation, while the K562 cells, that do not express CD20, show no change, either in a co-culture or in a homogeneous culture. Insets show magnifie...
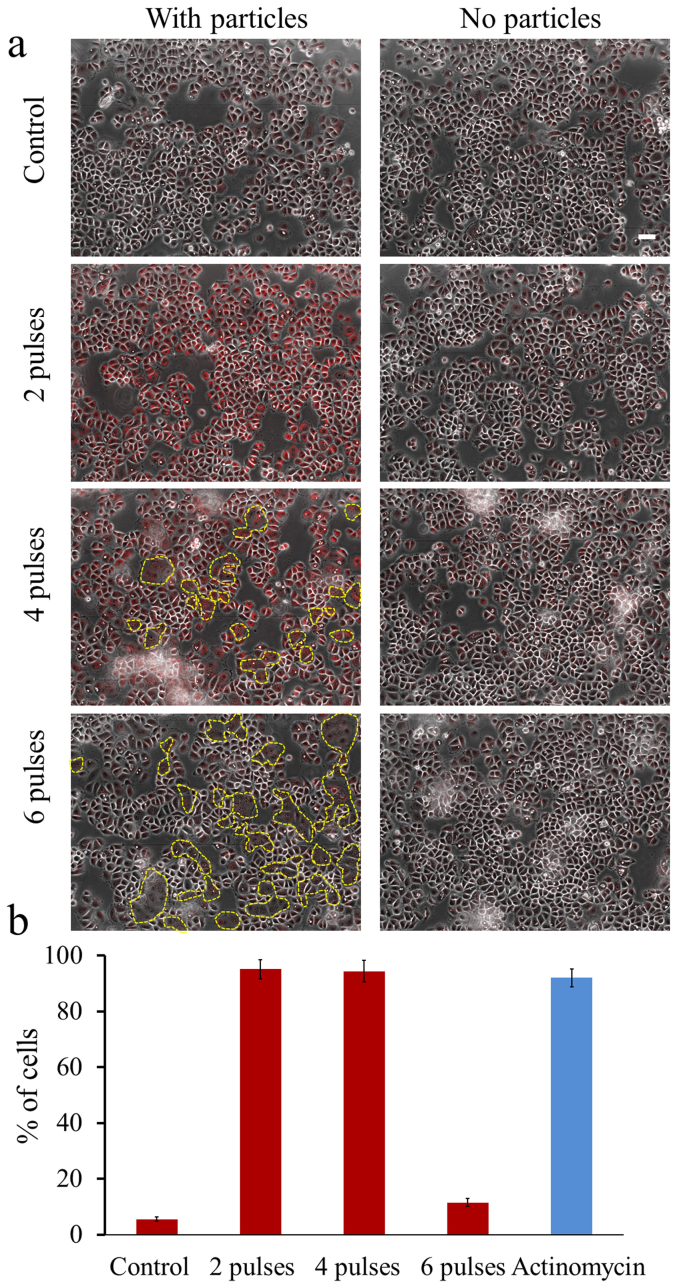
Figure 4
ROS in epithelial breast cancer cells following laser pulse irradiation.
(a). Fluorescence (red ROS marker) superimposed on phase contrast images of cells irradiated by up to six pulses (25u2005mJ/cm 2 each). Regions marked by yellow dashed curves represent large multinucl...
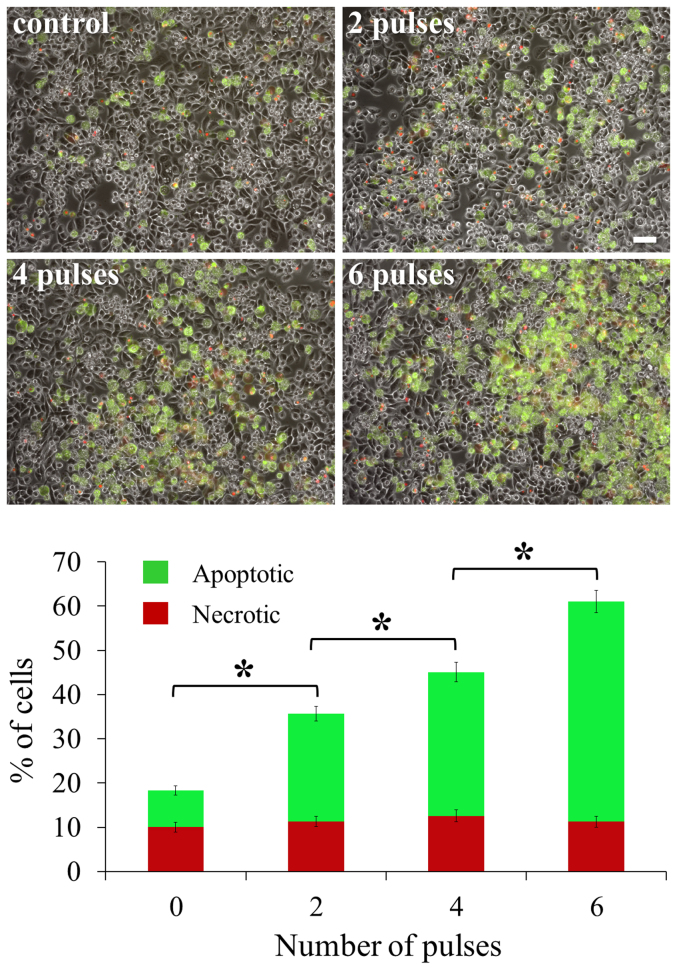
Figure 5
Death of epithelial breast cancer cells as a result of ROS produced by laser pulse irradiation.
Red (necrosis) and green (apoptosis) fluorescence distributions superimposed on phase-contrast images, captured 22u2005h post irradiation. Irradiation parameters were similar to those described in Fig...
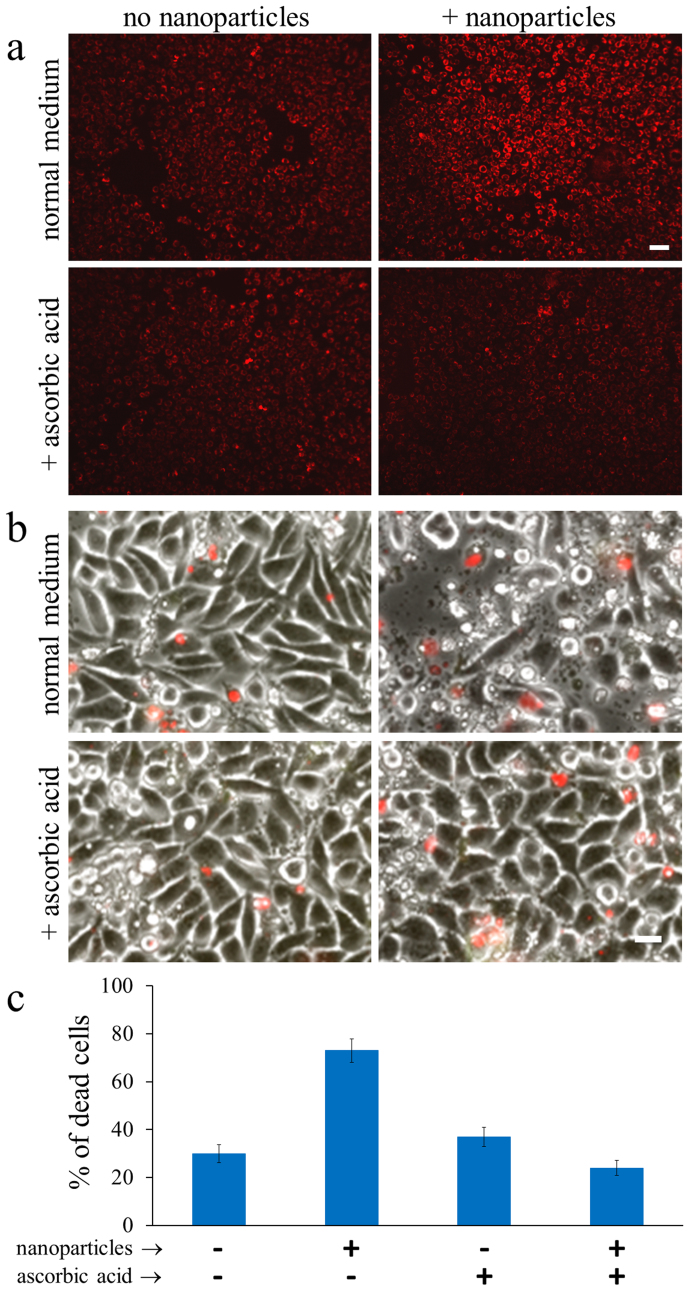
Figure 6
Ascorbic acid diminishes ROS levels and epithelial breast cancer cells death following irradiation by laser pulses.
(a). Fluorescence (Red, CellROX) microscopy of cells 2u2005h post irradiation by six pulses (22u2005mJ/cm 2 each). Scale bar represents 40u2005u03bcm. (b). Red (necrosis) fluorescence superimposed on ...
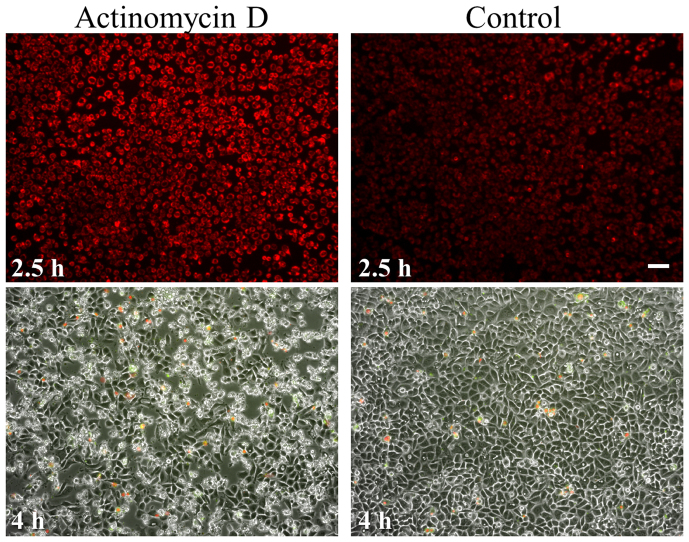
Figure 7
ROS and cellular death in epithelial breast cancer cells induced by Actinomycin D.
Upper panels: red fluorescence indicates high levels of ROS. Lower panels: red (necrosis) and green (apoptosis) fluorescence distributions superimposed on phase-contrast images. Scale bar represents 8...
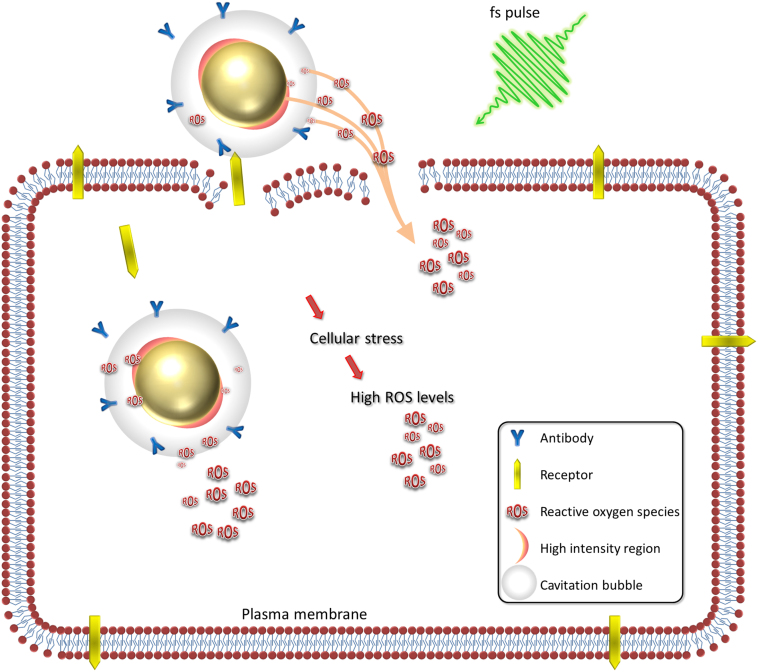
Figure 8
Schematic illustration of the proposed model for the processes leading to high levels of ROS in nanoparticle-targeted cells irradiated by femtosecond pulses.
Figure images are served from the NIH/NLM PubMed Central Open Access Subset or Europe PMC; copyright remains with the publishers and authors.
💬 Discussion
0 commentsNo comments yet. Be the first to start a discussion!
Leave a Comment