Abstract
In this study, thermoplastic cassava starch-palm wax blends, reinforced with the treated Cymbopogan citratus fiber (TPCS/ PW/ CCF) were successfully developed. The TPCS were priorly modified with palm wax to enhance the properties of the matrix. The aim of this study was to investigate the influence of alkali treatments on the TPCS/PW/CCF biocomposite. The fiber was treated with different sodium hydroxide (NaOH) concentrations (3%, 6%, and 9%) prior to the composite preparation via hot pressing. The obtained results revealed improved mechanical characteristics in the treated composites. The composites that underwent consecutive alkali treatments at 6% NaOH prior to the composite preparation had higher mechanical strengths, compared to the untreated fibers. A differential scanning calorimetry (DSC) and a thermogravimetric analysis (TGA) indicated that adding treated fibers into the TPCS matrix improved the thermal stability of the samples. The scanning electron microscopy (SEM) demonstrated an improved fiber-matrix adhesion due to the surface modification. An increment in the glass transition temperature (Tg) of the composites after undergoing NaOH treatment denoted an improved interfacial interaction in the treated samples. The Fourier transform infrared spectroscopy (FTIR) showed the elimination of hemicellulose at wavelength 1717 cm-1, for the composites treated with 6% NaOH. The water absorption, solubility, and thickness swelling revealed a higher water resistance of the composites following the alkali treatment of the fiber. These findings validated that the alkaline treatment of CCF is able to improve the functionality of the Cymbopogan citratus fiber-reinforced composites.
🔬 Techniques
🧪 Sample Preparation
🏭 Microscope Brands
💻 Software Details
🏛️ Research Organizations (ROR)
Affiliated research institutions:
📋 Methods
2. Materials and Methodology 2.1. Materials In this work, the Cymbopogan citratus plant leaves were obtained from a farm in Beranang, Selangor, Malaysia. The cassava starch (food-grade) was supplied by Antik Sempurna Sdn. Bhd (Selangor, Malaysia). Evergreen Engineering Sdn. Bhd. (Selangor, Malaysia) provided the required chemicals, including sodium hydroxide (NaOH) pellets of 98% purity, acetic acid, and analytical grade glycerol (99.5% purity). The refined palm wax (analytical grade) was purchased from Green & Natural Industries Sdn. Bhd., (Selangor, Malaysia). 2.2.
Preparation of Cymbopogan Citratus Fiber
The fiber from Cymbopogan citratus leaves used in this work was extracted using the water-retting method, by soaking the leaves in a container of water for 4 weeks. The individual fiber bundles were isolated from the retted leaves and then cleansed under running water. Next, the fibers were dried at 100 °C for 5 h in an oven to eliminate the excess moisture. The dried fibers were then cut into 1 cm lengths and stored in a zip-locked plastic bag. 2.3.
Alkaline Treatment
In this study, the dried raw Cymbopogan citratus fiber treatment was accomplished with three different compositions of aqueous NaOH (3, 6, and 9 wt.%), each for a period of 60 min and left under agitation at room temperature (28 °C). Generally, this alkali treatment facilitated the elimination of great amounts of hemicellulose and surface impurity components from the fibers’ structure. Next, the treated fibers were cleaned under running water, then pH neutralization was performed using acetic acid to eliminate any excess alkali deposits formed on the fibers’ surface. Lastly, the treated fibers underwent drying at 25 °C for 48 h and further oven drying at 60 °C for 24 h to remove any remaining moisture traces from the fibers. 2.4.
Show full methods section
2. Materials and Methodology 2.1. Materials In this work, the Cymbopogan citratus plant leaves were obtained from a farm in Beranang, Selangor, Malaysia. The cassava starch (food-grade) was supplied by Antik Sempurna Sdn. Bhd (Selangor, Malaysia). Evergreen Engineering Sdn. Bhd. (Selangor, Malaysia) provided the required chemicals, including sodium hydroxide (NaOH) pellets of 98% purity, acetic acid, and analytical grade glycerol (99.5% purity). The refined palm wax (analytical grade) was purchased from Green & Natural Industries Sdn. Bhd., (Selangor, Malaysia). 2.2.
Preparation of Cymbopogan Citratus Fiber
The fiber from Cymbopogan citratus leaves used in this work was extracted using the water-retting method, by soaking the leaves in a container of water for 4 weeks. The individual fiber bundles were isolated from the retted leaves and then cleansed under running water. Next, the fibers were dried at 100 °C for 5 h in an oven to eliminate the excess moisture. The dried fibers were then cut into 1 cm lengths and stored in a zip-locked plastic bag. 2.3.
Alkaline Treatment
In this study, the dried raw Cymbopogan citratus fiber treatment was accomplished with three different compositions of aqueous NaOH (3, 6, and 9 wt.%), each for a period of 60 min and left under agitation at room temperature (28 °C). Generally, this alkali treatment facilitated the elimination of great amounts of hemicellulose and surface impurity components from the fibers’ structure. Next, the treated fibers were cleaned under running water, then pH neutralization was performed using acetic acid to eliminate any excess alkali deposits formed on the fibers’ surface. Lastly, the treated fibers underwent drying at 25 °C for 48 h and further oven drying at 60 °C for 24 h to remove any remaining moisture traces from the fibers. 2.4.
Sample Preparation
The thermoplastic cassava starch fabrication was conducted in accordance with our previous work [ 24 ]. The ratio of starch: glycerol: palm wax was fixed at 65:30:5 (wt.%). Following this step, the mixture was then blended using a Dry Mixer, Panasonic (Shah Alam, Selangor, Malaysia) at 1200 rpm at room temperature for 5 min. The resultant mixture then underwent thermo-pressing for 30 min at a temperature of 150 °C, using a 40HC-B Technopress, Plastic Hydraulic Moulding Press (Selangor, Malaysia) with a 10-tonne load, the yielding plates having 3 mm thickness. Similar processes were used for the modification of TPCS/PW with treated CCF. The matrix’s property alterations were carried out by incorporating treated CCF, where 50 wt.% of matrix was used. Before conditioning, the prepared samples were immediately placed in a silica gel-filled desiccator. 2.5. FT-IR Analysis The FT-IR analysis of the treated and untreated TPCS/PW/CCF composites was conducted using FTIR machine JASCO FTIR-6100 Spectrometer (Tokyo, Japan), equipped with an ATR platinum diamond crystal and the manufacturer’s OMNIC software, to examine the functional groups’ changes in their fiber surfaces. All spectra within 4000–400 cm −1 range were recorded with a resolution of 4 cm −1 , for a total of 32 scans per measurement. The ATR crystal was cleaned with ethanol prior to each measurement, and the background spectra were collected and removed automatically from the recorded spectrum. An anvil was used to press the sample down into the ATR diamond crystal before the test was performed in order to create close proximity between the ATR diamond crystal and the sample. The anvil pressure setting of the ATR-FTIR was subject to variation and was not reproducible throughout all samples due to the manual adjustment. OMNIC software was used to control and correct the baseline of measurements after the correct band of spectrum was selected. 2.6. Scanning Electron Microscopy (SEM) The morphology of the fractured tensile samples’ untreated and treated TPCS/PW/CCF were examined using a scanning electron microscope (SEM), model JEOL JSM-6010 Plus (Tokyo, Japan), at 10 kV acceleration voltage. All samples were covered with gold prior to being subjected to SEM observation. 2.7.
Tensile Testing
The tensile characteristics of the specimens were investigated following the ASTM D-638 standard [ 25 ]. An INSTRON 5969 model Universal Testing Machine, manufactured by INSTRON (Noorwood, MA, USA), with 50 kg load cell. The crosshead speed of the machine was kept constant at 5 mm/min, this was used to measure tensile modulus and strength, as well as elongation. The tensile properties were estimated as the average of the obtained values after five replications of the measurements. 2.8.
Flexural Testing
The flexural test of untreated and treated TPCS/PW/CCF composite was carried out using an INSTRON 5969 Universal Testing Machine, manufactured by INSTRON (Noorwood, MA, USA), in accordance with ASTM D-790 [ 26 ], with 50% relative humidity. The samples, with dimensions of 130 mm (L) × 13 mm (W) × 3 mm (T), were prepared, and the analysis was performed using five (5) replicates, which were evaluated at 23 ± 1 °C temperature. 2.9.
Impact Testing
Izod impact tests of untreated and treated TPCS/PW/CCF composite samples were conducted in accordance with the ASTM D256 standard [ 27 ]. The Izod impact test was conducted at 23 ± 1 °C and RH of 50 ± 5%. The samples with the following dimensions: 60 mm (L) × 13 mm (W) × 3 mm (T), were prepared, and five replicates of each sample were tested in a Ray-ran impact tester, manufactured by Nuneaton, United Kingdom. The cross-sectional area of the specimens, as well as the impact energy, were considered while determining the impact strength Equation (1), as follows: Impact strength = Impact energy (J)/area (mm 2 ) (1) 2.10. Thermogravimetric Analysis (TGA) The thermal properties for untreated and treated TPCS/PW/CCF composites were analyzed using a thermogravimetric analyzer, Mettler Toledo AG, Analytical (Schwerzenbach, Switzerland). The samples were analyzed under a dynamic nitrogen atmosphere surrounding, at 50 mL/min flow rate, with temperatures ranging from 25 to 600 °C, at a constant heating rate (10 °C/min −1 ). A sample pan containing 5–15 mg of a composite was heated. TGA graphs of weight loss percentage versus temperature were used to identify the weight loss. 2.11. Differential Scanning Calorimeter (DSC) The thermal behavior of the treated TPCS/PW/CCF composite was evaluated by differential scanning calorimetry (DSC) equipment (Universal V3.9A TA, Instruments New Castle, PA, USA). Each composite sample was weighed to a 5 mg precision and placed in an aluminum sample pan with an air-tight lid during the procedure. The samples were heated to temperatures ranging from 35 to 250 °C, at a continuous scanning rate of 10 °C/min. The thermogram measurements for the DSC cell were generated using transfer temperatures, which were flushed with nitrogen gas to sustain an inert atmosphere. 2.12. X-ray Diffraction (XRD) The XRD patterns of the untreated and treated TPCS/PW/CCF composite samples were investigated using X-ray diffractometer (Rigaku, Tokyo, Japan), employing CuKα radiation (λ = 1.5406 nm) generated at 40 mA and below 40 kV, respectively. Crystallinity index CI (%) of each sample was determined according to Equation (2), where I 002 and I am are the peak intensities of crystalline and amorphous materials, respectively. Equation (2) is as follows: (2) CI = I 002 − I am I 002 × 100 % 2.13. Density The density of the treated TPCS/PW/CCF composite was carried out according to the ASTM D1895. A total of five samples were prepared (10 mm × 10 mm × 3 mm) and dried for 24 h in the oven at 105 °C. Afterwards, the samples were placed in a desiccator filled with granulated silica gel and a weighing balance and electronic densimeter were used to weigh the samples and determine their volume. The density value was determined according to Equation (3), as follows: (3) Density ( g / cm 3 ) = Mass ( g ) Volume ( cm 3 ) 2.14. Moisture Content Five samples (10 mm × 10 mm × 3 mm) were prepared for moisture content analysis. All of the samples were placed for moisture removal in an oven at 105 °C for 24 h. The weights of the samples taken from the oven were measured before (M i ) and after (M f ) the heating process in order to compute the moisture content. The moisture content was computed using Equation (4), as follows: (4) Moisture content ( % ) = M i − M f M i × 100 2.15. Water Absorption Five samples (10 mm × 10 mm × 3 mm) were placed to dry for 24 h in an air-circulating oven at 105 °C ± 2 temperatures to eliminate any remaining moisture from the samples. The samples being tested were completely immersed in water at room temperature (23 ± 1 °C) for 2 h. For water absorption calculation, the mass of the samples before (W i ) and after immersion (W f ), and the water absorption of the samples was computed according to Equation (5), as follows: (5) Water Absorption ( % ) = W i − W f W i × 100 2.16. Thickness Swelling Five test specimens were used for thickness swelling test using similar parameters for the testing as described in Section 2.13 . The thickness of each sample was recorded before (T i ) and after (T f ) immersion of the samples in water for 2 h, using a Mitutoyo digital vernier with 0.01 cm precision. The thickness swelling percentage values were evaluated using Equation (6), as follows: (6) Thickness swelling ( % ) = T i − T f T i × 100 2.17. Moisture Absorption Moisture absorption study for treated TPCS/PW/CCF composites was performed in a closed humidity chamber at room temperature of 25 ± 2 °C and relative humidity of 75 ± 2% to analyze the samples’ moisture absorption behavior. Prior to conducting the test, five (5) samples with dimensions of 10 mm × 10 mm × 3 mm were prepared and oven-dried for 24 h at 105 °C ± 2. The samples were weighed before (Wi) and after absorption (W f ) Equation (7) for a specified duration until a stable weight was attained. The moisture absorption of samples was determined using Equation (7), as follows: (7) Moisture Absorption ( % ) = W f − W i W i × 100 2.18. Water Solubility The water solubility of the samples was studied following the method reported by Chaireh et al. [ 28 ]. Prior to the water solubility investigation, five samples measuring 10 × 10 × 3 mm were cut and dried in an oven at 105 °C ± 2 for 24 h. The initial dry matter of each piece was recorded as W i . Next, each sample was immersed in 30 mL distilled water while constantly agitated. After 24 h of immersion, the remaining section of the sample was taken out of the beaker and wiped using a filter paper to remove any remaining water on the surface. Finally, all samples were dried again at 105 °C ± 2 temperature for 24 h to obtain the final weight of the sample, denoted as W f . Equation (8) was used to calculate the water solubility of the samples, as follows: (8) Water Solubility ( % ) = W i − W f W i × 100 2.19. Soil Burial A soil burial test was conducted in compliance with the procedure described in Jumaidin et al. [ 12 ]. The five samples (10 mm × 10 mm × 3 mm) were prepared and buried at 10 cm depth in soil and regularly moistened with distilled water. The ambient temperature and relative humidity (RH) for the analysis were 26 ± 4 °C and 76 ± 4%, respectively, and the pH of the soil was 6.5. The samples were wrapped in iron mesh before being buried in the soil, allowing the degraded materials to be eliminated, while still permitting microorganisms and moisture access. Before testing, all samples were dried at 105 °C for a continuous 24 h, and the weights were recorded in order to compute the initial weight, which was denoted by M i . All samples were buried in the soil for predetermined periods ranging between 2 and 4 weeks. Following that, the samples were cautiously removed from the soil at a certain period, and the impurities were softly washed with distilled water to remove any remaining contaminants. Afterward, the degraded samples were dried for 24 h in an oven at 105 °C before being reweighed to obtain the final weight, M f . The biodegradability of the samples was determined via a comparison of the weight loss before and after burial, which was calculated using Equation (9), as follows: (9) Weight loss ( % ) = M i − M f M i × 100 2.20.
Statistical Analyses
The statistical analyses of the experimental results were conducted using the analysis of variance (ANOVA) function in SPSS software. The Duncan test was also used to compare the mean values between the two groups at a significance level of 0.05 ( p ≤ 0.05). Results were summarized using the average and standard deviation for each sample (SD).
2.1. Materials In this work, the Cymbopogan citratus plant leaves were obtained from a farm in Beranang, Selangor, Malaysia. The cassava starch (food-grade) was supplied by Antik Sempurna Sdn. Bhd (Selangor, Malaysia). Evergreen Engineering Sdn. Bhd. (Selangor, Malaysia) provided the required chemicals, including sodium hydroxide (NaOH) pellets of 98% purity, acetic acid, and analytical grade glycerol (99.5% purity). The refined palm wax (analytical grade) was purchased from Green & Natural Industries Sdn. Bhd., (Selangor, Malaysia).
📊 Figures
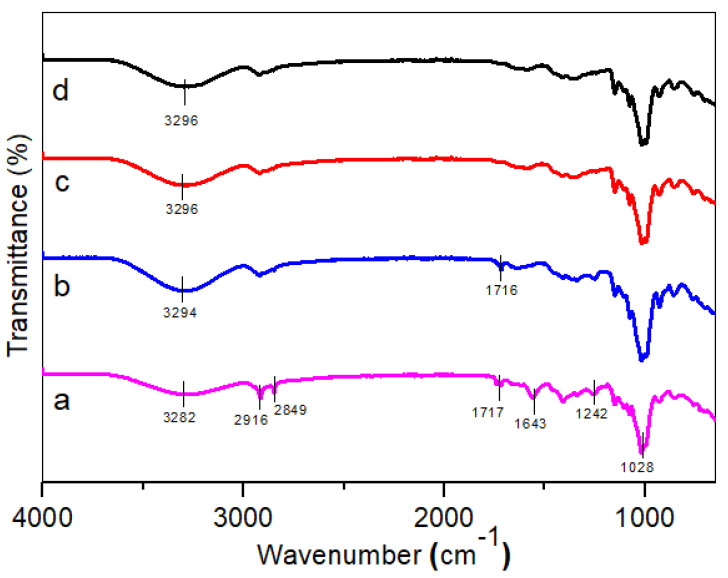
Figure 1
FT-IR spectra of (a) untreated, (b) 3 wt.%, (c) 6% wt.%, and (d) 9 wt.% of TPCS/PW/CCF composites.
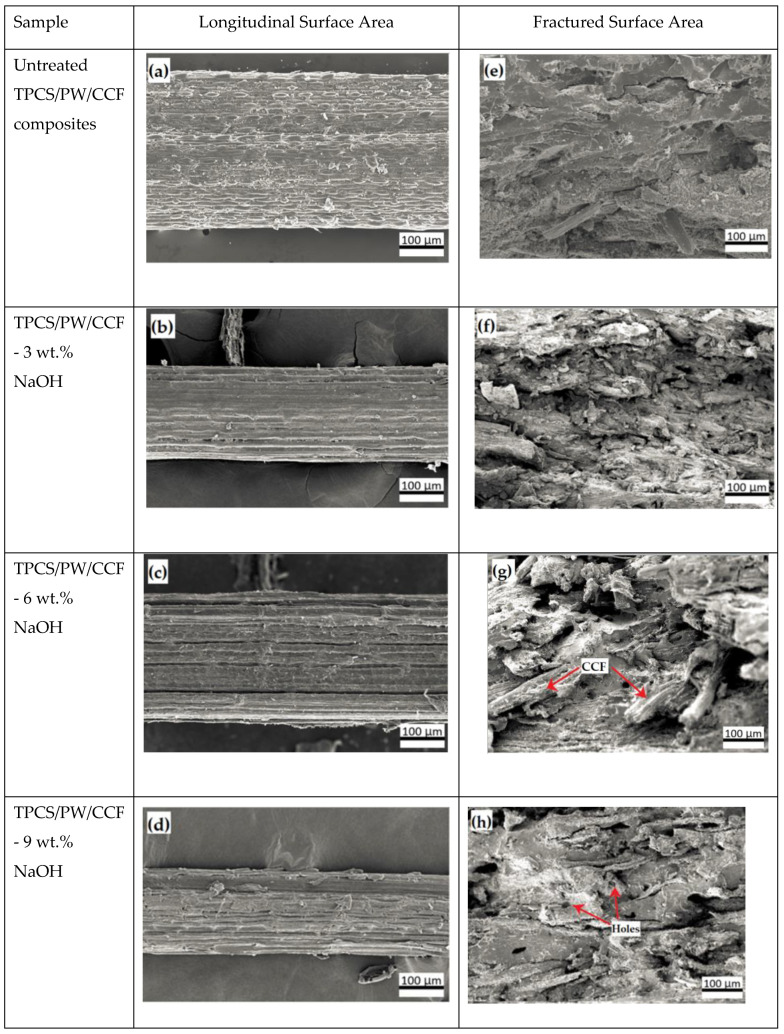
Figure 2
SEM images of untreated and treated TPCS/PW/CCF biocomposites from longitudinal surface and fractured surface views.
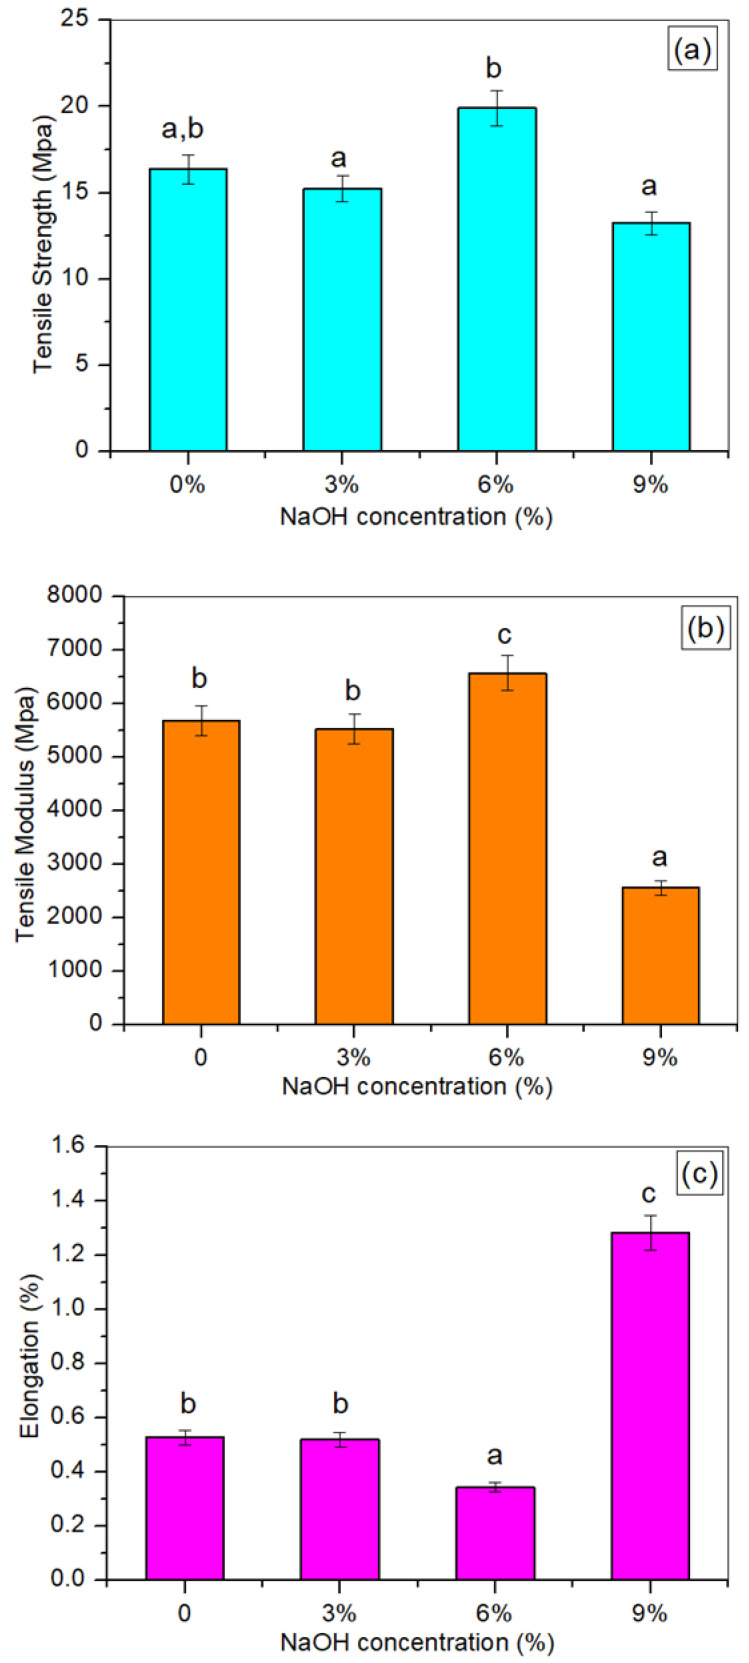
Figure 3
The ( a ) tensile strength, ( b ) tensile modulus, and ( c ) elongation at break of untreated and treated TPCS/PW/CCF composites at different NaOH concentrations. Letters a, b, and c is indicates the ...
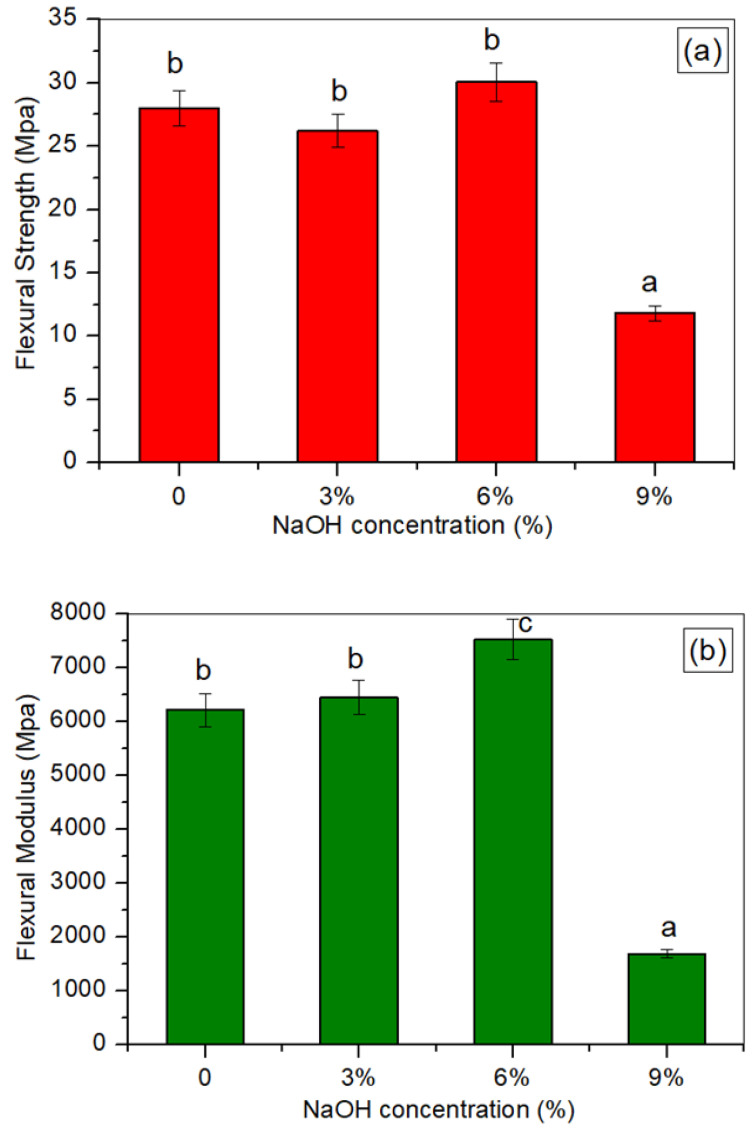
Figure 4
The ( a ) flexural strength, and ( b ) flexural modulus of untreated and treated TPCS/PW/CCF composites at different NaOH concentrations. Letters a, b, and c is indicates the group of data for statist...
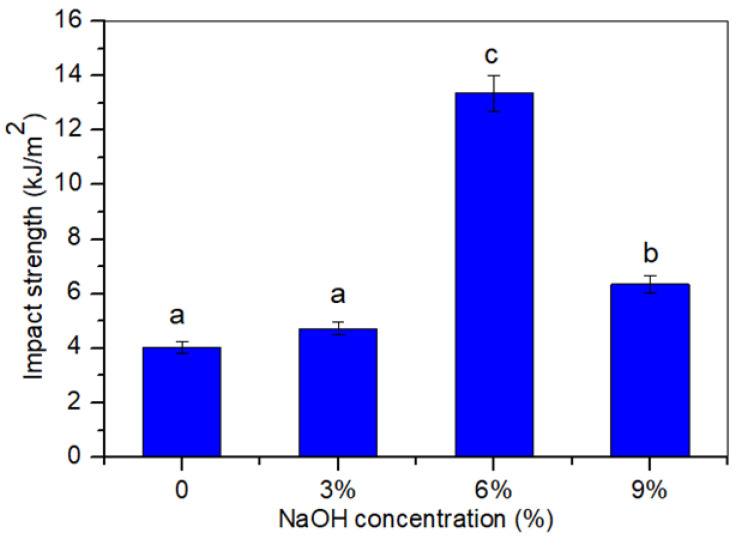
Figure 5
Impact strength of untreated and treated TPCS/PW/CCF composites at different NaOH concentrations. Letters a, b, and c is indicates the group of data for statistical analysis.
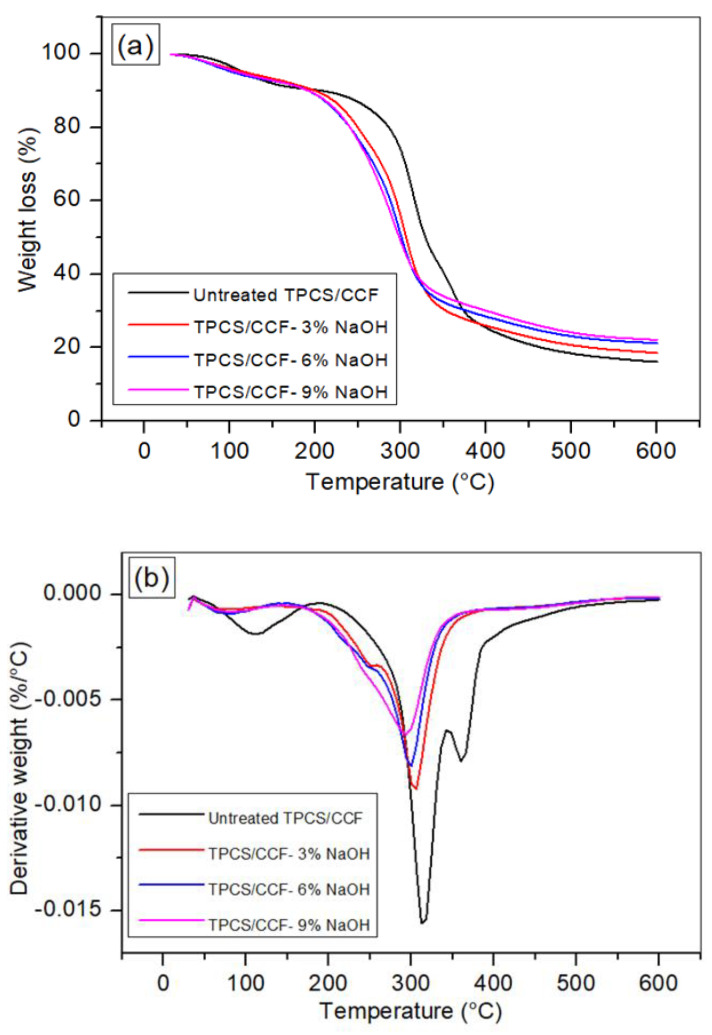
Figure 6
( a ) TGA and ( b ) DTG of the untreated and NaOH-treated TPCS/PW/CCF composites.
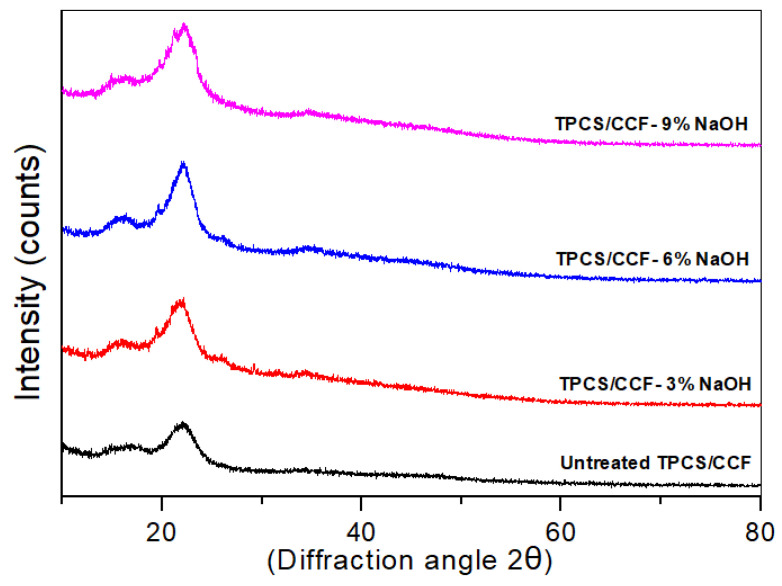
Figure 7
X-ray diffraction spectra of the untreated and treated TPCS/PW/CCF composites.
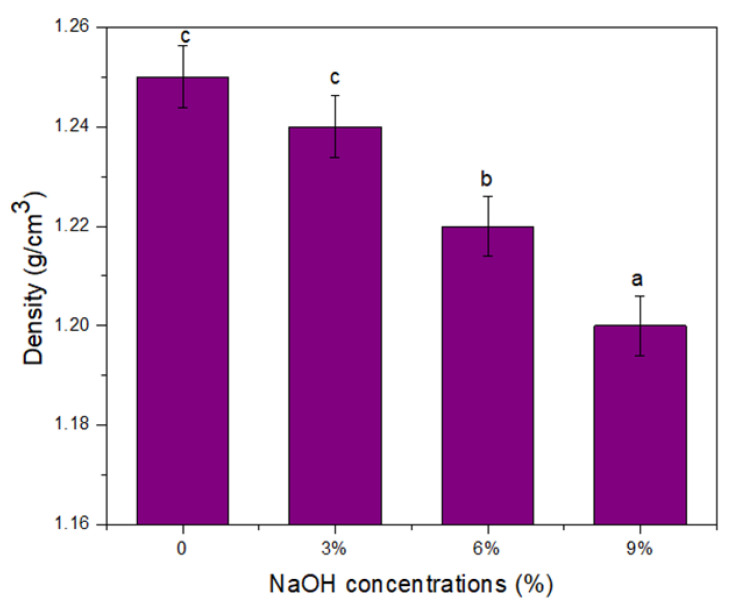
Figure 8
Density of untreated and treated TPCS/PW/CCF composites. Letters a, b, and c is indicates the group of data for statistical analysis.
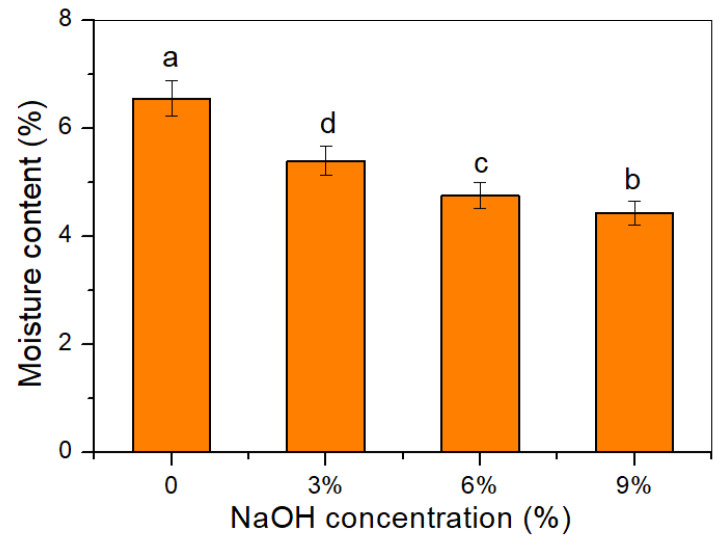
Figure 9
Moisture content of untreated and treated TPCS/PW/CCF composites. Letters a, b, c and d is indicates the group of data for statistical analysis.
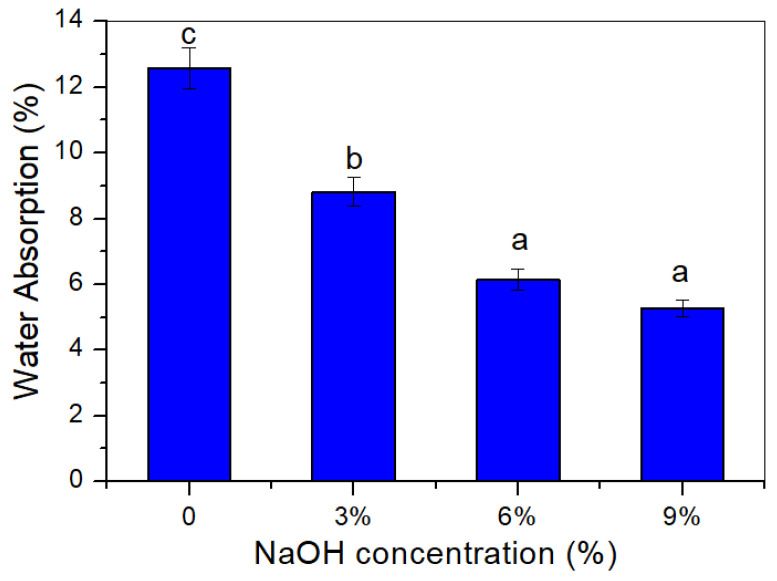
Figure 10
Water absorption of untreated and treated TPCS/PW/CCF composites. Letters a, b, and c is indicates the group of data for statistical analysis.
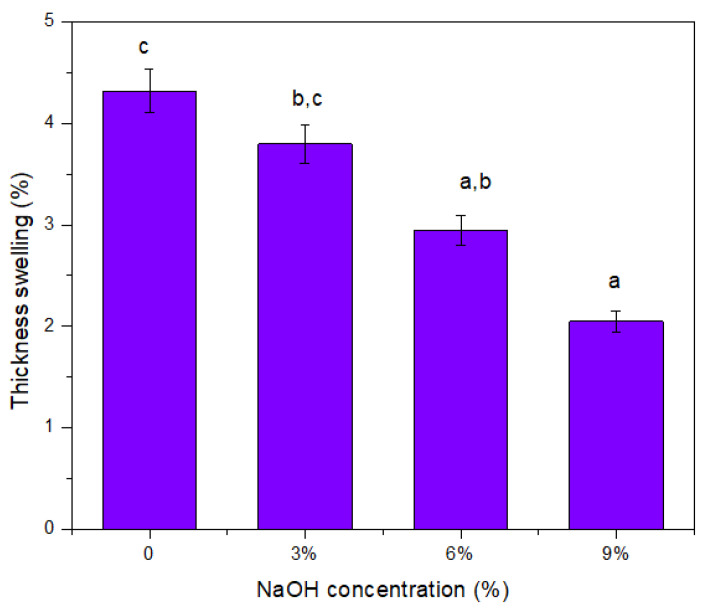
Figure 11
Thickness swelling of untreated and treated TPCS/PW/CCF composites. Letters a, b, and c is indicates the group of data for statistical analysis.
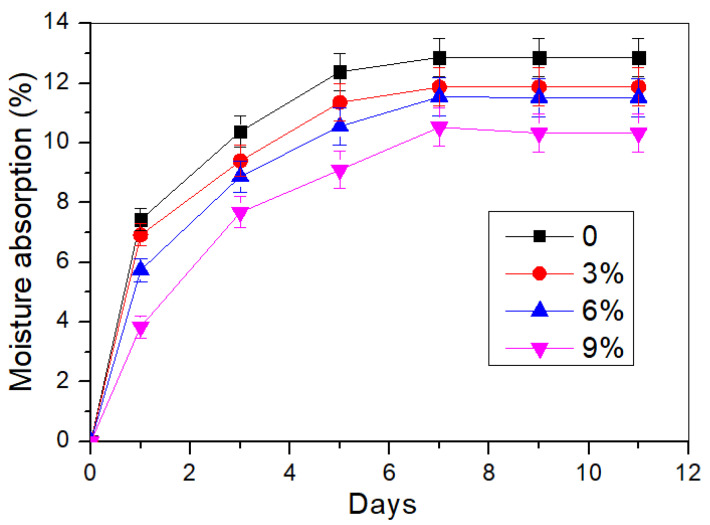
Figure 12
Moisture absorption of untreated and treated TPCS/PW/CCF composites.
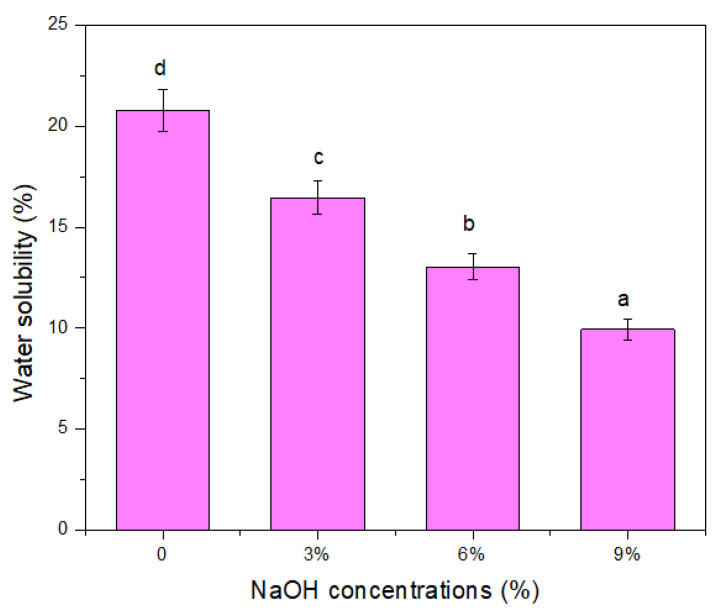
Figure 13
Water solubility of untreated and treated TPCS/PW/CCF composites. Letters a, b, c and d is indicates the group of data for statistical analysis.
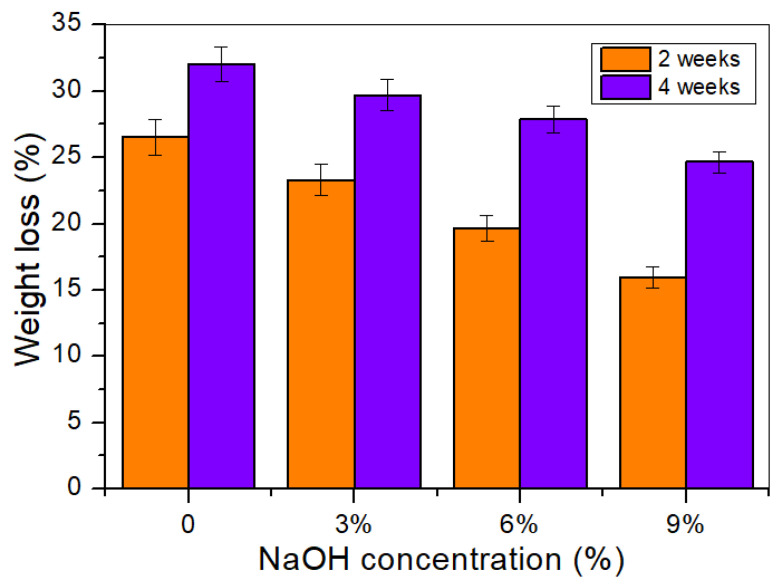
Figure 14
Weight loss of untreated and treated TPCS/PW/CCF composites after soil burial for two and four weeks.
Figure images are served from the NIH/NLM PubMed Central Open Access Subset or Europe PMC; copyright remains with the publishers and authors.
💬 Discussion
0 commentsNo comments yet. Be the first to start a discussion!
Leave a Comment