Abstract
Bacteria occupy a diverse set of environmental niches with differing oxygen availability. Anaerobic environments such as mammalian digestive tracts and industrial reactors harbor an abundance of both obligate and facultative anaerobes, many of which play significant roles in human health and biomanufacturing. Studying bacterial function under partial or fully anaerobic conditions, however, is challenging given the paucity of suitable live-cell imaging tools. Here, we introduce a series of RNA-based fluorescent biosensors that respond selectively to cyclic di-GMP, an intracellular bacterial second messenger that controls cellular motility and biofilm formation. We demonstrate the utility of these biosensors in vivo under both aerobic and anaerobic conditions, and we show that biosensor expression does not interfere with the native motility phenotype. Together, our results attest to the effectiveness and versatility of RNA-based fluorescent biosensors, priming further development and application of these and other analogous sensors to study host-microbial and microbial-microbial interactions through small molecule signals.
🔬 Techniques
🧬 Organisms
💻 Software
✨ Fluorophores
🧪 Sample Preparation
🔬 Cell Lines
🏭 Microscope Brands
🧪 Reagent Suppliers
🎨 Filters
💻 Software Details
🏛️ Research Organizations (ROR)
Affiliated research institutions:
📋 Methods
General reagents and oligonucleotides Cyclic dinucleotides used in this study were purchased from Axxorra, LLC (Farmingdale, NY, USA). DFHBI and DFHBI-1T were synthesized as previously described ( 14 , 15 ) and stored as a ∼30 mM stock in DMSO. All GEMM-I-Spinach DNA oligonucleotides were purchased from Integrated DNA Technologies (IDT, Coralville, IA, USA), while other oligonucleotides were purchased from Elim Biopharmaceuticals (Hayward, CA, USA). All oligos are listed in Supplementary Table S1. Bioinformatic analysis of GEMM-I variants The GEMM-I riboswitch aptamer variants employed in the phylogenetic screen were selected as previously described ( 17 ). Briefly, sequences were extracted from Rfam database (accession RF01051, http://rfam.xfam.org/ , 27 ) and were ranked, sorted and selected with respect to various criteria including but not limited to: folding stabilization energies, presence of specific c-di-GMP binding pocket residues, host organism and source, evolutionary position, tractability of the P1 stem, and downstream genes. The phylogenetic sequences themselves are listed in Supplementary Table S2, while the Spinach flanking sequences Supplementary Table S3.
Molecular cloning
For in vivo expression, biosensors were flanked by a tRNA scaffold and cloned into the BglII and XhoI sites of pET31b(+) as previously described ( 16 , 17 , 28 ) using the tSp2- and p31b- primers listed in Supplementary Table S3. YhjH was amplified from E. coli BL21 Star genomic DNA, and its sequence and WspR alleles ( 16 ) were cloned into the NdeI and XhoI sites of pCOLADUET-1. The two plasmids encoding the biosensor and enzyme were co-transformed into E. coli BL21 (DE3) Star cells (Life Technologies). For motility assay experiments, the Ct biosensor and enzymes were cloned into pETDuet-1 via Gibson assembly for dual expression from a single plasmid. The T7promoter-tRNA-Ct-terminator fragment was amplified from the pET31b vector constructs using dSens-primers (Supplementary Table S3), while T7promoter–enzyme fragments were amplified from the pCOLADuet constructs with the dWspR- and dYhjH- primers. The vector was a fragment of the pETDuet-1 vector cut at the NdeI and XhoI positions, and the three pieces were assembled with the Gibson Assembly Master Mix (New England Biolabs, Ipswich, MA, USA). Fluorescent proteins were cloned into pET31b(+). GFP-LVA has a LVA degradation tag at the C-terminal end and was a gift from the Guillemin Lab at the University of Oregon (Eugene, OR, USA); the protein was cloned into pET31b(+) between the NdeI and XhoI restriction sites. The iLov sequence ( 6 ) was ordered as a gBlock from IDT (Coralville, IA, USA) and cloned into pET31b(+) between the NdeI and SalI restriction sites. In vitro fluorescence assays All biosensor and Spinach RNAs used for in vitro fluorescence activation assays were prepared as previously described ( 29 ). Briefly, DNA templates were first amplified with the appropriate Spinach or Spinach2 primer pairs. Transcriptions were performed using T7 RNA polymerase and the RNA product purified by a denaturing (7.5 M urea) 6% PAGE gel. RNA was eluted from the gel, precipitated, dried and resuspended in water. Accurate RNA quantitation was obtained by thermal hydrolysis ( 30 ). Fluorescence activation assays were performed as previously described ( 16 , 17 , 28 ). Briefly, each reaction consisted of RNA, ligand and DFHBI in a binding buffer consisting of 40 mM HEPES, 125 mM KCl and 3 or 10 mM MgCl 2 at pH 7.5. RNA was refolded in binding buffer before being added to the binding reaction. The reaction plate was incubated at the appropriate temperature and fluorescent measurements were taken on a SpectraMax Paradigm plate reader (Molecular Devices) at 448 nm excitation/506 nm emission. Reported fluorescence values are for reactions that have reached equilibrium, as defined by fluorescence level stabilization over time. For ligand selectivity experiments, fluorescence values were normalized to biosensor with c-di-GMP. For DFHBI titration experiments, fluorescence values were background-subtracted, with background defined as fluorescence of buffer, ligand and DFHBI without RNA. All other values are reported in raw form. In vitro fluorescence turn-on kinetics For kinetics experiments, a reaction containing 10 μM DFHBI and 50 μM c-di-GMP in binding buffer was pre-incubated in the dark to 30 °C. RNA was refolded in binding buffer and pre-incubated separately to the same temperature. Fluorescence measurements were taken every 15 s as described above, starting immediately after the addition of RNA to the reaction mixture. There was an approximate dead time of 15 s between RNA addition and the first fluorescence reading. Fluorescence values were then normalized against maximum fluorescence exhibited for each biosensor.
Show full methods section
General reagents and oligonucleotides Cyclic dinucleotides used in this study were purchased from Axxorra, LLC (Farmingdale, NY, USA). DFHBI and DFHBI-1T were synthesized as previously described ( 14 , 15 ) and stored as a ∼30 mM stock in DMSO. All GEMM-I-Spinach DNA oligonucleotides were purchased from Integrated DNA Technologies (IDT, Coralville, IA, USA), while other oligonucleotides were purchased from Elim Biopharmaceuticals (Hayward, CA, USA). All oligos are listed in Supplementary Table S1. Bioinformatic analysis of GEMM-I variants The GEMM-I riboswitch aptamer variants employed in the phylogenetic screen were selected as previously described ( 17 ). Briefly, sequences were extracted from Rfam database (accession RF01051, http://rfam.xfam.org/ , 27 ) and were ranked, sorted and selected with respect to various criteria including but not limited to: folding stabilization energies, presence of specific c-di-GMP binding pocket residues, host organism and source, evolutionary position, tractability of the P1 stem, and downstream genes. The phylogenetic sequences themselves are listed in Supplementary Table S2, while the Spinach flanking sequences Supplementary Table S3.
Molecular cloning
For in vivo expression, biosensors were flanked by a tRNA scaffold and cloned into the BglII and XhoI sites of pET31b(+) as previously described ( 16 , 17 , 28 ) using the tSp2- and p31b- primers listed in Supplementary Table S3. YhjH was amplified from E. coli BL21 Star genomic DNA, and its sequence and WspR alleles ( 16 ) were cloned into the NdeI and XhoI sites of pCOLADUET-1. The two plasmids encoding the biosensor and enzyme were co-transformed into E. coli BL21 (DE3) Star cells (Life Technologies). For motility assay experiments, the Ct biosensor and enzymes were cloned into pETDuet-1 via Gibson assembly for dual expression from a single plasmid. The T7promoter-tRNA-Ct-terminator fragment was amplified from the pET31b vector constructs using dSens-primers (Supplementary Table S3), while T7promoter–enzyme fragments were amplified from the pCOLADuet constructs with the dWspR- and dYhjH- primers. The vector was a fragment of the pETDuet-1 vector cut at the NdeI and XhoI positions, and the three pieces were assembled with the Gibson Assembly Master Mix (New England Biolabs, Ipswich, MA, USA). Fluorescent proteins were cloned into pET31b(+). GFP-LVA has a LVA degradation tag at the C-terminal end and was a gift from the Guillemin Lab at the University of Oregon (Eugene, OR, USA); the protein was cloned into pET31b(+) between the NdeI and XhoI restriction sites. The iLov sequence ( 6 ) was ordered as a gBlock from IDT (Coralville, IA, USA) and cloned into pET31b(+) between the NdeI and SalI restriction sites. In vitro fluorescence assays All biosensor and Spinach RNAs used for in vitro fluorescence activation assays were prepared as previously described ( 29 ). Briefly, DNA templates were first amplified with the appropriate Spinach or Spinach2 primer pairs. Transcriptions were performed using T7 RNA polymerase and the RNA product purified by a denaturing (7.5 M urea) 6% PAGE gel. RNA was eluted from the gel, precipitated, dried and resuspended in water. Accurate RNA quantitation was obtained by thermal hydrolysis ( 30 ). Fluorescence activation assays were performed as previously described ( 16 , 17 , 28 ). Briefly, each reaction consisted of RNA, ligand and DFHBI in a binding buffer consisting of 40 mM HEPES, 125 mM KCl and 3 or 10 mM MgCl 2 at pH 7.5. RNA was refolded in binding buffer before being added to the binding reaction. The reaction plate was incubated at the appropriate temperature and fluorescent measurements were taken on a SpectraMax Paradigm plate reader (Molecular Devices) at 448 nm excitation/506 nm emission. Reported fluorescence values are for reactions that have reached equilibrium, as defined by fluorescence level stabilization over time. For ligand selectivity experiments, fluorescence values were normalized to biosensor with c-di-GMP. For DFHBI titration experiments, fluorescence values were background-subtracted, with background defined as fluorescence of buffer, ligand and DFHBI without RNA. All other values are reported in raw form. In vitro fluorescence turn-on kinetics For kinetics experiments, a reaction containing 10 μM DFHBI and 50 μM c-di-GMP in binding buffer was pre-incubated in the dark to 30 °C. RNA was refolded in binding buffer and pre-incubated separately to the same temperature. Fluorescence measurements were taken every 15 s as described above, starting immediately after the addition of RNA to the reaction mixture. There was an approximate dead time of 15 s between RNA addition and the first fluorescence reading. Fluorescence values were then normalized against maximum fluorescence exhibited for each biosensor.
Flow cytometry analysis of in vivo fluorescence
Flow cytometry experiments were carried out as previously described ( 17 ). Briefly, fresh LB/Carb/Kan cultures were started from overnight cultures, and cells were grown to an OD 600 ∼0.3 and biosensor and enzyme expression was induced with 1 mM IPTG at 37 °C for 3 h. Cells were then diluted 1:30 in 1x PBS containing 50 μM DFHBI and fluorescence was measured for at least 10 000 events using a BD Fortessa X20 flow cytometer equipped with a 488 nM laser and a 530/30 filter in the Flow Cytometry Core Facility at the University of California at Berkeley. Data were analyzed with FlowJo (version 10.0.7). Flow cytometry analysis (anaerobic growth and oxygen recovery) Anaerobic cultures were grown in Balch tubes in ZYP-5052 autoinduction media ( 31 ) supplemented with Carb/Kan. Cultures were inoculated aerobically and the tubes were capped with a chlorobutyl rubber stopper and crimped with an aluminum seal. The headspace was then sparged with argon for >15 min to ensure anaerobic conditions. Cells were grown while shaking for ∼15 h at 37 °C until cells reached an OD 600 > 3. Each tube was then individually opened and the cultures immediately diluted 1:70 into 70 μl of 1x PBS pH 7.5 with 100 μM DFHBI-1T and fluorescence of 50 000 events analyzed on an Attune NxT flow cytometer (Life Technologies) equipped with a 488 nm laser for excitation and 515/15 filter for emission. For oxygen recovery, cultures were briefly agitated after breaking the anaerobic seal, then placed at 4 °C, loosely capped, for 2 h before taking an identical fluorescence measurement in the flow cytometer. Data were analyzed with FlowJo (version 10.0.7).
Motility assays
Escherichia coli MG1655 cells were transformed with constructs by electroporation and grown overnight in liquid culture. Following published protocols ( 32 ), culture densities were adjusted to OD 600 = 4 and 3 μl of culture was spotted onto agar plates containing 0.5% tryptone, 0.5% NaCl, 0.3% agar and 20 μM IPTG. Plates were allowed to air dry at room temperature for 30 min before being inverted and placed at 28 °C for 15 h. Plate images were analyzed with ImageJ (NIH, Bethesda, MD, USA).
📊 Figures
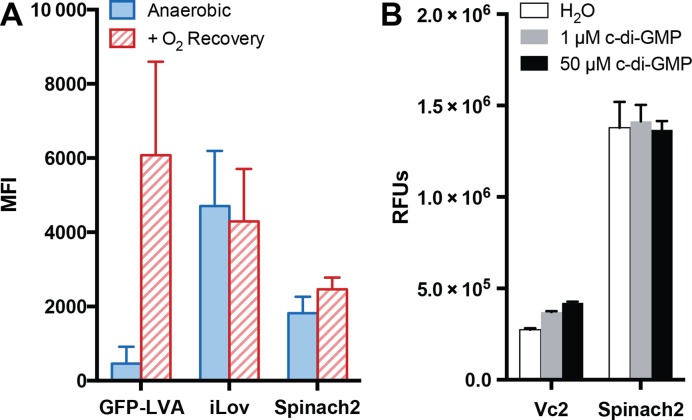
Figure 1.
Fluorescence under anaerobic growth and oxygen recovery. ( A ) Average mean fluorescence intensity (MFI) measured by flow cytometry of E. coli BL21 (DE3) Star cells expressing GFP-LVA, iLOV or Spinach...
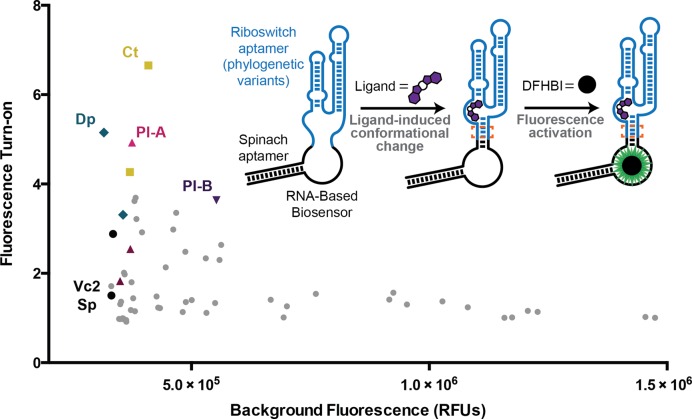
Figure 2.
Screens identify four second-generation biosensors for cyclic di-GMP. Select data from the original GEMM-I-Spinach phylogenetic screen (Supplementary Figure S2) plotted with respect to background fluo...
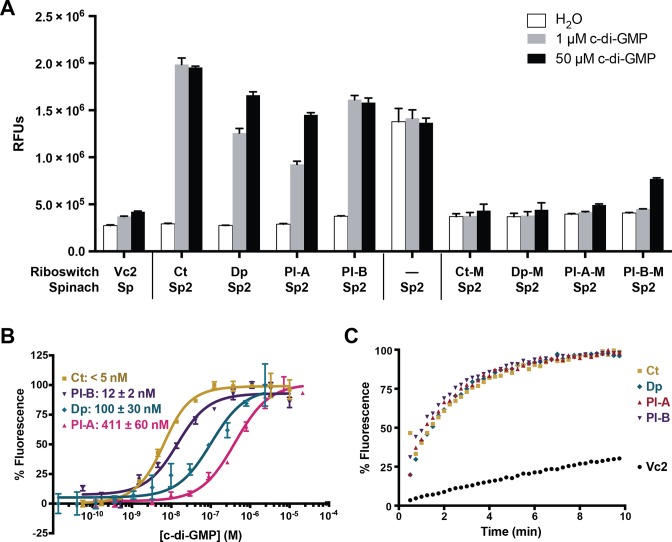
Figure 3.
In vitro characteristics of second-generation biosensors. ( A ) Fluorescence activation of different biosensors constructs and Spinach2, with 0, 1 u03bcM and 50 u03bcM c-di-GMP. Data are from 3 indepe...
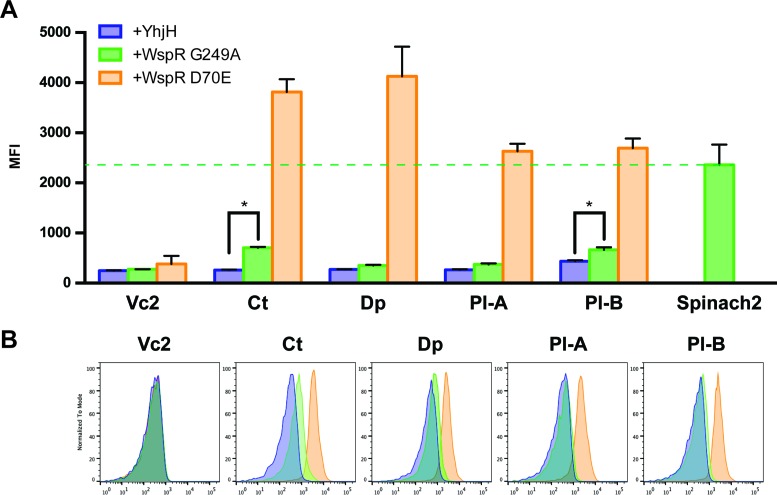
Figure 4.
Second-generation biosensors are brighter than Spinach2 in vivo . ( A ) Average mean fluorescence intensity (MFI) measured by flow cytometry of E. coli BL21 (DE3) Star cells co-expressing indicated bi...
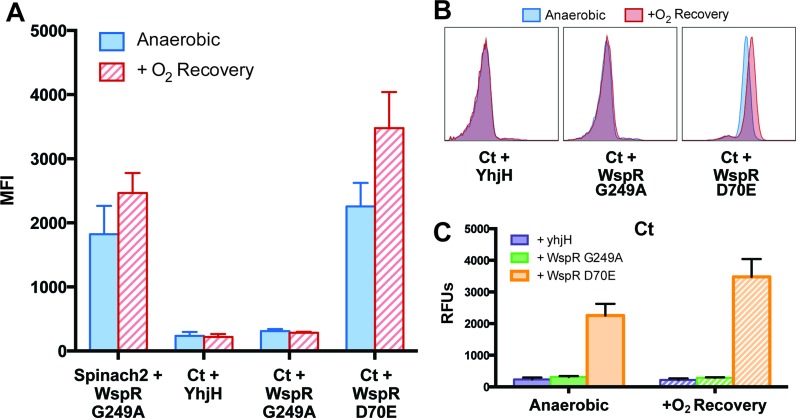
Figure 5.
Cyclic di-GMP biosensors function under anaerobic conditions. ( A ) Average MFI measured by flow cytometry of E. coli BL21 (DE3) Star cells co-expressing Spinach2 or Ct, along with various c-di-GMP pe...
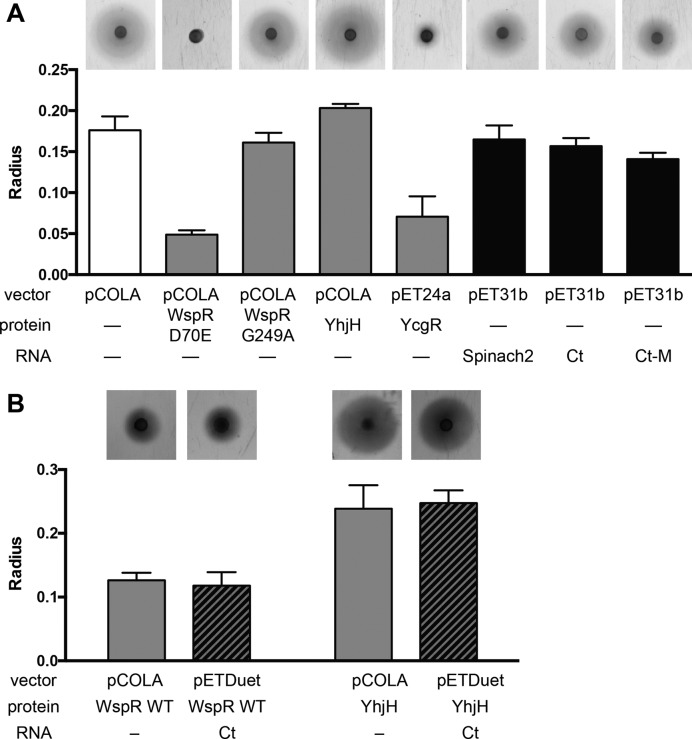
Figure 6.
Biosensor expression does not disrupt motility phenotype. ( A ) Representative photos of motility zones for E. coli MG1655 cells in soft agar are shown above the analysis graph of the calculated radii...
Figure images are served from the NIH/NLM PubMed Central Open Access Subset or Europe PMC; copyright remains with the publishers and authors.
💬 Discussion
0 commentsNo comments yet. Be the first to start a discussion!
Leave a Comment