Abstract
AbstractGrain boundaries have a major effect on the physical properties of two-dimensional layered materials. Therefore, it is important to develop simple, fast and sensitive characterization methods to visualize grain boundaries. Conventional Raman and photoluminescence methods have been used for detecting grain boundaries; however, these techniques are better suited for detection of grain boundaries with a large crystal axis rotation between neighbouring grains. Here we show rapid visualization of grain boundaries in chemical vapour deposited monolayer MoS2 samples with multiphoton microscopy. In contrast to Raman and photoluminescence imaging, third-harmonic generation microscopy provides excellent sensitivity and high speed for grain boundary visualization regardless of the degree of crystal axis rotation. We find that the contrast associated with grain boundaries in the third-harmonic imaging is considerably enhanced by the solvents commonly used in the transfer process of two-dimensional materials. Our results demonstrate that multiphoton imaging can be used for fast and sensitive characterization of two-dimensional materials.
🔬 Techniques
🔭 Microscopes
🧪 Sample Preparation
🏭 Microscope Brands
📷 Detectors
🏛️ Research Organizations (ROR)
Affiliated research institutions:
📋 Methods
CVD growth of MoS 2 Monolayer MoS 2 crystals were grown by an atmospheric pressure thermal CVD method. A horizontal tube furnace with 1 inch-diameter quartz tube was used. MoO 3 powder (30 mg) was placed in a ceramic boat and the SiO 2 /Si substrate was faced down and mounted on top of the boat. A separate ceramic boat with sulfur powder (50 mg) was placed next to the MoO 3 powder in an upstream position. During the synthesis of MoS 2 crystals, the reaction chamber was heated to 700 °C in 50 s.c.c.m. Ar and kept there for 5 min for MoS 2 crystal growth. The fabricated flakes are then transferred on another SiO 2 /Si substrate using PMMA. The PMMA is then removed by a 30 min ACE treatment followed by a 5 min IPA treatment (ACE+IPA treatment).
Multiphoton microscopy
The nonlinear optical properties of the CVD-grown MoS 2 samples were investigated using a multiphoton microscope, described in more detail in the Supplementary Note 5 and shown schematically in Supplementary Fig. 5 . The design of the microscope and the experimental procedure were previously reported 40 41 42 . The laser beam is scanned with a 2D galvo mirror system and focused on the sample using a × 20 microscope objective with numerical aperture of 0.5. The focal spot size, measured by nonlinear razor blade method, is ∼1.8 μm. Two different mode-locked erbium-doped fiber lasers operating at a central wavelength of 1,560 nm can be used as a light source in the system. The lasers have different repetition rates and thus produce different peak powers. For the lower peak power laser, the maximum average power on the sample is 30 mW with a repetition rate of ∼50 MHz and ∼150 fs pulse duration at the sample surface, yielding an estimated pulse peak power of ∼4 kW, pulse energy of 0.6 nJ and fluence of 22 mJ cm −2 . The lower peak power laser was used for Figs 1a,b and 2a–c,e . The parameters of the higher peak power laser are: 38 mW, 8 MHz, 100 fs, 47 kW, 4.8 nJ and 177 mJ cm −2 . The higher peak power laser was used for Fig. 1c,d,e . The backscattered SHG and THG signals generated from each point on the sample are guided to the detection arm by an 870 nm dichroic mirror and split into two paths using a long-pass dichroic mirror (cutoff at 562 nm) and finally detected using photomultiplier tubes. Narrow band-pass filters are used to select SHG and THG signals at central wavelengths of 780 and 520 nm, respectively. The acquisition of the two channels is simultaneous, making the measurement conditions for both channels exactly identical regardless of any perturbations (external vibrations or fluctuations in laser power). For resolving the light spectrum, the generated light is guided to a spectrometer (OceanOptics QE PRO-FL) by rotating the 870 nm dichroic mirror. A polarizer can be added to the setup before the microscope objective yielding parallel-polarized excitation and generated light.
Show full methods section
CVD growth of MoS 2 Monolayer MoS 2 crystals were grown by an atmospheric pressure thermal CVD method. A horizontal tube furnace with 1 inch-diameter quartz tube was used. MoO 3 powder (30 mg) was placed in a ceramic boat and the SiO 2 /Si substrate was faced down and mounted on top of the boat. A separate ceramic boat with sulfur powder (50 mg) was placed next to the MoO 3 powder in an upstream position. During the synthesis of MoS 2 crystals, the reaction chamber was heated to 700 °C in 50 s.c.c.m. Ar and kept there for 5 min for MoS 2 crystal growth. The fabricated flakes are then transferred on another SiO 2 /Si substrate using PMMA. The PMMA is then removed by a 30 min ACE treatment followed by a 5 min IPA treatment (ACE+IPA treatment).
Multiphoton microscopy
The nonlinear optical properties of the CVD-grown MoS 2 samples were investigated using a multiphoton microscope, described in more detail in the Supplementary Note 5 and shown schematically in Supplementary Fig. 5 . The design of the microscope and the experimental procedure were previously reported 40 41 42 . The laser beam is scanned with a 2D galvo mirror system and focused on the sample using a × 20 microscope objective with numerical aperture of 0.5. The focal spot size, measured by nonlinear razor blade method, is ∼1.8 μm. Two different mode-locked erbium-doped fiber lasers operating at a central wavelength of 1,560 nm can be used as a light source in the system. The lasers have different repetition rates and thus produce different peak powers. For the lower peak power laser, the maximum average power on the sample is 30 mW with a repetition rate of ∼50 MHz and ∼150 fs pulse duration at the sample surface, yielding an estimated pulse peak power of ∼4 kW, pulse energy of 0.6 nJ and fluence of 22 mJ cm −2 . The lower peak power laser was used for Figs 1a,b and 2a–c,e . The parameters of the higher peak power laser are: 38 mW, 8 MHz, 100 fs, 47 kW, 4.8 nJ and 177 mJ cm −2 . The higher peak power laser was used for Fig. 1c,d,e . The backscattered SHG and THG signals generated from each point on the sample are guided to the detection arm by an 870 nm dichroic mirror and split into two paths using a long-pass dichroic mirror (cutoff at 562 nm) and finally detected using photomultiplier tubes. Narrow band-pass filters are used to select SHG and THG signals at central wavelengths of 780 and 520 nm, respectively. The acquisition of the two channels is simultaneous, making the measurement conditions for both channels exactly identical regardless of any perturbations (external vibrations or fluctuations in laser power). For resolving the light spectrum, the generated light is guided to a spectrometer (OceanOptics QE PRO-FL) by rotating the 870 nm dichroic mirror. A polarizer can be added to the setup before the microscope objective yielding parallel-polarized excitation and generated light.
SHG and THG microscopy simulations
Numerical simulations of the multiphoton microscopy were performed using an approach based on free-space Green's functions and Rayleigh–Gans approximation 43 . The symmetry of the MoS 2 flakes on glass substrate was assumed to belong to D 3h point group as previously reported 14 . Therefore, for the THG process the non-zero and independent susceptibility components reduce to zzzz , xxyy , xxzz and zzxx , where x and y point along the flake surface (as shown in Fig. 2b ) and z is perpendicular to the surface 30 . For SHG process, there is only one independent component yyy 14 30 . The model MoS 2 flake was constructed to consist of four grains with varying crystal orientations similar to the flake shown in Fig. 2b . Using polarized SHG optical images (see details in the Supplementary Note 2 and in Supplementary Fig. 2 ), the crystal orientations were estimated to be 38.8°, 38°, 6.7° and 7.1° for the grains B2, B1, A2 and A1, respectively, where a 0 (90)° would point along the x direction ( y direction). An example numerical SHG microscopy image is shown in Fig. 2f where the total collected SHG image clearly shows only the GB1 where the crystal orientation difference is largest. When an analyser is parallel to the linear polarization of the input beam, clear dependence of the SHG signal on the grains crystal orientations is found (see Fig. 2g ). An example numerical THG image without using any analyser is shown in Fig. 1h . To account for the effect of having adsorbed molecules on the GBs for THG, the third-order nonlinearity coefficient was increased by 10% on the GBs. This order-of-magnitude increase was estimated by using known literature values for the macroscopic third-order susceptibility χ (3) ∼10 −19 m 2 V −2 (ref. 22 ) and estimating the atomic number density of the MoS 2 monolayer to be ∼3 × 10 30 m −3 (ref. 44 ). The second-order hyperpolarizability was then calculated to be ∼3.33 × 10 −49 m 5 V −2 . For simplicity, we next assumed that the adsorbed molecules were ACE molecules, but similar order-of-magnitude estimates could similarly be reached for other molecules. The second-order hyperpolarizability values for ACE and for other small molecules can be reasonably well estimated using the bond-charge model 30 . When the effects of bond orientations on the resulting hyperpolarizability are neglected, we calculate a hyperpolarizability value of ∼3 × 10 −50 m 5 V −2 for ACE. Therefore, the 10 % increase of the effective macroscopic third-order susceptibility of the MoS 2 monolayer due to adsorbed ACE molecules per MoS 2 unit cell is a reasonable order-of-magnitude estimation. This increase also agrees with our experimental finding.
Raman and PL characterization
Raman and PL spectra were acquired by a Witec micro-Raman spectrometer equipped with 1,800 and 600 lines per mm gratings, respectively, and excited with a Nd:YAG laser emitting at 532 nm. The power on the sample was approximately 0.1 mW for PL and Raman measurements. Scattered light was collected through a × 100 objective. The Raman and PL intensity and peak positions were acquired by Gaussian fitting.
Data availability
The data that support the findings of this study are available from the corresponding author upon reasonable request.
Supplementary Material Supplementary Information Supplementary Figures, Supplementary Notes and Supplementary References Supplementary Movie 1 Changes in the intensity of SHG with alternating polarization direction. The excitation is at 1040 nm and the excitation and detection are parallel-polarized. The crystal orientations shown in Fig. 2b are obtained from this data. The SHG signal intensities with altering polarization from different grains are also shown in the Supplementary Fig. 2b. Supplementary Movie 2 A movie created from a series of SHG images with parallel polarized excitation-detection. Each frame corresponds to different polarization of the excitation beam. The intensity differences between grains with differing crystal orientations can be clearly seen. Snapshots from this movie can be seen in Supplementary Fig. 1.
📊 Figures
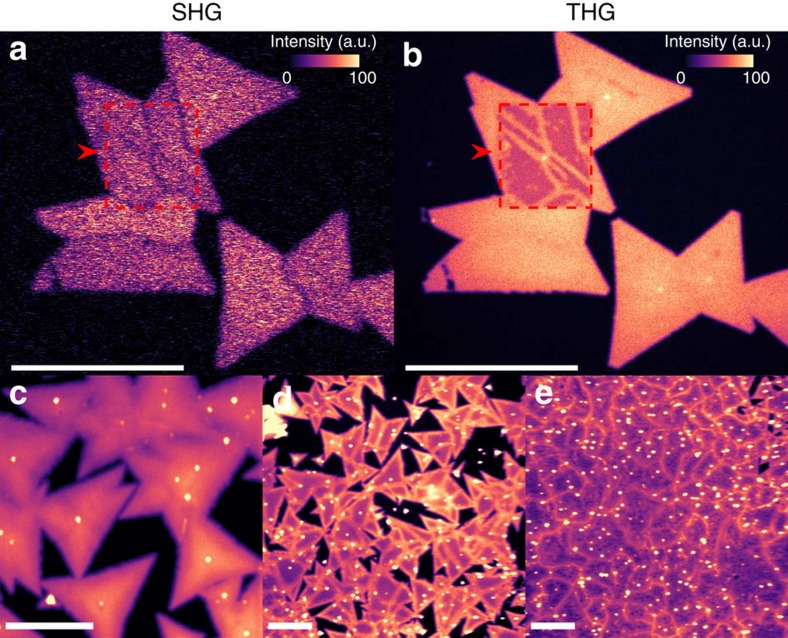
Figure 1
Multiphoton imaging of CVD-grown large-area MoS 2 flakes.
( a ) SHG and ( b ) THG images of Sample 1. An area of u223c25 u00d7 30u2009u03bcm 2 is first exposed (marked by a red dashed border) by scanning over it with the same laser used for the multiphoton l...
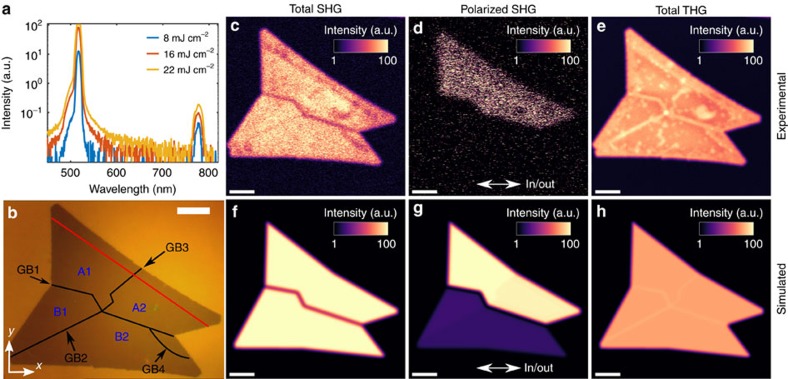
Figure 2
Multiphoton characterization results.
( a ) Generated multiphoton spectra with different input fluences, ( b ) optical image with marked grains (A1, A2, B1 and B2) and grain boundaries (GB1, GB2, GB3 and GB4), ( c ) experimental SHG image...
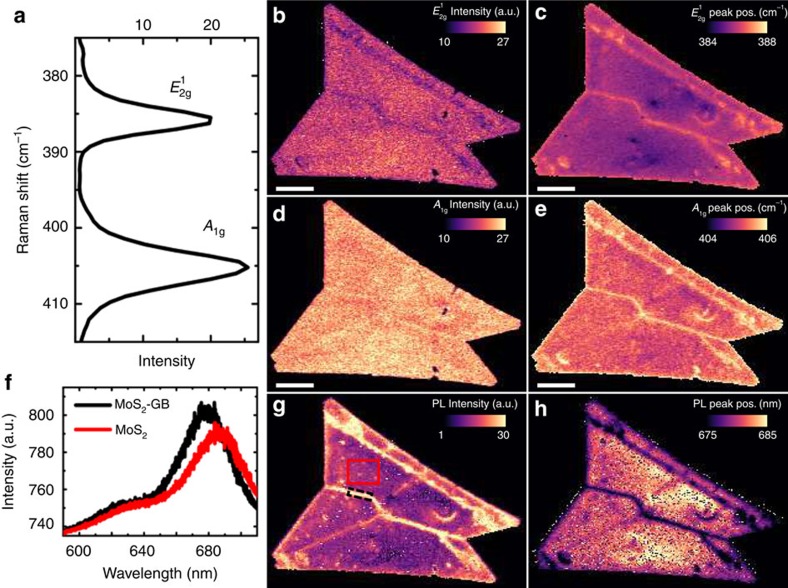
Figure 3
Raman and photoluminescence characterization.
( a ) Raman spectrum, ( b ) intensity of peak, ( c ) centre position of peak, ( d ) intensity of A 1g peak and ( e ) centre position of A 1g peak, ( f ) PL spectra from the middle of the grain A1 (red...
Figure images are served from the NIH/NLM PubMed Central Open Access Subset or Europe PMC; copyright remains with the publishers and authors.
💬 Discussion
0 commentsNo comments yet. Be the first to start a discussion!
Leave a Comment