Abstract
Efficient optical clearance is fundamental for whole brain imaging. In particular, clearance of the brain without membrane damage is required for the imaging of lipophilic tracer-labeled neural tracts. Relying on an ascending gradient of fructose solutions, SeeDB can achieve sufficient transparency of the mouse brain while ensuring that the plasma membrane remains intact. However, it is challenging to extend this method to larger mammalian brains due to the extremely high viscosity of the saturated fructose solution. Here we report a SeeDB-derived optical clearing method, termed FRUIT, which utilizes a cocktail of fructose and urea. As demonstrated in the adult mouse brain, combination of these two highly water-soluble clearing agents exerts a synergistic effect on clearance. More importantly, the final FRUIT solution has low viscosity so as to produce transparency of the whole adult rabbit brain via arterial perfusion, which is impossible to achieve with a saturated fructose solution. In addition to good compatibility with enhanced yellow fluorescent protein, the cocktail also preserves the fluorescence of the lipophilic tracer DiI. This work provides a volume-independent optical clearing method which retains the advantages of SeeDB, particularly compatibility with lipophilic tracers.
🔬 Techniques
🔭 Microscopes
💻 Software
✨ Fluorophores
🧪 Sample Preparation
🏭 Microscope Brands
🧪 Reagent Suppliers
💻 Software Details
🏛️ Research Organizations (ROR)
Affiliated research institutions:
📋 Methods
Makeup of the cocktail To develop a clearing method which overcomes the limitations of SeeDB while retaining its advantages, we sought to make a cocktail comprising fructose and other available clearing agents which had been subject to careful verification and demonstrated satisfactory performance using adult mouse brain samples. The candidates were determined based on two principles. First, they needed to be compatible with the fluorescent proteins and tracers commonly used in neuroscience research. For whole-brain imaging, neurons of interest and their processes are usually recognized through the use of fluorescent labels. Thus, organic solvents were excluded due to concern regarding fluorescence quenching (Dodt et al., 2007 ; Becker et al., 2012 ; Erturk et al., 2012a , b ). Given that high concentrations of fructose solutions are themselves relatively viscous, which makes it difficult to remove bubbles, the second principle required that the candidates were highly water-soluble but less bubble-generative. Accordingly, neither ionic nor non-ionic detergents were taken into consideration because they gave rise to bubbles during solution preparation and manipulation (Chung et al., 2013 ; Susaki et al., 2014 ). Based on the above two principles, urea was chosen as the other main ingredient of the cocktail solution, which was termed FRUIT. To determine whether or not fructose and urea can coexist, we conducted pilot tests to examine the simultaneous dissolution of fructose (80% wt/vol) and urea (24% wt/vol, equal to 4 M) in water. D-fructose, urea and other reagents were purchased from Aladdin Industrial Corporation (Shanghai, China) or Sinopharm Chemical Reagent Company (Beijing, China). Fructose was first completely dissolved in deionized water at about 65°C. After cooling to 37°C, urea was added to a final concentration as required. Notably, the mixture remained stable over 3 days at 37°C but not at 65°C, in terms of both appearance (Figure 1A ) and RI. Given that SeeDB demonstrated general superiority over Sca l e (Ke et al., 2013 ), we decided to dissolve as much urea as possible into the ascending gradient of fructose solutions used in SeeDB so as to maximize the clearing action of the fructose. For convenience, the concentrations of the FRUIT solutions were determined in terms of their fructose concentration. It was found that fructose solutions to 83% (wt/vol) were capable of dissolving at least 4 M urea whereas a saturated fructose solution (130% wt/vol) could dissolve virtually no urea (Supplementary Figure 1 ). We then prepared a gradient of FRUIT solutions containing fructose and urea in variable proportions (Supplementary Table 1 ). For the purpose of comparison, the gradient of FRUIT solutions was initially designed following the gradient of fructose concentrations used in SeeDB. The urea was maintained at 48% (wt/vol, equal to 8 M) if possible or otherwise saturated, as the transitory use of 8 M urea significantly accelerated clearing of the brain without damage to fluorescent proteins (Hama et al., 2011 ). All FRUIT solutions contained 0.5% (wt/vol) α-thioglycerol. FRUIT solutions at a concentration of 100% (wt/vol) could be stored at 4°C without any crystallization. To control tissue expansion, 20~80% (wt/vol) FRUIT solutions were also prepared with different concentrations of PBS instead of water as indicated in Supplementary Table 1 . The RIs of the solutions were measured at 18°C using an Abbe refractometer (INESA Instrument, Shanghai, China). Figure 1 Composition of the cocktail. (A) The fructose solution (80% in wt/vol), urea solution (24% in wt/vol, equal to 4 M), and cocktail solution containing 80% fructose and 24% urea all remained stable in terms of appearance over 3 days at 37°C. In contrast, the cocktail solution turned from light brown to dark brown if kept at 65°C, whereas 8 g fructose and 2.4 g urea could not be fully dissolved in 10 ml of aqueous solution at 18°C. (B) The refractive index (RI) of the different clearing solutions presented as mean ± SD ( n = 3). The composition of these solutions is shown in Supplementary Tables 1 – 3 .
Show full methods section
Makeup of the cocktail To develop a clearing method which overcomes the limitations of SeeDB while retaining its advantages, we sought to make a cocktail comprising fructose and other available clearing agents which had been subject to careful verification and demonstrated satisfactory performance using adult mouse brain samples. The candidates were determined based on two principles. First, they needed to be compatible with the fluorescent proteins and tracers commonly used in neuroscience research. For whole-brain imaging, neurons of interest and their processes are usually recognized through the use of fluorescent labels. Thus, organic solvents were excluded due to concern regarding fluorescence quenching (Dodt et al., 2007 ; Becker et al., 2012 ; Erturk et al., 2012a , b ). Given that high concentrations of fructose solutions are themselves relatively viscous, which makes it difficult to remove bubbles, the second principle required that the candidates were highly water-soluble but less bubble-generative. Accordingly, neither ionic nor non-ionic detergents were taken into consideration because they gave rise to bubbles during solution preparation and manipulation (Chung et al., 2013 ; Susaki et al., 2014 ). Based on the above two principles, urea was chosen as the other main ingredient of the cocktail solution, which was termed FRUIT. To determine whether or not fructose and urea can coexist, we conducted pilot tests to examine the simultaneous dissolution of fructose (80% wt/vol) and urea (24% wt/vol, equal to 4 M) in water. D-fructose, urea and other reagents were purchased from Aladdin Industrial Corporation (Shanghai, China) or Sinopharm Chemical Reagent Company (Beijing, China). Fructose was first completely dissolved in deionized water at about 65°C. After cooling to 37°C, urea was added to a final concentration as required. Notably, the mixture remained stable over 3 days at 37°C but not at 65°C, in terms of both appearance (Figure 1A ) and RI. Given that SeeDB demonstrated general superiority over Sca l e (Ke et al., 2013 ), we decided to dissolve as much urea as possible into the ascending gradient of fructose solutions used in SeeDB so as to maximize the clearing action of the fructose. For convenience, the concentrations of the FRUIT solutions were determined in terms of their fructose concentration. It was found that fructose solutions to 83% (wt/vol) were capable of dissolving at least 4 M urea whereas a saturated fructose solution (130% wt/vol) could dissolve virtually no urea (Supplementary Figure 1 ). We then prepared a gradient of FRUIT solutions containing fructose and urea in variable proportions (Supplementary Table 1 ). For the purpose of comparison, the gradient of FRUIT solutions was initially designed following the gradient of fructose concentrations used in SeeDB. The urea was maintained at 48% (wt/vol, equal to 8 M) if possible or otherwise saturated, as the transitory use of 8 M urea significantly accelerated clearing of the brain without damage to fluorescent proteins (Hama et al., 2011 ). All FRUIT solutions contained 0.5% (wt/vol) α-thioglycerol. FRUIT solutions at a concentration of 100% (wt/vol) could be stored at 4°C without any crystallization. To control tissue expansion, 20~80% (wt/vol) FRUIT solutions were also prepared with different concentrations of PBS instead of water as indicated in Supplementary Table 1 . The RIs of the solutions were measured at 18°C using an Abbe refractometer (INESA Instrument, Shanghai, China). Figure 1 Composition of the cocktail. (A) The fructose solution (80% in wt/vol), urea solution (24% in wt/vol, equal to 4 M), and cocktail solution containing 80% fructose and 24% urea all remained stable in terms of appearance over 3 days at 37°C. In contrast, the cocktail solution turned from light brown to dark brown if kept at 65°C, whereas 8 g fructose and 2.4 g urea could not be fully dissolved in 10 ml of aqueous solution at 18°C. (B) The refractive index (RI) of the different clearing solutions presented as mean ± SD ( n = 3). The composition of these solutions is shown in Supplementary Tables 1 – 3 .
Measurement of solution transmittance
The light transmittance of the clearing agents was measured using a spectrophotometer (UV2400, Sunny Optical Technology Group, Shanghai, China). The transmittance of solutions containing clearing agents was initially measured using pure water as the control. However, the transmittance of the solutions significantly exceeded baseline in the band from 930 nm to 1000 nm (Figures 2A,B ), particularly at about 970 nm, because water itself substantially absorbs light at near-infrared wavelengths (Hale and Querry, 1973 ). This problem had probably been overlooked previously, as the endpoint of the transmittance curve was set before 950 nm in earlier studies (see Figure 1A in Hama et al., 2011 and Figure1D in Ke et al., 2013 ). To correct this bias, the transmittance of solutions was first normalized against air and the blank, respectively, after which the mean of the measured values was taken as the true transmittance. Figure 2 Transmittance curves of clearing solutions. (A,B) The transmittance of SeeDB (A) or FRUIT (B) solutions at different concentrations, normalized against pure water. The transmittance of the solutions exceeded the baseline in the band from 930 to 1000 nm, particularly at about 970 nm, because water itself substantially absorbs light at near-infrared wavelengths (Hale and Querry, 1973 ). (C,D) The corrected transmittance curves of the SeeDB (C) and FRUIT (D) solutions at different concentrations, normalized against air and the blank (see Materials and Methods).
Animals
All animals were housed and treated in accordance with institutional guidelines. The experimental procedures and housing conditions were approved by the Animal Experiment Committee of the Beijing Institute of Radiation Medicine. C57BL/6N mice, Thy1-YFP (line H) mice in a C57BL/6N background and New Zealand rabbits were used for optical clearing.
Optical clearing using FRUIT
The different FRUIT protocols used on the adult mouse brain are depicted in Figure 3A . The initially designed FRUIT (20:115) procedure was performed as follows. Adult mice over 70 days of age were deeply anesthetized with an intraperitoneal overdose of sodium pentobarbital (70 mg/kg body weight) and transcardially perfused with 1 × PBS followed by 4% (wt/vol) paraformaldehyde (PFA) in 1 × PBS. The whole brains were excised and then post-fixed in the same fixative at 4°C overnight. The brain samples were serially incubated in 20–30 ml of 20, 40, and 60% (wt/vol) FRUIT, each for 8 h in 50-ml conical tubes with gentle rotation (~4 rpm) at 37°C. The samples were then incubated in 80% (wt/vol) FRUIT for 12 h, 100% FRUIT for 12 h and finally 115% FRUIT for 24 h with gentle rotation at 37°C. In the case of the Thy1-YFP (line H) mice, the samples were covered with foil and protected from light during clearing. After noting that the samples showed volume expansion under the above conditions, we considered choosing an appropriate start concentration and elevating the ionic osmotic pressure in the FRUIT solutions to control FRUIT-mediated tissue expansion. In order to achieve maximal transparency without deformation, the optimal FRUIT protocol was established as follows: 8 h each in 35, 40, and 60% (wt/vol) FRUIT, 12 h in 80% (wt/vol) FRUIT and 24 h in 100% (wt/vol) FRUIT. Incubation at a temperature over 37°C is not recommended due to concern regarding the breakdown of FRUIT. Samples could be stored in 100% (wt/vol) FRUIT over 2 months at 4°C. Figure 3 Optical clearance of the adult mouse brain. (A) Schematic diagram of different clearing procedures. FRUIT (20:115) denotes a FRUIT gradient starting at 20% and ending at 115% whereas FRUIT (0.5PBS) means that the FRUIT solutions from 20 to 80% were prepared with 0.5×PBS instead of water. (B,C) Transmittance curves of hemi-brains processed with SeeDB (B) and FRUIT (20:115) (C) , respectively. PFA, paraformaldehyde. (D) Comparison of normalized transmittance at 920 nm between hemi-brains treated with SeeDB and FRUIT (20:115) across different concentrations. (E,F) Transmittance curves of hemi-brains after treatment with a descending gradient of urea solutions (E) and Sca l e A2 solution (F) , respectively. (G) Transmittance curves of the left and right halves of a brain processed with FRUIT (20:100) and FRUIT (20:83), respectively. (H) Transmittance curves of the left and right halves of a brain before and after (upper right inset) treatment with FRUIT (35:100) or FRUIT solutions using 0.5 × PBS as the solvent (in PBS). The y axis in the inset is at ten times lower magnification than that in the main panel. (I) Transmittance curves of the left and right halves of a brain before and after (upper right inset) treatment with SeeDB or FRUIT (35:100). The y axis in the inset is at ten times lower magnification than that in the main panel. (J,K) Visible-light (J) and infrared (K) photographs of hemi-brains cleared with FRUIT (35:100) (left) or SeeDB (right). (L) Normalized laser intensity through the samples before and after treatment with SeeDB or FRUIT (35:100). The laser intensity from FRUIT-processed hemi-brains was lower than that through SeeDB-processed hemi-brains in the direction perpendicular to the incident laser, but was higher in the direction of the incident laser, implying that FRUIT was more effective at reducing scattering. The assessment of light scattering is schematically illustrated in Supplementary Figure 2 . Perfusion-assisted clearing using FRUIT For perfusion-assisted clearance of the brain, 3 month old adult rabbits were anesthetized with an intravenous injection of sodium pentobarbital (35 mg/kg body weight) through the auricular vein. The rabbit was secured in a supine position and the common carotid arteries and internal jugular veins were exposed. The bilateral common carotid arteries were ligated and the internal jugular veins were opened. A needle was inserted into each common carotid artery at the distal segment to allow for cerebral perfusion of 1 × PBS followed by 4% (wt/vol) PFA in 1 × PBS. The rabbit brain was then sequentially perfused with 50 ml of 20, 40, 60, 80, and 100% (wt/vol) FRUIT solutions through an injection pump (ZT-500A1, Z&T Medical Treatment, Shenzhen, China) at a flow rate of 5~10 ml/h at room temperature. Arterial perfusion of SeeDB solutions could not be completed because 130% (wt/vol) fructose was too viscous to be infused even at 37°C.
Optical clearing with seeDB
For clearing with SeeDB (Ke et al., 2013 ), PFA-fixed brain samples excised from the adult mouse were serially incubated in 20–30 ml of 20, 40, and 60% (wt/vol) fructose, each for 8 h with gentle rotation at 37°C. Samples were then incubated in 80% (wt/vol) fructose for 12 h, 100% fructose for 12 h, 115% fructose for 24 h and finally 130% fructose for 24 h with gentle rotation at 37°C. All fructose solutions contained 0.5% α-thioglycerol. Figure 3A schematically depicts the clearing procedure. For Thy1-YFP (line H) mice, the samples were covered with foil and protected from light during clearing.
Optical clearing with scale and descending gradient urea solutions
Given that Sca l e has been systematically compared with SeeDB (Ke et al., 2013 ), we only compared the clearing competence between FRUIT and Sca l e A2 or a descending gradient of urea solutions within a similar incubation period. For clearing with Sca l e (Hama et al., 2011 ), PFA-fixed brain samples excised from the adult mouse were transferred to 20–30 ml of Sca l e A2 solutions containing 4 M urea, 10% (wt/vol) glycerol, and 0.1% (vol/vol) Triton X-100 and incubated at 37°C with gentle rotation for 4.5 days. For tissue clearance using a descending gradient of urea solutions, PFA-fixed brain samples excised from the adult mouse were serially incubated in 8 M (equal to 48% wt/vol) urea for 16 h, 6.16 M (37% wt/vol) urea for 8 h, 4.3 M (26% wt/vol) urea for 12 h, 1.8 M (11% wt/vol) urea for 12 h and 0.33 M (2% wt/vol) urea for 24 h with gentle rotation at 37°C. Figure 3A schematically illustrates these clearing procedures.
Measurement of tissue transmittance
The light transmittance of the brain samples was measured using a spectrophotometer (UV2400, Sunny Optical Technology Group, Shanghai, China). As the light scattering of the adult brain is non-homogeneous due to the presence of highly myelinated structures (Ke et al., 2013 ), the medial-to-lateral transmittance of a hemi-brain was measured through its thickest part, with the midplane facing the light. Cleared hemi-brains without liquid can act as a convex lens due to the mismatch in RI between the air and the cleared samples (Susaki et al., 2014 ). To avoid such a possible convex lens effect, the samples were secured in quartz cuvettes filled with clearing agents with their midplane closely adherent to the sidewall of the cuvette, and their transmittance was normalized against the solutions containing different clearing agents. To ensure strict control, the brains were cut into equal left and right halves along the midline in several experiments, as illustrated in Figures 3G–I . Examination of sample deformation For the measurement of sample deformation, the brains were cut into left and right halves along the midline, and the hemi-forebrains were excised. The samples were then incubated in SeeDB or FRUIT solutions as illustrated in Figure 3A . Photos of samples without liquid were taken before, during and after clearing, with their ventral plane on a glass plate. Based on top view photos, the size of the samples was examined with reference to the grid (5 × 5 mm) in the same picture.
Assessment of light scattering
The brains were cut into equal left and right halves along the midline, and the samples were incubated in SeeDB or FRUIT (35:100). A laser beam at infrared wavelength (1064 nm was used due to the availability of a laser source) was positioned perpendicular to the midplane of the hemi-brains and the diameter of the laser spot on the midplane was adjusted to 2 mm. The laser intensity through the hemi-brains was measured in a dark room using a laser power meter (PD300, Ophir Photonics, Jerusalem, Israel) at angles of 0, 45 and 90 degrees from the incident laser, before and after clearing. The measured values were then normalized to the intensity of the incident laser for comparison. The assessment of light scattering is schematically illustrated in Supplementary Figure 2 . Examination of solution viscosity Dynamic viscosity of solutions was measured at room temperature (29°C) or 37°C using a viscometer (DV-S, Brookfield, Middleboro, MA). For the fluidity test, the pipettes were filled with 100% FRUIT or 130% (wt/vol) fructose solutions, and then maintained vertically to allow the solutions to fall by gravity at room temperature (18°C) or 37°C. The time for the solution with low viscosity to run out was recorded.
DiI labeling
PFA-fixed brains were cut into left and right hemi-brains along the midline. As reported in the previous study (Lin et al., 2000 ), a small incision was made with a scalpel in the cingulate on each side, and a small DiI C 18 (3) crystal (Invitrogen, Carlsbad, CA) was placed into the incision. The hemi-brain samples were then incubated in 2% (wt/vol) PFA in PBS at 37°C for 14 days, after which they were serially incubated in a gradient of SeeDB or FRUIT (35:100) solutions, respectively. During incubation and clearing, the samples were covered with foil and protected from light. Cleared samples were subjected to two-photon imaging using an upright microscope (FV10MP-BXD4CH, Olympus, Tokyo, Japan) and the images were acquired at 990 nm excitation.
Two-photon imaging of cleared samples
The brain samples from Thy1-YFP (line H) mice were placed in a hand-made chamber filled with clearing agents. For SeeDB-treated samples, 130% (wt/vol) fructose was not used for immersion due to the fact that its extreme viscosity would cause an uneven RI distribution after evaporation of water during imaging and might impair image quality. Although previously suggested as an immersion agent (Ke et al., 2013 ), 2, 2′-thiodiethanol was also not used, due to lack of availability. As a result, 100% FRUIT (wt/vol, RI = 1.48) or 115% FRUIT (wt/vol, RI = 1.50) was used for immersion for FRUIT (35:100)- or SeeDB-cleared samples. An upright multiphoton microscope (FV10MP-BXD4CH, Olympus) was used for two-photon imaging with 920 nm excitation. Images at a resolution of 512 × 512 pixels were collected with a 25 × objective (Olympus, NA = 1.0, working distance = 4.0 mm). Image analysis and presentation were performed with FluoView 1000 software (Olympus).
Supplementary material The Supplementary Material for this article can be found online at: http://www.frontiersin.org/journal/10.3389/fnana.2015.00019/abstract Click here for additional data file. Click here for additional data file. Click here for additional data file. Supplementary Figure 1 Solubility of urea in a gradient of fructose solutions at 37°C . Both fructose and urea are highly water soluble, and the solubility of urea decreases in converse with the fructose concentration. Fructose solutions to 83% (wt/vol) are able to dissolve at least 4 M urea, whereas saturated fructose solution can dissolve virtually no urea. Click here for additional data file. Supplementary Figure 2 Schematic diagram of light scattering assessment . A laser beam was positioned perpendicular to the midplane of the hemi-brains and the laser intensity through the sample was measured using a laser power meter placed at angles of 90 (D1), 45 (D2), and 0 degrees (D3) from the incident laser. M: the place of a monitor S: the sample. Click here for additional data file.
📊 Figures
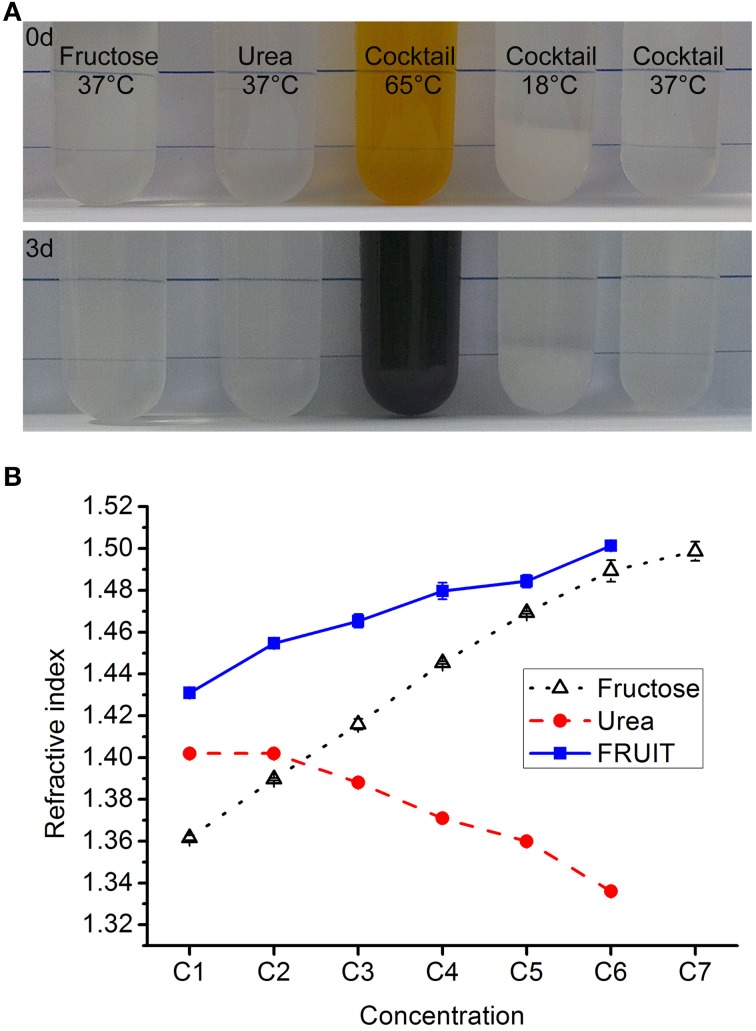
Figure 1
Composition of the cocktail. (A) The fructose solution (80% in wt/vol), urea solution (24% in wt/vol, equal to 4 M), and cocktail solution containing 80% fructose and 24% urea all remained stable in t...
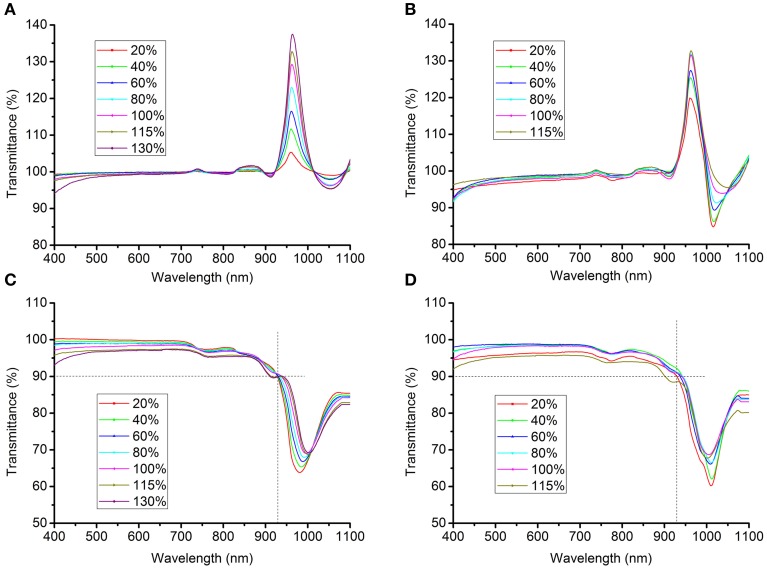
Figure 2
Transmittance curves of clearing solutions. (A,B) The transmittance of SeeDB (A) or FRUIT (B) solutions at different concentrations, normalized against pure water. The transmittance of the solutions e...
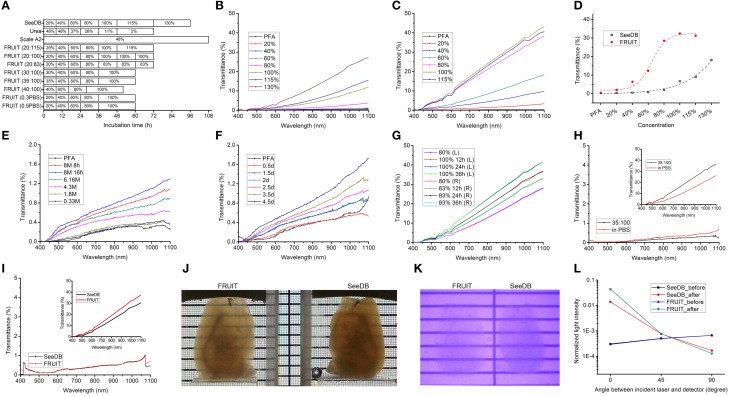
Figure 3
Optical clearance of the adult mouse brain. (A) Schematic diagram of different clearing procedures. FRUIT (20:115) denotes a FRUIT gradient starting at 20% and ending at 115% whereas FRUIT (0.5PBS) me...
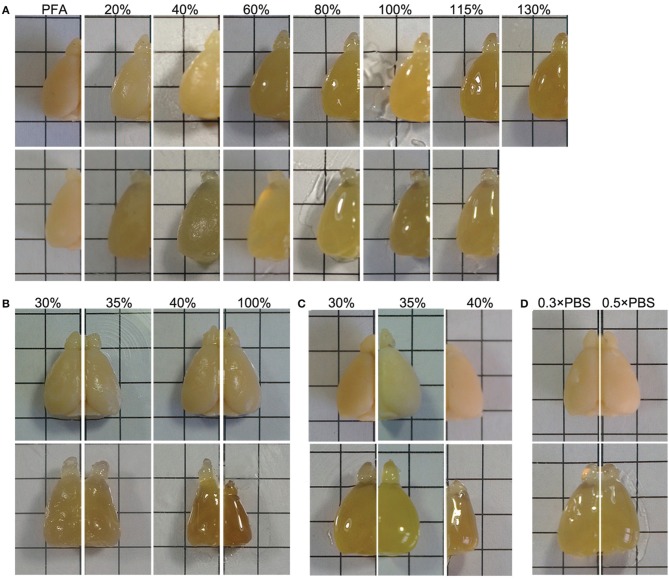
Figure 4
Control of tissue deformation. (A) The hemi-brains were sequentially treated with a gradient of SeeDB (upper row) or FRUIT (20:115) (lower row) solutions at 37u00b0C. The final volumes of the brain sa...
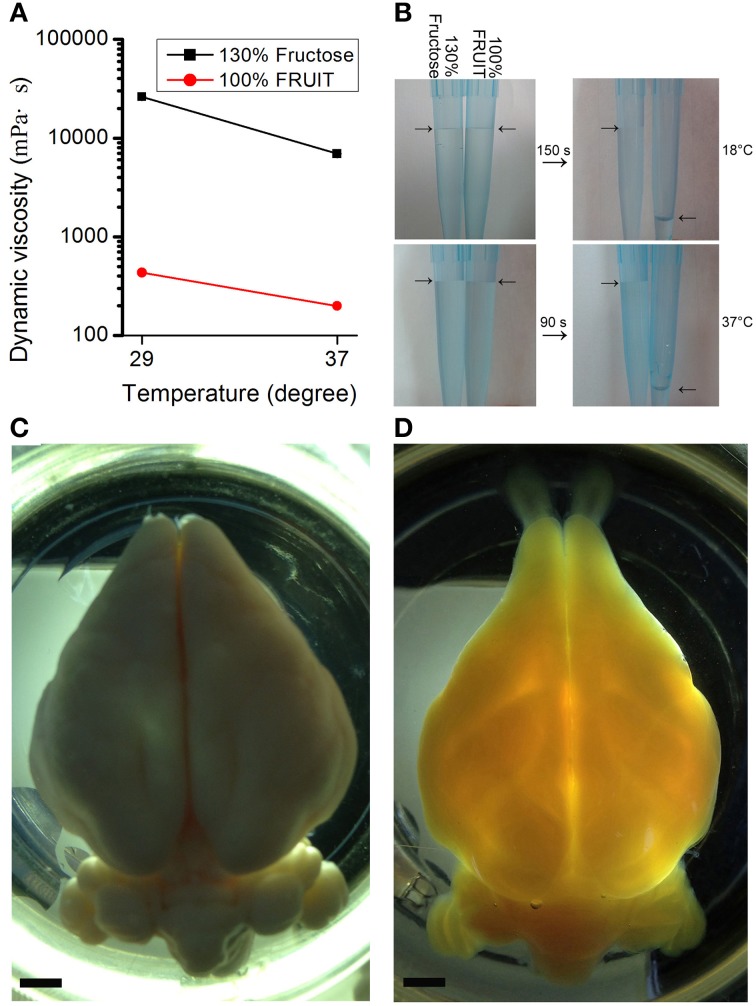
Figure 5
Viscosity-dependent arterial perfusion of clearing agents. (A) The dynamic viscosity of different clearing solutions presented as mean u00b1 SD ( n = 3). 100% FRUIT was 30 times less viscous than 130%...
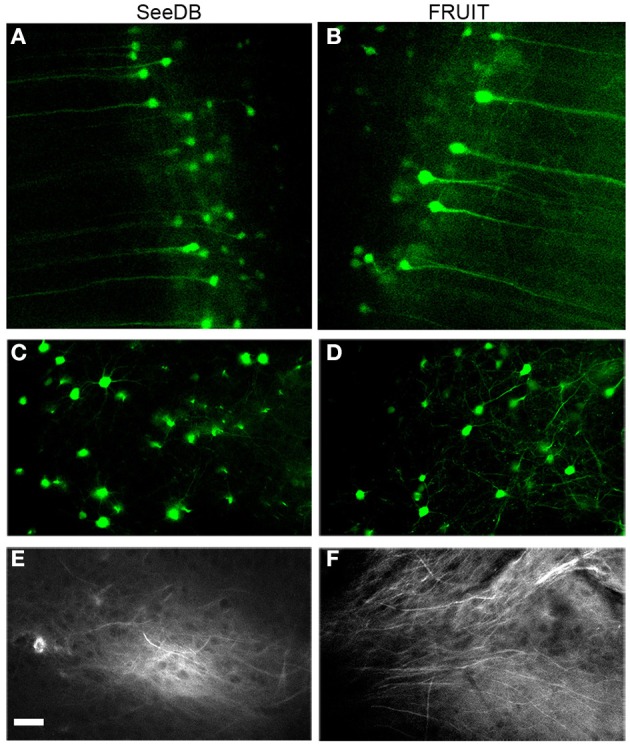
Figure 6
Compatibility with fluorescent proteins or lipophilic tracers. (A, B) Two-photon imaging of cortical pyramidal neurons in Thy1-eYFP (line H) mouse brains cleared with SeeDB (A) or FRUIT (20:115) (B) ....
Figure images are served from the NIH/NLM PubMed Central Open Access Subset or Europe PMC; copyright remains with the publishers and authors.
💬 Discussion
0 commentsNo comments yet. Be the first to start a discussion!
Leave a Comment