Abstract
With the introduction of direct electron detectors (DED) to the field of electron cryo-microscopy, a wave of atomic-resolution structures has become available. As the new detectors still require comparative characterization, we have used tobacco mosaic virus (TMV) as a test specimen to study the quality of 3D image reconstructions from data recorded on the two direct electron detector cameras, K2 Summit and Falcon II. Using DED movie frames, we explored related image-processing aspects and compared the performance of micrograph-based and segment-based motion correction approaches. In addition, we investigated the effect of dose deposition on the atomic-resolution structure of TMV and show that radiation damage affects negative carboxyl chains first in a side-chain specific manner. Finally, using 450,000 asymmetric units and limiting the effects of radiation damage, we determined a high-resolution cryo-EM map at 3.35Å resolution. Here, we provide a comparative case study of highly ordered TMV recorded on different direct electron detectors to establish recording and processing conditions that enable structure determination up to 3.2Å in resolution using cryo-EM.
🔬 Techniques
🔭 Microscopes
🧬 Organisms
💻 Software
✨ Fluorophores
🏭 Microscope Brands
💻 Software Details
💾 Data Repositories
🏛️ Research Organizations (ROR)
Affiliated research institutions:
📋 Methods
Virus preparation
Virus was grown in Nicotiana tabacum and harvested infected plants stored at −20 °C. After mincing, the leaf slurry was liquidized in a Vortex mixer to reduce the fibrous nature of the plant remains. The homogenate was then filtered and spun (12,000× g for 30 min) to pellet the particulate matter. Each filtrate was precipitated in 30% (w/v) PEG 6000, followed by 2.5 ml 5 M NaCl washes. The precipitate was recovered by centrifugation at 12,000× g for 10 min and re-extracted 3 times with 10 mM Na 2 HPO 4 /0.1% (w/v) ascorbic acid. The TMV was pelleted at 50,000 rev/min for 30 min and the dark green layer washed off the top of the glass like pellets. The pellets were then left under Na phosphate buffer ( I = 0.1 M, pH 7.0) at 4 °C overnight to soften, before being re-suspended until the TMV solution clarified. Differential centrifugation was repeated until a clean preparation was obtained.
Electron microscopy
First, we prepared EM samples and recorded a data set at the MRC-LMB in the following way: a total of 2.5 μl of 5.5 mg/ml TMV solution was applied to Quantifoil 2/2 Cu 300 mesh grids. Subsequently, the grids were mounted in the Vitrobot Mark 4 with a ∼10 s time between application and blotting. The Vitrobot blotted with force of −15, for a total of 2.5 s with a 0.5 s drain time at 100% humidity at 10 °C. The MRC-LMB FEI Titan Krios was operated at 300 kV with an extraction voltage of 3950 V (gun lens 3). For Falcon II imaging, an 800-nm diameter electron beam was used with a 70 μm C2 aperture. Spot size 4 was used in Nanoprobe mode at a nominal magnification of 75,000 (calibrated pixel size 1.06 Å), leading to a dose rate at the camera level of ∼50 e − /pixel/s. An exposure time of one second was set accumulating a total dose of 43 e − /Å 2 in the integrated image (16 frame sets were processed while 18 were collected including the roll-in and roll-out frames that were discarded). Falcon II data at the MRC-LMB was available in 16 frame sets using the home-built software solution. Falcon II micrographs were recorded with an under-focus between 1.0 and 3.0 μm. For K2 imaging, the same grid was imaged in the same microscopy session. Data was collected in EFTEM mode at a nominal magnification of 105,000 (calibrated pixel size 1.13 Å) with an 800-nm beam at spot size 6, corresponding to a dose rate at the camera level of 7 e − /pixel/s. The applied dose on the sample was estimated using known dose response curves for both detectors. Other hardware settings of the microscope were kept the same. An exposure time of 4.4 s was set accumulating a total dose of 43 e − /Å 2 in the integrated image (22 frames recorded over the entire movie). Images were collected with an under-focus of 1.2 and 2.5 μm in super-resolution mode of the K2 camera (pixel size 0.56 Å) using SerialEM ( Mastronarde, 2005 ) with the energy slit of the Gatan Quantum energy filter retracted. Subsequently, all K2 micrographs were binned 2 × 2 by windowing in Fourier space. Second, we describe EM sample preparation and data collection performed at EMBL: a total of 2.5 μl of 11 mg/ml TMV solution was applied on Quantifoil 2/2 200 mesh grid under the light microscope to ensure proper application and spreading. Subsequently, the grids were mounted in the Vitrobot Mark 3 with a ∼30 to 45 s time between application and blotting. The Vitrobot blotted with an offset of −2 mm, for a total of 8 s without drain time at 90% humidity. The EMBL FEI Titan Krios was operated at 300 kV with an extraction voltage of 4100 V (gun lens 3). The 600-nm diameter electron beam was aligned with the 70 μm C2 aperture using a spot size 6 in Nanoprobe mode. The micrographs were recorded at a nominal magnification of 75,000 giving a final pixel size of 1.06 Å on the specimen at an under-focus between 1.0 and 4.5 μm. The data was acquired in a fully automated manner with FEI EPU software using a 3 × 3 image matrix over a 2 μm hole, which includes beam shifts up to 800 nm away from the optical axis. We set the exposure time to 0.836 s accumulating a total of 30.7 e − /Å 2 measured dose in the integrated image (including the roll-in frame). The frames were merged into even seven frame sets from 2.0 to 30.7 e − /Å 2 (excluding roll-in and roll-out frame) using FEI’s integrated 7-frame bin solution.
Show full methods section
Virus preparation
Virus was grown in Nicotiana tabacum and harvested infected plants stored at −20 °C. After mincing, the leaf slurry was liquidized in a Vortex mixer to reduce the fibrous nature of the plant remains. The homogenate was then filtered and spun (12,000× g for 30 min) to pellet the particulate matter. Each filtrate was precipitated in 30% (w/v) PEG 6000, followed by 2.5 ml 5 M NaCl washes. The precipitate was recovered by centrifugation at 12,000× g for 10 min and re-extracted 3 times with 10 mM Na 2 HPO 4 /0.1% (w/v) ascorbic acid. The TMV was pelleted at 50,000 rev/min for 30 min and the dark green layer washed off the top of the glass like pellets. The pellets were then left under Na phosphate buffer ( I = 0.1 M, pH 7.0) at 4 °C overnight to soften, before being re-suspended until the TMV solution clarified. Differential centrifugation was repeated until a clean preparation was obtained.
Electron microscopy
First, we prepared EM samples and recorded a data set at the MRC-LMB in the following way: a total of 2.5 μl of 5.5 mg/ml TMV solution was applied to Quantifoil 2/2 Cu 300 mesh grids. Subsequently, the grids were mounted in the Vitrobot Mark 4 with a ∼10 s time between application and blotting. The Vitrobot blotted with force of −15, for a total of 2.5 s with a 0.5 s drain time at 100% humidity at 10 °C. The MRC-LMB FEI Titan Krios was operated at 300 kV with an extraction voltage of 3950 V (gun lens 3). For Falcon II imaging, an 800-nm diameter electron beam was used with a 70 μm C2 aperture. Spot size 4 was used in Nanoprobe mode at a nominal magnification of 75,000 (calibrated pixel size 1.06 Å), leading to a dose rate at the camera level of ∼50 e − /pixel/s. An exposure time of one second was set accumulating a total dose of 43 e − /Å 2 in the integrated image (16 frame sets were processed while 18 were collected including the roll-in and roll-out frames that were discarded). Falcon II data at the MRC-LMB was available in 16 frame sets using the home-built software solution. Falcon II micrographs were recorded with an under-focus between 1.0 and 3.0 μm. For K2 imaging, the same grid was imaged in the same microscopy session. Data was collected in EFTEM mode at a nominal magnification of 105,000 (calibrated pixel size 1.13 Å) with an 800-nm beam at spot size 6, corresponding to a dose rate at the camera level of 7 e − /pixel/s. The applied dose on the sample was estimated using known dose response curves for both detectors. Other hardware settings of the microscope were kept the same. An exposure time of 4.4 s was set accumulating a total dose of 43 e − /Å 2 in the integrated image (22 frames recorded over the entire movie). Images were collected with an under-focus of 1.2 and 2.5 μm in super-resolution mode of the K2 camera (pixel size 0.56 Å) using SerialEM ( Mastronarde, 2005 ) with the energy slit of the Gatan Quantum energy filter retracted. Subsequently, all K2 micrographs were binned 2 × 2 by windowing in Fourier space. Second, we describe EM sample preparation and data collection performed at EMBL: a total of 2.5 μl of 11 mg/ml TMV solution was applied on Quantifoil 2/2 200 mesh grid under the light microscope to ensure proper application and spreading. Subsequently, the grids were mounted in the Vitrobot Mark 3 with a ∼30 to 45 s time between application and blotting. The Vitrobot blotted with an offset of −2 mm, for a total of 8 s without drain time at 90% humidity. The EMBL FEI Titan Krios was operated at 300 kV with an extraction voltage of 4100 V (gun lens 3). The 600-nm diameter electron beam was aligned with the 70 μm C2 aperture using a spot size 6 in Nanoprobe mode. The micrographs were recorded at a nominal magnification of 75,000 giving a final pixel size of 1.06 Å on the specimen at an under-focus between 1.0 and 4.5 μm. The data was acquired in a fully automated manner with FEI EPU software using a 3 × 3 image matrix over a 2 μm hole, which includes beam shifts up to 800 nm away from the optical axis. We set the exposure time to 0.836 s accumulating a total of 30.7 e − /Å 2 measured dose in the integrated image (including the roll-in frame). The frames were merged into even seven frame sets from 2.0 to 30.7 e − /Å 2 (excluding roll-in and roll-out frame) using FEI’s integrated 7-frame bin solution.
Image processing
All of the described cryo-EM maps were generated using the standardized procedure of SPRING ( Desfosses et al., 2014 ), except for the micrograph-based motion correction that was performed using MOTIONCORR ( Li et al., 2013a ). In summary, SPRING is a comprehensive single-particle based helical reconstruction package that was originally inspired by the IHRSR approach ( Egelman, 2000 ). Briefly, the CTF parameters were determined using MICCTFDETERMINE that relies on CTFFIND with subsequent CTFTILT measurements ( Mindell and Grigorieff, 2003 ). We used the diagnostic output of MICCTFDETERMINE to discard micrographs that did not show Thon rings exceeding 6 Å. 80% were excluded because they were either empty or too crowded with TMV and 12% based on relatively poor Thon rings. 8% of the micrographs had a good density of viruses and showed Thon rings. After the selection step, we cropped TMV particles using E2HELIXBOXER from EMAN2 ( Tang et al., 2007 ). A stack of overlapping segments of a size of 350 × 350 Å with the segment-specific CTF convolved was produced using SEGMENT with a step size of 90 Å. The segments were subjected to 20 rounds of iterative refinement using SEGMENTREFINE3D from low-resolution to maximum-resolution target using the standard refinement strategies of SPRING. In order to avoid over-fitting of noise during alignment, we restricted the alignment search to segments low-pass filtered to 11 Å. This approach yields identical FSC curves from independent half-set refinements ( Scheres and Chen, 2012 ). The segment-based motion correction was also implemented in SPRING. First, the sum of the frame sets for each micrograph was subjected up to maximum resolution refinement using SEGMENTREFINE3D. Second, a new stack containing the corresponding frames of each segment was generated using SEGMENT. The previously determined orientation parameters were used as starting parameters for four subsequent local refinement cycles at maximum resolution (restrained x - and y -search ±7 and ±4 Å, restrained angular search ±2°) with SEGMENTREFINE3D. The displayed densities were generated using SEGREFINE3DINSPECT with an applied sharpening B-factor of −150 1/Å 2 and the corresponding 0.143 resolution cutoff ( Rosenthal and Henderson, 2003 ). Translational and angular alignment errors were estimated using the forward difference of measurements along a helix as described previously ( Sachse et al., 2007 ) where a small fraction of segments with distances and angles larger than 5 Å or 5° were excluded as they failed to align ( Table 1 ).
Atomic coordinate refinement
We performed a real-space coordinate refinement in order to improve the recent PDB structure ( Sachse et al., 2007 ) using the 3.35 Å resolution cryo-EM map. Initially, one of the 2OM3 conformers was placed into the EM density using the rigid-body fit option as implemented in Chimera ( Pettersen et al., 2004 ) and an oligomer of nine neighboring TMV subunits (3 × 3) was generated using the helical symmetry of the virus. A series of in-house scripts based on CCP4 and cctbx/PHENIX functions ( Adams et al., 2010; Winn et al., 2011 ) was employed to streamline subsequent refinement and validation of the coordinate models. A map segment corresponding to the 9-mer was carved from the reconstructed map using a mask encompassing all grid points including and extending 3.5 Å outwards of the model coordinates (including RNA). The segmented density was centered in a cubic box of 180 × 180 × 180 voxels. Likewise, the rigid-body fitted starting model was centered in a cubic unit cell of P1 symmetry with a cell edge of 191.16 Å (=180 × pixel size) to ensure uniform grid sampling of experimental and computed model density maps. A uniform isotropic B-factor of 50 1/Å 2 was assigned to all atoms and not further refined. Subsequently, the model was subjected to five cycles of geometry-restrained real-space refinement by gradient-driven minimization of a combined map and restraint target as implemented in PHENIX/cctbx ( Adams et al., 2010 ). A local grid search to correct side-chains with incorrect rotamer assignments or poor density correlation was iterated with global optimization aimed at improvement of the overall density fit. Weights on density map and geometry restraints were optimized during each refinement cycle. In the current implementation, we did not permit more than one conformer per residue. The central subunit of the resulting model was inspected and corrected by manual model building in Coot ( Emsley and Cowtan, 2004 ) and the modified 9-mer was subsequently subjected to three additional cycles of geometry-restrained real-space refinement. The progress of refinement was evaluated by computing the real-space cross-correlation (RSCC) for each residue along the monomer chain. To determine the overall agreement of the refined coordinate model with the observed data, refinements were run at different target resolutions. Finally, we used a target resolution of 3.2 Å because those refined atomic coordinates showed good agreement with the map and best geometry statistics. The Fourier shell correlation (FSC) at the 0.5 criterion between the map computed from the refined model at each target resolution and the experimental map filtered at the expected maximum resolution was used to assess the possibility of over-fitting ( Chen et al., 2013 ). Finally, we re-expanded the central TMV subunit coordinates into a helix of the same dimension as the 3D reconstruction, simulated a noise-free map at 2 Å resolution and computed the FSC with the determined 3D reconstruction, which gave a resolution of 3.45 Å at the 0.5 criterion ( Fig. 5 B). The figures of the manuscript were prepared using UCSF Chimera ( Pettersen et al., 2004 ). We deposited the EM maps from the K2-LMB and FalconII-LMB data sets at the EM Data Bank (EMDB-2833 and EMDB-2834). The EM densities corresponding to the radiation damage series are EMDB-2835, EMDB-2836, EMDB-2837, EMDB-2838, EMDB-2839, EMDB-2840, EMDB-2841. The 3.35 Å map recorded using the FalconII-EMBL data set is available as EMDB-2842. The refined atomic coordinates have accession code PDB-4udv at the Protein Data Bank. The software SPRING includes the used segment-based frame processing and is available from the author’s website at http://www.sachse.embl.de/emspring .
Appendix A Supplementary data Supplementary Fig. 1 Comparison of Falcon II and K2 Summit structures computed with increasing number of asymmetric units. Left. Fourier-shell correlation curves from K2 Summit (top) and Falcon II (bottom) with increasing number of asymmetric units color-coded from gray to black. Right. Table of respective resolution cutoff values (0.143).
📊 Figures
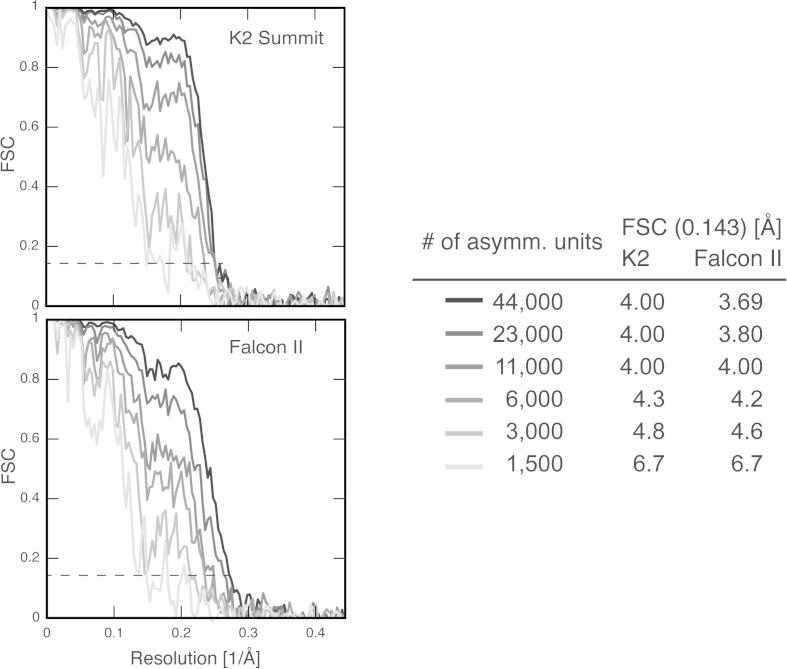
Supplementary Fig. 1
Comparison of Falcon II and K2 Summit structures computed with increasing number of asymmetric units. Left. Fourier-shell correlation curves from K2 Summit (top) and Falcon II (bottom) with increasing...
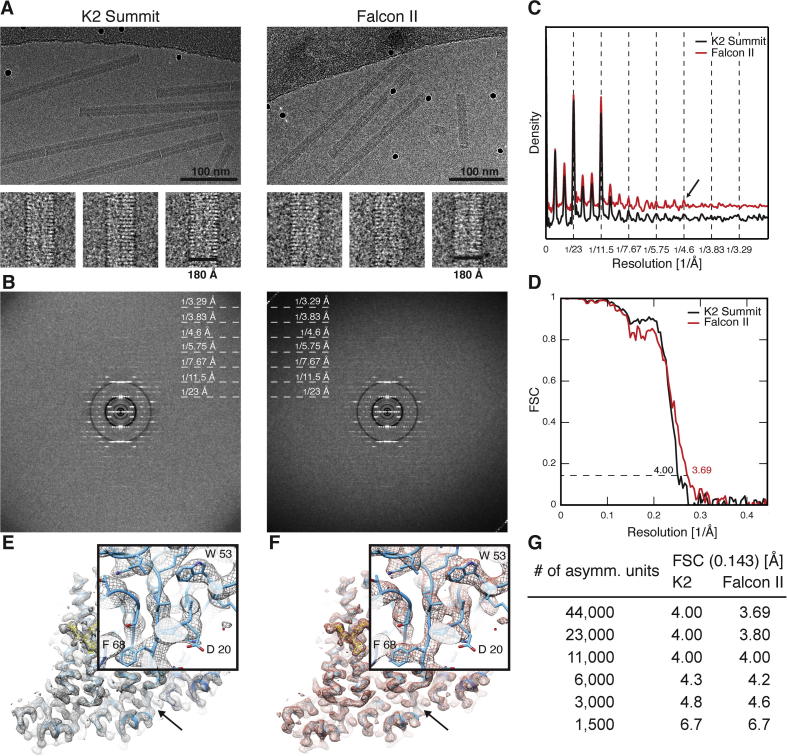
Fig. 1
Comparison of 3D reconstructions of an intermediately sized data set from the direct electron detector K2 Summit and Falcon II recorded on the same TMV grid with the MRC-LMB FEI Titan Krios microscope...
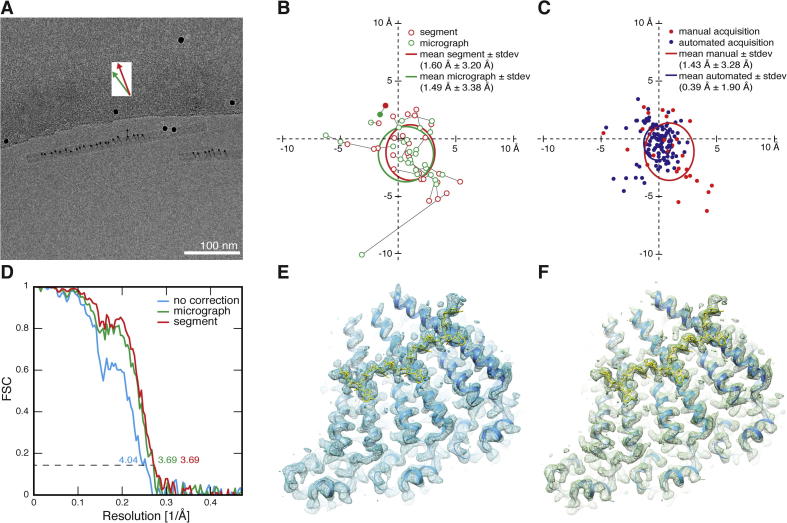
Fig. 2
Comparison of segment-based and micrograph-based motion correction on Falcon II. (A) Micrograph with superimposed translation vectors computed from segment-based (black) motion correction (30u00d7 enl...
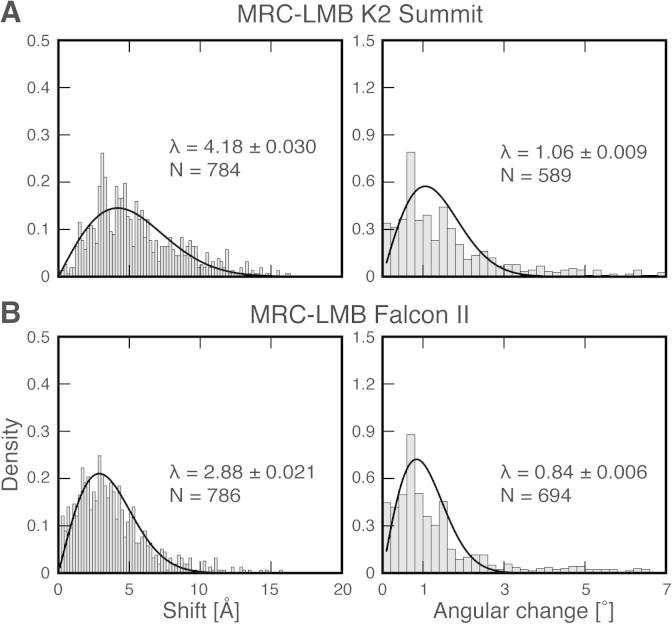
Fig. 3
Comparison of the translational shift and angular change after u223c20u00a0e u2212 /u00c5 2 . The histograms of x u2013 y -shifts (left) and the angular alignment change (right) are fitted with a Rayl...
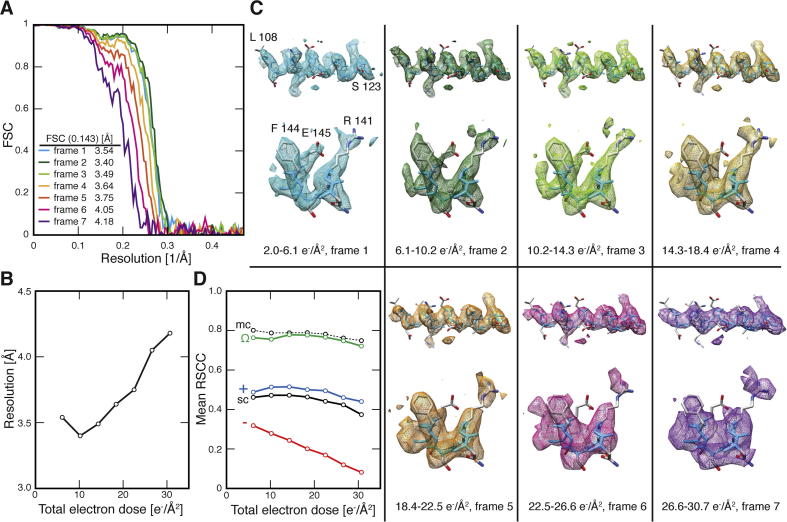
Fig. 4
Movie of radiation damage effects on the high-resolution cryo-EM map. (A) Fourier shell correlation of seven 3D reconstructions from frame sets 1 to 7, from 6.1 to 30.7u00a0e u2212 /u00c5 2 . (B) Plot...
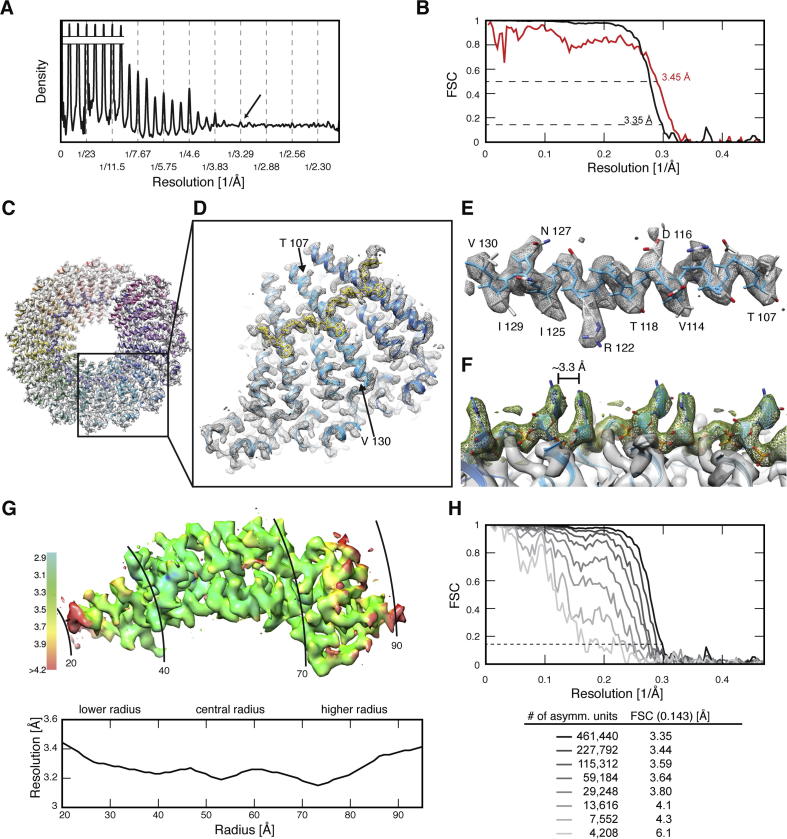
Fig. 5
High-resolution cryo-EM reconstruction of TMV at 3.35u00a0u00c5 resolution. (A) Collapsed power spectrum averaged from 8336 segments recorded on a Falcon II camera. (B) Fourier shell correlation (FSC)...
Figure images are served from the NIH/NLM PubMed Central Open Access Subset or Europe PMC; copyright remains with the publishers and authors.
💬 Discussion
0 commentsNo comments yet. Be the first to start a discussion!
Leave a Comment