Abstract
AbstractPotassium homeostasis is vital for all organisms, but is challenging in single-celled organisms like bacteria and yeast and immobile organisms like plants that constantly need to adapt to changing external conditions. KUP transporters facilitate potassium uptake by the co-transport of protons. Here, we uncover the molecular basis for transport in this widely distributed family. We identify the potassium importer KimA from Bacillus subtilis as a member of the KUP family, demonstrate that it functions as a K+/H+ symporter and report a 3.7 Å cryo-EM structure of the KimA homodimer in an inward-occluded, trans-inhibited conformation. By introducing point mutations, we identify key residues for potassium and proton binding, which are conserved among other KUP proteins.
🔬 Techniques
🔭 Microscopes
🧬 Organisms
💻 Software
🏭 Microscope Brands
📷 Detectors
💻 Software Details
💾 Data Repositories
🏛️ Research Organizations (ROR)
Affiliated research institutions:
📋 Methods
Cloning, expression and purification of KimA The gene encoding KimA was amplified from B. subtilis genomic DNA and cloned into a pBAD24 expression vector including a C-terminal His 10 -tag. Point mutations in the kimA gene were applied by restriction-free cloning techniques. A list of all primers used is included in the Supplementary Methods . Wild-type KimA was produced in E. coli strain LB2003 (available from the authors upon request) by growing an overnight culture in KML medium supplemented with 100 µg/mL ampicillin. This culture was diluted 100-fold in 12 L of fresh KML medium, and overexpression was induced at an OD 600 of 0.8 by the addition of 0.002% arabinose. After 1.5 h of induction the cells were harvested and resuspended in 50 mM Tris pH 8, 100 mM KCl, 400 mM NaCl, 1 mM EDTA supplemented with 0.5 mM PMSF, 1 mM benzamidine and DNase I. The suspension was passed through a homogenizer at a pressure of 1 kbar to disrupt the cells. The cell extract was centrifuged at 15,000 × g for 15 min to remove unbroken cells and debris. Membranes were collected by centrifugation at 180,000 × g for 3 h. The membrane pellet was resuspended in solubilization buffer (50 mM Tris pH 8, 100 mM KCl, 400 mM NaCl) to 50 mg/mL and solubilized by the addition of 2% SMA co-polymer Xiran SL30010 P20 (2:1 molar ratio of styrene:maleic acid), provided by Polyscope Polymers B. V., at 4 °C overnight. Subsequently, the solution was centrifuged at 180,000 × g for 30 min to remove unsolubilized particles. The supernatant was incubated with Ni-NTA overnight. Then, the resin was washed with 50 column volumes of solubilization buffer supplemented with 50 mM imidazole to remove any unspecific protein. Finally, the protein was eluted using 500 mM imidazole in the solubilization buffer, and further purified by size exclusion chromatography using a Superose 6 10/300 GL column (GE Healthcare) previously equilibrated with 50 mM Tris pH 8, 100 mM KCl. Fractions containing the protein were pooled and the sample was concentrated to 1 mg/mL prior to cryo-grid preparation. In the case of the detergent-solubilized KimA, the membrane pellet was solubilized with 1% DDM (from 20% stock). For the rest of that purification the buffers were supplemented with 0.04% DDM.
Show full methods section
Cloning, expression and purification of KimA The gene encoding KimA was amplified from B. subtilis genomic DNA and cloned into a pBAD24 expression vector including a C-terminal His 10 -tag. Point mutations in the kimA gene were applied by restriction-free cloning techniques. A list of all primers used is included in the Supplementary Methods . Wild-type KimA was produced in E. coli strain LB2003 (available from the authors upon request) by growing an overnight culture in KML medium supplemented with 100 µg/mL ampicillin. This culture was diluted 100-fold in 12 L of fresh KML medium, and overexpression was induced at an OD 600 of 0.8 by the addition of 0.002% arabinose. After 1.5 h of induction the cells were harvested and resuspended in 50 mM Tris pH 8, 100 mM KCl, 400 mM NaCl, 1 mM EDTA supplemented with 0.5 mM PMSF, 1 mM benzamidine and DNase I. The suspension was passed through a homogenizer at a pressure of 1 kbar to disrupt the cells. The cell extract was centrifuged at 15,000 × g for 15 min to remove unbroken cells and debris. Membranes were collected by centrifugation at 180,000 × g for 3 h. The membrane pellet was resuspended in solubilization buffer (50 mM Tris pH 8, 100 mM KCl, 400 mM NaCl) to 50 mg/mL and solubilized by the addition of 2% SMA co-polymer Xiran SL30010 P20 (2:1 molar ratio of styrene:maleic acid), provided by Polyscope Polymers B. V., at 4 °C overnight. Subsequently, the solution was centrifuged at 180,000 × g for 30 min to remove unsolubilized particles. The supernatant was incubated with Ni-NTA overnight. Then, the resin was washed with 50 column volumes of solubilization buffer supplemented with 50 mM imidazole to remove any unspecific protein. Finally, the protein was eluted using 500 mM imidazole in the solubilization buffer, and further purified by size exclusion chromatography using a Superose 6 10/300 GL column (GE Healthcare) previously equilibrated with 50 mM Tris pH 8, 100 mM KCl. Fractions containing the protein were pooled and the sample was concentrated to 1 mg/mL prior to cryo-grid preparation. In the case of the detergent-solubilized KimA, the membrane pellet was solubilized with 1% DDM (from 20% stock). For the rest of that purification the buffers were supplemented with 0.04% DDM.
K + uptake assay
An adapted protocol from ref. 33 was established for potassium uptake experiments into intact, potassium-depleted E. coli LB2003 cells, which lack all endogenous potassium uptake systems. LB2003 transformed with the plasmid that encodes the protein of interest was grown in 1 mL KML medium supplemented with 100 µg/mL ampicillin at 37 °C shaking at 180 rpm overday. The preculture was used to inoculate 50 mL K30 medium (the number indicates the mM potassium concentration added to the minimal media) supplemented with ampicillin for an overnight culture. The next day, the cells were diluted to an OD 600 of 0.15 in 500 mL K30 medium containing ampicillin and 0.002% L-arabinose for gene expression. After the cells reached an OD 600 of ~0.6-0.8, they were centrifuged at 5000 × g at 15 °C for 10 min and the cell pellets were resuspended in 120 mM Tris-HCl pH 8 to an OD 600 of 30 and washed three times by centrifuging at 4000 × g at 20 °C for 10 min. After the last centrifugation step, the cells were adjusted to an OD 600 of 30 with the same buffer. The resuspended cells were incubated at 37 °C for 5 min. To release K + and Na + from the cytoplasm, the cells were treated with 1 mM EDTA while gently shaking at 37 °C for another 5 min. Subsequently, the cells were centrifuged twice to wash out EDTA and ions at 4000 × g at 20 °C for 8 min and the pellets were resuspended each time in 100 mM HEPES, 100 mM MES pH 7.5. For the K + uptake experiment, cells were diluted into flasks to an OD 600 of 3 in 100 mM HEPES, 100 mM MES at the desired pH values under constant shaking at 20 °C. Ten minutes before initiating the potassium uptake, the cells were energized with 0.2% glycerol and 0.002% L-arabinose. The uptake was initiated by addition of various K + concentrations (0.05; 0.1; 0.2; 0.5; 1 and 2 mM). At different time points samples of 1 mL from each flask were transferred onto 200 μL silicone oil with a density of 1.04 g/cm 3 in a 1.5 mL centrifuge tube. The samples were immediately centrifuged at 17,000 × g at 20 °C for 2 min to isolate the cells from the supernatant. The supernatant and the silicon oil were removed and the cell pellets were cut out with a razor blade and were added to 1 mL of 5% trichloracetic acid (TCA) solution. Cell pellets were resuspended by vortexing. The suspensions were frozen at −20 °C and subsequently cook at 90 °C for 10 min to release the cations. Afterwards the solutions were diluted with 3 mL 6.7 mM CsCl and 4 mL 5 mM CsCl. After removing the cell fragments by centrifugation at 4000 × g for 20 min the K + concentration was determined by flame photometry. K + /Rb + exchange assay E. coli LB2003 cells were transformed with plasmids that encode KimA, KimA D36A and KimA E233A , respectively, or with the empty vector pBAD24, and grown in K30 minimal medium as indicated above for the K + uptake assay. After harvesting, the cell pellets were resuspended and washed twice with 200 mM HEPES-TEA pH 7.5. Afterwards, cells were adjusted to an OD 600 of 300 with the same buffer supplemented with 50 mM KCl and incubated at room temperature for 3 h to load the cells with potassium ions. To initiate the exchange, cells were diluted 100-fold in 200 mM HEPES-TEA pH 7.5 supplemented with 50 mM RbCl (or 50 mM NaCl for the negative control) and with 30 μM of the proton ionophore carbonyl cyanide m-chlorophenyl hydrazone (CCCP). CCCP abolished the proton motive force, avoiding active transport. To monitor K + /Rb + exchange, samples were taken at different time points, cells were treated as described for the K + uptake assay and intracellular K + concentrations were determined using flame photometry.
Complementation assay
Cells harbouring plasmids encoding for KimA and variants thereof were picked from agar KML plates and incubated in 1 mL KML medium supplemented with 100 µg/mL ampicillin at 37 °C shaking at 180 rpm overday. Then, the cells were incubated in 5 mL K30 medium supplemented with 100 µg/mL ampicillin, at 37 °C shaking at 180 rpm overnight. The next day, precultures were washed and centrifuged twice at 4000 × g for 10 min in K0 medium to remove external potassium. After that, 5 mL of different minimal media (K0.01, K0.02, K0.03, K0.05, K0.1, K0.2, K0.5, K1, K3, K10, K30 and K115) each supplemented with 100 µg/mL ampicillin and in the presence of 0.002% arabinose for gene expression were inoculated to an OD 600 of 0.15. The OD 600 was measured hourly for the first 10 h and after 24 h. After 24 h, samples were taken for SDS-PAGE and subsequent Western blotting to analyze the protein production.
Preparation of proteoliposomes
Proteoliposomes were prepared with a standard protocol 34 . Briefly, E. coli polar lipids in chloroform were dried in a rotary evaporator, resuspended to 10 mg/mL and sonicated in a buffer containing 100 mM NaP i pH 7. After three freeze-thaw cycles, large unilamellar vesicles were prepared by extrusion through a 400-nm diameter polycarbonate filter. Liposomes were diluted to 4 mg/mL and destabilized beyond R sat with Triton X-100. DDM-solubilized KimA was added to the liposomes at a weight ratio of 1:50 (protein:lipid), and detergent was subsequently removed by the addition of BioBeads. Proteoliposomes were harvested by centrifugation at 250,000 × g and resuspended to a lipid concentration of 10 mg/mL. After three freeze-thaw cycles, proteoliposomes were stored in liquid nitrogen until use. For the preparation of the empty control liposomes SEC buffer was added to the lipids in the same ratio as the protein.
Fluorescence-based transport assay
Potassium-dependent proton transport was measured with the ΔpH-sensitive fluorophore 9-amino-6-chloro-2-methoxyacridine (ACMA). Proteoliposomes and empty liposomes, respectively, were thawed, extruded through a 400-nm polycarbonate filter, centrifuged and resuspended to a final concentration of 10 mg/mL lipids in 100 mM NaP i pH 7. For the fluorescence measurements, proteoliposomes and empty liposomes were diluted 100-fold into 100 mM KP i pH 7 and 500 nM ACMA. Fluorescence was recorded at an excitation wavelength of 410 nm and emission wavelength of 490 nm in a spectrofluorimeter over time. The K + -coupled H + transport was initiated upon the addition of 500 nM sodium ionophore IV, which initially resulted in a membrane potential of −120 mV and hindered the establishment of an inhibitory positive potential. At the end of each experiment, the proton ionophore CCCP was added to dissipate the membrane potential allowing protein-independent proton fluxes.
Sequence alignment
Sequence conservation of KimA was evaluated by performing an alignment in T-coffee 35 using a list of genes obtained from the BLAST-NCBI server. Due to the low sequence similarity between KimA and members of the KUP family, a model-based sequence alignment between them was performed using the PROMALS3D 36 server. In general, the sequence alignment is a progressive method using database searches, secondary structure predictions, and available or provided 3D structures. For the presented alignments only database searches and secondary structure predictions were applied. The figures were prepared with Jalview 37 . Negative-staining EM Samples of KimA solubilized with DDM or SMA co-polymer were negatively stained for up to 3 min with 1% (w/v) uranyl acetate pH 4. Electron micrographs were acquired with a CCD camera (Gatan Ultrascan 4000) on a Tecnai Spirit at 120 kV under low-dose conditions, at a magnification of 52,000× for a pixel size at the specimen of 2.11 Å. Particles were picked first manually with EMAN boxer 38 and, after generation of appropriate templates by 2D classification in Relion 2.1 39 , automatically using Gautomatch (by Kai Zhang, MRC-LMB). A total of 3110 and 67,292 good particles of KimA in SMA lipid particles (SMALPs) and DDM, respectively, were picked. Two-dimensional class averages were obtained by 2D classification with Relion 2.1.
Cryo-EM specimen preparation and data collection
Cryo-EM grids of KimA in SMALP at 1.1 mg/mL with 50 μM cyclic di-AMP were prepared in a FEI Vitrobot plunge freezer at 10 °C and 90% humidity, using Quantifoil R2/2 holey carbon grids (Quantifoil Micro Tools), pre-treated in chloroform for 1 to 2 h and freshly glow-discharged. The grid was blotted for 9 sec and plunge-frozen in liquid ethane. Images were collected automatically using EPU (Thermo Scientific), on a FEI Titan Krios operating at 300 kV and aligned as previously described 40 , with a Gatan K2 camera in counting mode and with an energy filter. The nominal magnification of 130,000x yielded a pixel size at the specimen of 1.077 Å. Each micrograph was recorded as a movie stack with 40 frames over 8 sec, with a calibrated dose of ~1.77 e – /Å 2 per frame and defocus values between −0.5 and −3.2 μm.
Image processing
A set of 5418 micrographs was collected automatically, of which 4951 were of sufficient quality for processing. Drift correction and dose weighting of each movie stack were performed with MotionCor2 41 . Whole-micrograph CTF was determined with CTFFIND4 42 on drift-corrected, non-dose weighted movies. After manual picking of a small particle set using EMAN boxer 38 , templates were generated (first by 2D classification and later by reprojection of a low-resolution 3D map) for automatic picking by template matching using Gautomatch (by Kai Zhang, MRC-LMB). The initial dataset contained 2,043,209 particles, windowed with a 208 pixels squared box. A low-resolution initial model was generated from ~19,000 particles using the stochastic gradient descent method implemented in Relion 2.1 and low-pass filtered to 60 Å 43 . A reference-free 2D classification with ISAC, within Sphire 44 , was used to discard clear false positives and bad particles, outputting a subset with 1,614,900 particle images. A more homogeneous set of 314,399 particles was identified through two consecutive rounds of 3D classification, with five classes and no symmetry applied, in Relion 3.0 43 . After Bayesian polishing, CTF refinement and beam tilt estimation with Relion 3.0, refinement of this subset with a soft mask and applied C2 symmetry produced a map at 3.8 Å. However, the resolution degraded towards the periphery of the dimer, especially at the cytoplasmic domain, due to small variations in the relative position of the KimA monomers. Since the signal from a single monomer was insufficient for proper alignment, we attempted to identify a particle subset where these deviations were minimized through a 3D classification of the symmetry-expanded dataset (629,798 particles) with three classes, only local searches and a reference map low-pass filtered to 4.5 Å; after every five iterations, the map of each class was aligned to a partial map, composed of one transmembrane domain and one cytoplasmic domain, within Chimera 45 , in order to keep the position of one half of the dimer constant, while the position of the other half drove the classification (a similar approach was implemented in ref. 46 ). The best 3D class contained 198,366 particles. Symmetry expansion was reversed by removal of duplicates, for a total of 149,724 unique particle images. A homogeneous refinement of these particles with cryoSPARC v2 47 produced a map with a nominal resolution of 3.7 Å and improved densities at the periphery. Local resolution was estimated with cryoSPARC v2 47 .
Model building and validation
An homology model of the transmembrane domain of KimA obtained by the Phyre2 server 48 was docked initially into the cryo-EM map using USCF Chimera 45 and used as a starting point for modelling with Coot 49 . The cytoplasmic domain was built de novo. The model was then subjected to an iterative process of real space refinement using Phenix.real_space_refinement 50 with geometry and secondary structure restraints followed by manual inspection and adjustments in Coot 49 . The final model includes 572 residues of the 607 that compose a KimA monomer, lacking the first 26 amino acid residues at the N terminus and residues 480-481, 534-538 and 607 in the cytoplasmic domain. The geometries of the atomic model were evaluated by MolProbity 51 . The translocation pathway and the surface representation were obtained with HOLLOW 52 . Pore radii along the translocation pathway were calculated using HOLE software 53 . pK a calculations were performed with the multiconformation continuum electrostatics (MCCE) program 54 . Figures were prepared with UCSF ChimeraX 55 and PyMOL.
CG simulations
CG simulations of dimeric KimA were run using the CG Martini forcefield 23 , 24 , using the open beta 3.0.b.3.2 version. Additional bonds of 500 kJ mol −1 nm −2 were applied between all protein backbone beads within 1 nm, except for interactions across the extracellular interface of the TM domains, designed to allow inter-domain dynamics and not bias the simulations towards the cryo-EM pose. Initial simulations were run following the MemProtMD protocol 56 , 57 . The input protein was aligned accordingly on the xy plane, and POPE (1-palmitoyl-2-oleoyl-sn-glycero-3-phosphoethanolamine) lipids were placed randomly around the transmembrane region of protein, in a z range of 8 nm. All systems were solvated with Martini waters and Na + and Cl − ions to a neutral charge and 0.15 M. Self-assembly simulations were run to allow the membrane lipids to assemble into a bilayer around the protein. These were minimized using the steepest descents methods, then run over 100 ns in the NPT ensemble, with V-rescale temperature coupling 58 at 323 K and semi-isotropic Berendsen pressure coupling at 1 bar 59 , with positional restraints of 1000 kJ mol −1 nm −2 applied to the backbone beads. Following this, the systems were simulated for a further 4 × 5 µs, using V-rescale temperature coupling at 323 K and a semi-isotropic Parrinello-Rahman barostat 60 . Electrostatics were described using the reaction field method, with a cut-off of 1.1 nm using a potential shift modifier, and van der Waals interactions were shifted from 0.9-1.1 nm. Bonds were constrained using the LINCS algorithm. All simulations were run using Gromacs 2019 61 . Data were analyzed in Gromacs 62 or VMD 63 , as described in the figure legends.
Atomistic simulation
Snapshots of the KimA dimer following 100 ns of restrained CG simulation in a POPC bilayer were converted to the CHARMM36 forcefield 64 following the CG2AT protocol 65 . Systems were solvated with TIP3P water and Na + and Cl − ions to 0.15 M. Electrostatics were handled using the Particle-Mesh-Ewald method, and a force-switch modifier was applied to the Van der Waals forces. Dispersion corrections were turned off. Systems were equilibrated for 2.5 ns with protein backbone restraints, before production simulations were run with V-rescale temperature coupling at 310 K using a time constant of 0.1 ps and Parrinello-Rahman semi-isotropic pressure coupling of 1 bar with a time constant of 2 ps, using 4 fs time steps with virtual-sites on the protein and lipids 66 . All simulations were run in Gromacs 2019 62 . For analyses of dimer stability, three simulations were run for ca. 2 µs to allow for the slower kinetics of dimer rearrangement to occur. For K + ion binding analysis, the K + ions of the structural model were reintroduced to the binding sites, and the system was re-solvated with K + and Cl − ions to 0.15 M. The bound ions and protein backbone were restrained for 1 ns of equilibration, before two production simulations of 135 ns were run, for a total of n = 4 ion binding sites. Reporting summary Further information on research design is available in the Nature Research Reporting Summary linked to this article.
Supplementary information Supplementary Information Peer Review File Reporting Summary
📊 Figures
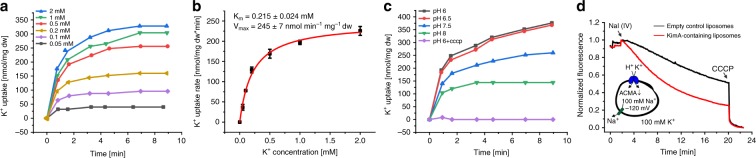
Fig. 1
Functional analysis of KimA.
a Concentration-dependent potassium uptake via KimA into potassium-depleted E. coli LB2003 cells. n =u20093 independent experiments; a representative experiment is shown. b , Kinetic parameters of the...
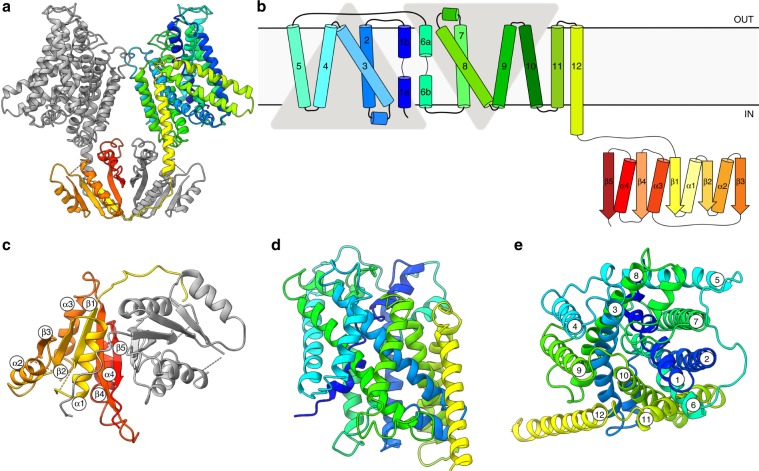
Fig. 2
Overview of the structure of KimA.
a KimA dimer viewed from the membrane, with one monomer coloured in grey and the other in a rainbow, from blue (Nu00a0terminus) to red (Cu00a0terminus). b Schematic representation of the topology of K...
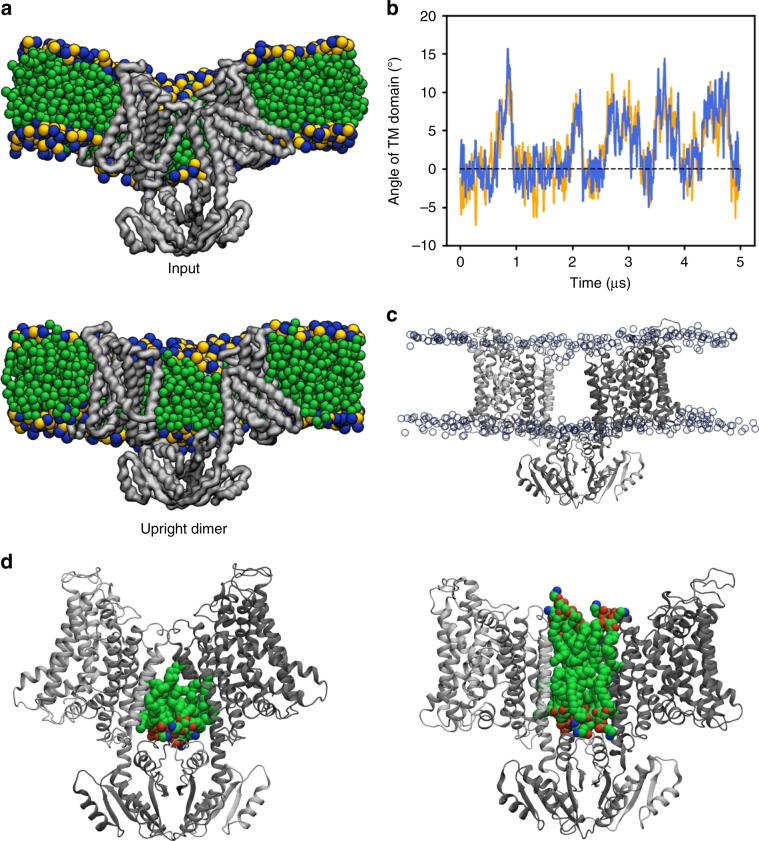
Fig. 3
Molecular dynamics simulations of KimA in a lipid bilayer.
a Cut-away views of KimA dimer in a membrane, taken from theu00a0CG simulation data. The protein backbone is shown as grey surface and the POPE lipids as green, yellow and blue spheres. b Representati...
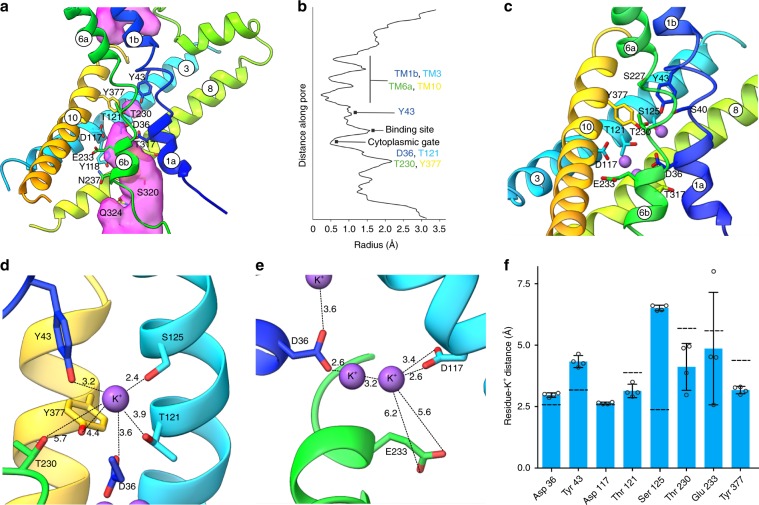
Fig. 4
Structural details of the transmembrane domain.
a The translocation pathway reveals a tightly sealed extracellular side, a wide-open intracellular tunnel and the putative occluded potassium ion binding site, which is separated from the cytoplasm by...
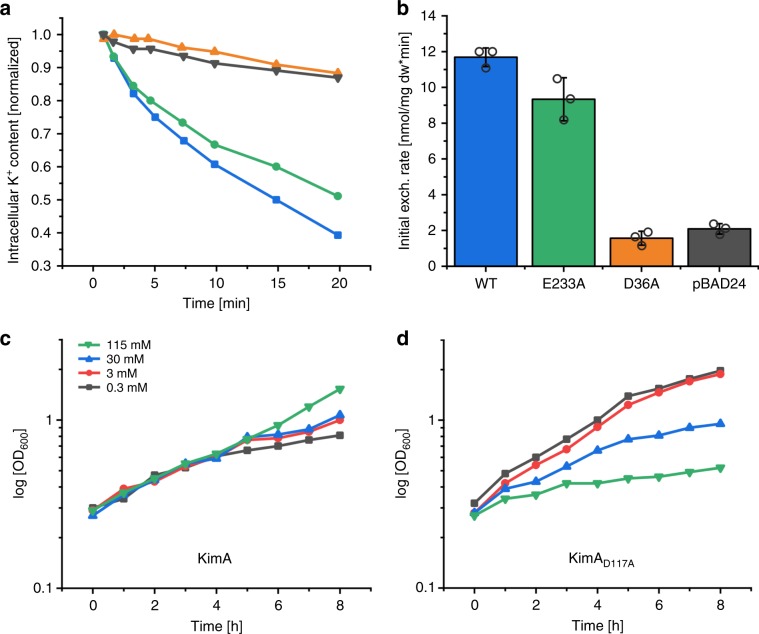
Fig. 5
Involvement of residues in proton coupling or potassium binding or trans-inhibition.
a Time courses of the K + /Rb + exchanges of E. coli LB2003 cells transformed with plasmids encoding wild-type KimA (blue), KimA E233A (green), KimA D36A (orange) or with the empty vector pBAD24 (blac...
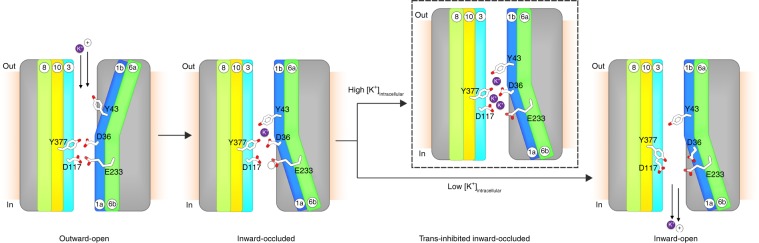
Fig. 6
Schematic representation of alternating access transport in KimA.
The outward-open conformation should provide access of protons and potassium ions from the extracellular side to the binding sites, while at the cytoplasmic side the exit tunnel should be tightly seal...
Figure images are served from the NIH/NLM PubMed Central Open Access Subset or Europe PMC; copyright remains with the publishers and authors.
💬 Discussion
0 commentsNo comments yet. Be the first to start a discussion!
Leave a Comment