Abstract
The CMG helicase is composed of Cdc45, Mcm2-7 and GINS. Here we report the structure of the Saccharomyces cerevisiae CMG, determined by cryo-EM at a resolution of 3.7-4.8 Å. The structure reveals that GINS and Cdc45 scaffold the N tier of the helicase while enabling motion of the AAA+ C tier. CMG exists in two alternating conformations, compact and extended, thus suggesting that the helicase moves like an inchworm. The N-terminal regions of Mcm2-7, braced by Cdc45-GINS, form a rigid platform upon which the AAA+ C domains make longitudinal motions, nodding up and down like an oil-rig pumpjack attached to a stable platform. The Mcm ring is remodeled in CMG relative to the inactive Mcm2-7 double hexamer. The Mcm5 winged-helix domain is inserted into the central channel, thus blocking entry of double-stranded DNA and supporting a steric-exclusion DNA-unwinding model.
🔬 Techniques
🧬 Organisms
🏭 Microscope Brands
📷 Detectors
💻 Software Details
💾 Data Repositories
🏛️ Research Organizations (ROR)
Affiliated research institutions:
📋 Methods
Sample preparation and electron microscopy Saccharomyces cerevisiae
CMG was purified as previously described 16 . To prepare EM grids, we first diluted each sample with 20 mM Tris-Acetate (pH 7.5), 40 mM K-Glutamate, 2 mM DTT and 0.1 mM EDTA. Before EM grid preparation of CMG, we checked the sample homogeneity by negative-stain electron microscopy. Then we applied 3 µl of CMG sample at a final concentration of 0.6 mg/ml to glow-discharged C-flat 1.2/1/3 holey carbon grids, incubated for 10 s at 6 °C and 90% humidity, blotted for 3 s then plunged into liquid ethane using an FEI Vitrobot IV. We loaded the grids into an FEI Titian Krios electron microscope at 300 keV and collected images automatically using low-dose mode at a magnification of ×29,000 and a pixel size of 1.01 Å per pixel. A Gatan K2 summit direct electron detector was used for image recording with a defocus range from 1.5 to 3.5 µ under super resolution mode. The dose rate was 10 electrons per Å 2 per second and total exposure time was 5 seconds. The total dose was divided into a 25-frame movie and each frame was exposed for 0.2 s. Image processing and 3D reconstruction Approximately 8000 raw movie micrographs were collected. The movie frames were first aligned and superimposed by the program motioncorr 53 . Contrast transfer function parameters of each aligned micrograph were calculated using the program CTFFIND4 54 . All the remaining steps, including particle autoselection, 2D classification, 3D classification, 3D refinement, and density map post-processing were performed using Relion-1.3 or Relion-1.4 55 , 56 . We manually picked ~10,000 particles from different views to generate 2D averages, which were used as templates for subsequent automatic particle selection. Automatic particle selection was then performed for the entire data set. About one million particles were initially selected. Particles were then sorted by similarity to the 2D references; the 10% of particles with the lowest z-scores were deleted from the particle pool. 2D classification of all remaining particles was performed and particles in unrecognizable classes by visual inspection were removed. A total of 687,794 particles were used for 3D classification. We derived six 3D models from the dataset, and found three models were similar to each other and their associated particles were combined for further refinement; the other three models were distorted and those particles were discarded, leading to a dataset size of 469,818 particles. This final dataset was used for further 3D refinement, resulting in a 3.8 Å 3D density map. The resolution of the map was estimated by the so-called gold-standard Fourier shell correlation, at the correlation cutoff value of 0.143. The 3D density maps were corrected for the detector modulation transfer function and sharpened by applying a negative B-factor of −144 Å 2 . The particles had some preference for end-on views but because of the large number of particles used virtually all of the angular space was well sampled. In order to improve the density of the flexible C-terminal AAA+ ring of Mcm 2-7, we performed a “focused” 3D classification procedure. We first generated two soft-edge masks, one from the Mcm2-7 CTD ring region and the other from the entire CMG complex. Subtraction of the Mcm2-7 CTD ring mask from the entire CMG complex mask was performed using relion_image_handler from which we obtained a mask that only covered the Mcm2-7 NTD ring, GINS, and Cdc45. This mask was then applied to the 3.8 Å density map. The resulting masked map without the Mcm 2-7 CTD ring was used to subtract that region from the original particles, and 3D classification was performed on the Mcm 2-7 CTD ring only particles without further image alignment. Two distinct conformations were found: the CTD ring of conformer I was “tilted” compared to the NTD ring, while conformer II had roughly “parallel” CTD and NTD rings. These two maps were further refined resulting in two 3D maps with an estimated resolution of 4.7 Å and 4.8 Å, respectively. Local resolution estimation was calculated using ResMap. Model building, refinement, and validation The initial model of S. cerevisiae Cdc45 was built by Rosetta based on the extracted density map, using homolog RecJ as a reference 35 , 57 . The fold of this model was essentially the same as the crystal structure of human Cdc45 (personal communication, Luca Pellegrini, University of Cambridge). The initial models of the S. cerevisiae GINS subunits were generated from the crystal structure of the human GINS complex (PDB ID: 2Q9Q) 22 using the SWISS-MODEL server 58 . Six NTDs of the yeast Mcm2-7 were directly extracted from the cryo-EM structure of the yeast Mcm2-7 double hexamer (PDB code 3JA8) 13 . These models were docked into the 3.7-Å resolution 3D density map of Cdc45-GINS-Mcm2-7 NTD-tier ring in COOT 59 , and fitted into the density using Chimera 60 . After assignment of the models, remaining density corresponded to the C-terminal B-domain of Psf1, which was absent from the crystal structure. We manually built this domain de novo from a poly-Ala model. Then the entire atomic model was manually adjusted and built in COOT. Clearly resolved bulky residues such as Phe, Tyr, Trp, and Arg were crucial for sequence registration. The manually built structure was then refined in real space by phenix.real_space_refine 61 and manually adjusted in COOT. The reciprocal space refinement was also performed by Phenix 62 , with secondary structure and stereochemical constraints applied. The structure factors (including phases) were obtained from the Fourier transform of the experimental density map by phenix.map_to_structure_factors. The atomic models were validated by MolProbity with a percentile score of 95-97%. The final model was cross validated using a method described previously 63 . We randomly added 0.1 Å noise to the coordinates of the final model using the PDB tools in Phenix, then refined the noise-added against the first half map (Half1) that was produced from one half of the particle dataset during refinement by RELION. We performed one round of coordinate refinement, followed by a B-factor refinement. The refined model was then correlated with the 3D maps of the two half maps (Half1, Half2) in Fourier space to produce two FSC curves: FSC work (model versus Half1 map) and FSC free (model versus Half2 map), respectively. A third FSC curve was calculated between the refined model and the final 3.7-Å resolution density map produced from all particles. The general agreement of these curves was taken as an indication that the model was not over-fitted. To build the complete models for CMG conformers I (4.8 Å) and II (4.7 Å), we first used the SWISS-MODEL server to derive two WHD models of MCM5 and MCM6, based on the crystal structure of a GntR family transcriptional regulator (PDB code 3C7J) and NMR structure of WHD of the human MCM6 (PDB code 2KLQ) 64 , respectively. We then fitted them along with the above-built model of Cdc45-GINS-Mcm2-7 N-tier ring, and the six CT AAA+ domain structure extracted from the cryo-EM structure of yeast Mcm2-7 (PDB code 3JA8), in COOT and Chimera. The structures were then refined in Phenix and manually adjusted in COOT. All modeled structures were validated using MolProbity 65 . Structural figures were prepared in Chimera and Pymol ( https://www.pymol.org ).
Show full methods section
Sample preparation and electron microscopy Saccharomyces cerevisiae
CMG was purified as previously described 16 . To prepare EM grids, we first diluted each sample with 20 mM Tris-Acetate (pH 7.5), 40 mM K-Glutamate, 2 mM DTT and 0.1 mM EDTA. Before EM grid preparation of CMG, we checked the sample homogeneity by negative-stain electron microscopy. Then we applied 3 µl of CMG sample at a final concentration of 0.6 mg/ml to glow-discharged C-flat 1.2/1/3 holey carbon grids, incubated for 10 s at 6 °C and 90% humidity, blotted for 3 s then plunged into liquid ethane using an FEI Vitrobot IV. We loaded the grids into an FEI Titian Krios electron microscope at 300 keV and collected images automatically using low-dose mode at a magnification of ×29,000 and a pixel size of 1.01 Å per pixel. A Gatan K2 summit direct electron detector was used for image recording with a defocus range from 1.5 to 3.5 µ under super resolution mode. The dose rate was 10 electrons per Å 2 per second and total exposure time was 5 seconds. The total dose was divided into a 25-frame movie and each frame was exposed for 0.2 s. Image processing and 3D reconstruction Approximately 8000 raw movie micrographs were collected. The movie frames were first aligned and superimposed by the program motioncorr 53 . Contrast transfer function parameters of each aligned micrograph were calculated using the program CTFFIND4 54 . All the remaining steps, including particle autoselection, 2D classification, 3D classification, 3D refinement, and density map post-processing were performed using Relion-1.3 or Relion-1.4 55 , 56 . We manually picked ~10,000 particles from different views to generate 2D averages, which were used as templates for subsequent automatic particle selection. Automatic particle selection was then performed for the entire data set. About one million particles were initially selected. Particles were then sorted by similarity to the 2D references; the 10% of particles with the lowest z-scores were deleted from the particle pool. 2D classification of all remaining particles was performed and particles in unrecognizable classes by visual inspection were removed. A total of 687,794 particles were used for 3D classification. We derived six 3D models from the dataset, and found three models were similar to each other and their associated particles were combined for further refinement; the other three models were distorted and those particles were discarded, leading to a dataset size of 469,818 particles. This final dataset was used for further 3D refinement, resulting in a 3.8 Å 3D density map. The resolution of the map was estimated by the so-called gold-standard Fourier shell correlation, at the correlation cutoff value of 0.143. The 3D density maps were corrected for the detector modulation transfer function and sharpened by applying a negative B-factor of −144 Å 2 . The particles had some preference for end-on views but because of the large number of particles used virtually all of the angular space was well sampled. In order to improve the density of the flexible C-terminal AAA+ ring of Mcm 2-7, we performed a “focused” 3D classification procedure. We first generated two soft-edge masks, one from the Mcm2-7 CTD ring region and the other from the entire CMG complex. Subtraction of the Mcm2-7 CTD ring mask from the entire CMG complex mask was performed using relion_image_handler from which we obtained a mask that only covered the Mcm2-7 NTD ring, GINS, and Cdc45. This mask was then applied to the 3.8 Å density map. The resulting masked map without the Mcm 2-7 CTD ring was used to subtract that region from the original particles, and 3D classification was performed on the Mcm 2-7 CTD ring only particles without further image alignment. Two distinct conformations were found: the CTD ring of conformer I was “tilted” compared to the NTD ring, while conformer II had roughly “parallel” CTD and NTD rings. These two maps were further refined resulting in two 3D maps with an estimated resolution of 4.7 Å and 4.8 Å, respectively. Local resolution estimation was calculated using ResMap. Model building, refinement, and validation The initial model of S. cerevisiae Cdc45 was built by Rosetta based on the extracted density map, using homolog RecJ as a reference 35 , 57 . The fold of this model was essentially the same as the crystal structure of human Cdc45 (personal communication, Luca Pellegrini, University of Cambridge). The initial models of the S. cerevisiae GINS subunits were generated from the crystal structure of the human GINS complex (PDB ID: 2Q9Q) 22 using the SWISS-MODEL server 58 . Six NTDs of the yeast Mcm2-7 were directly extracted from the cryo-EM structure of the yeast Mcm2-7 double hexamer (PDB code 3JA8) 13 . These models were docked into the 3.7-Å resolution 3D density map of Cdc45-GINS-Mcm2-7 NTD-tier ring in COOT 59 , and fitted into the density using Chimera 60 . After assignment of the models, remaining density corresponded to the C-terminal B-domain of Psf1, which was absent from the crystal structure. We manually built this domain de novo from a poly-Ala model. Then the entire atomic model was manually adjusted and built in COOT. Clearly resolved bulky residues such as Phe, Tyr, Trp, and Arg were crucial for sequence registration. The manually built structure was then refined in real space by phenix.real_space_refine 61 and manually adjusted in COOT. The reciprocal space refinement was also performed by Phenix 62 , with secondary structure and stereochemical constraints applied. The structure factors (including phases) were obtained from the Fourier transform of the experimental density map by phenix.map_to_structure_factors. The atomic models were validated by MolProbity with a percentile score of 95-97%. The final model was cross validated using a method described previously 63 . We randomly added 0.1 Å noise to the coordinates of the final model using the PDB tools in Phenix, then refined the noise-added against the first half map (Half1) that was produced from one half of the particle dataset during refinement by RELION. We performed one round of coordinate refinement, followed by a B-factor refinement. The refined model was then correlated with the 3D maps of the two half maps (Half1, Half2) in Fourier space to produce two FSC curves: FSC work (model versus Half1 map) and FSC free (model versus Half2 map), respectively. A third FSC curve was calculated between the refined model and the final 3.7-Å resolution density map produced from all particles. The general agreement of these curves was taken as an indication that the model was not over-fitted. To build the complete models for CMG conformers I (4.8 Å) and II (4.7 Å), we first used the SWISS-MODEL server to derive two WHD models of MCM5 and MCM6, based on the crystal structure of a GntR family transcriptional regulator (PDB code 3C7J) and NMR structure of WHD of the human MCM6 (PDB code 2KLQ) 64 , respectively. We then fitted them along with the above-built model of Cdc45-GINS-Mcm2-7 N-tier ring, and the six CT AAA+ domain structure extracted from the cryo-EM structure of yeast Mcm2-7 (PDB code 3JA8), in COOT and Chimera. The structures were then refined in Phenix and manually adjusted in COOT. All modeled structures were validated using MolProbity 65 . Structural figures were prepared in Chimera and Pymol ( https://www.pymol.org ).
Supplementary Material 1 2
📊 Figures
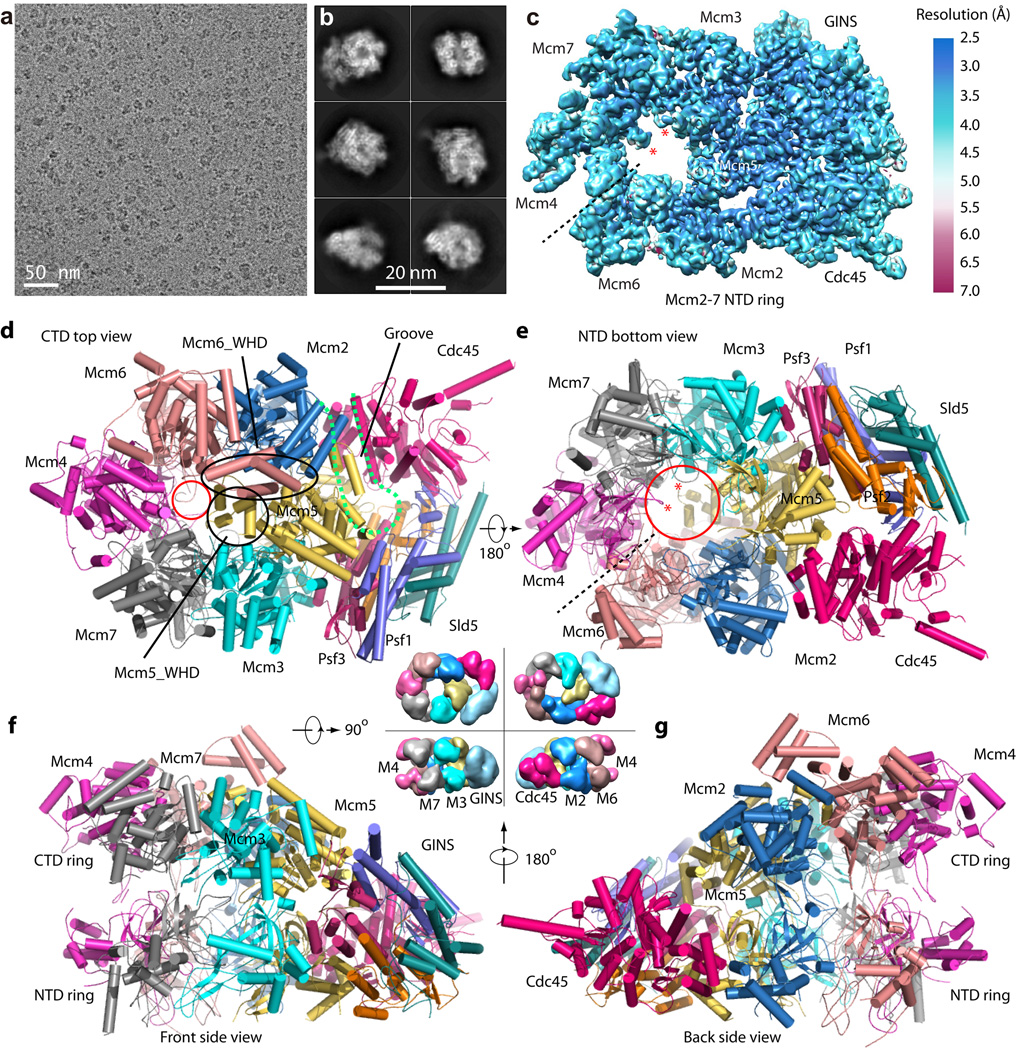
Figure 1
Cryo-EM and overall structure of the S. cerevisiae CMG complex
( a ) A typical motion-corrected raw image of frozen CMG particles recorded on a direct detector. ( b ) Selected six 2D averages representing the particles in different views. ( c ) 3D cryo-EM map of ...
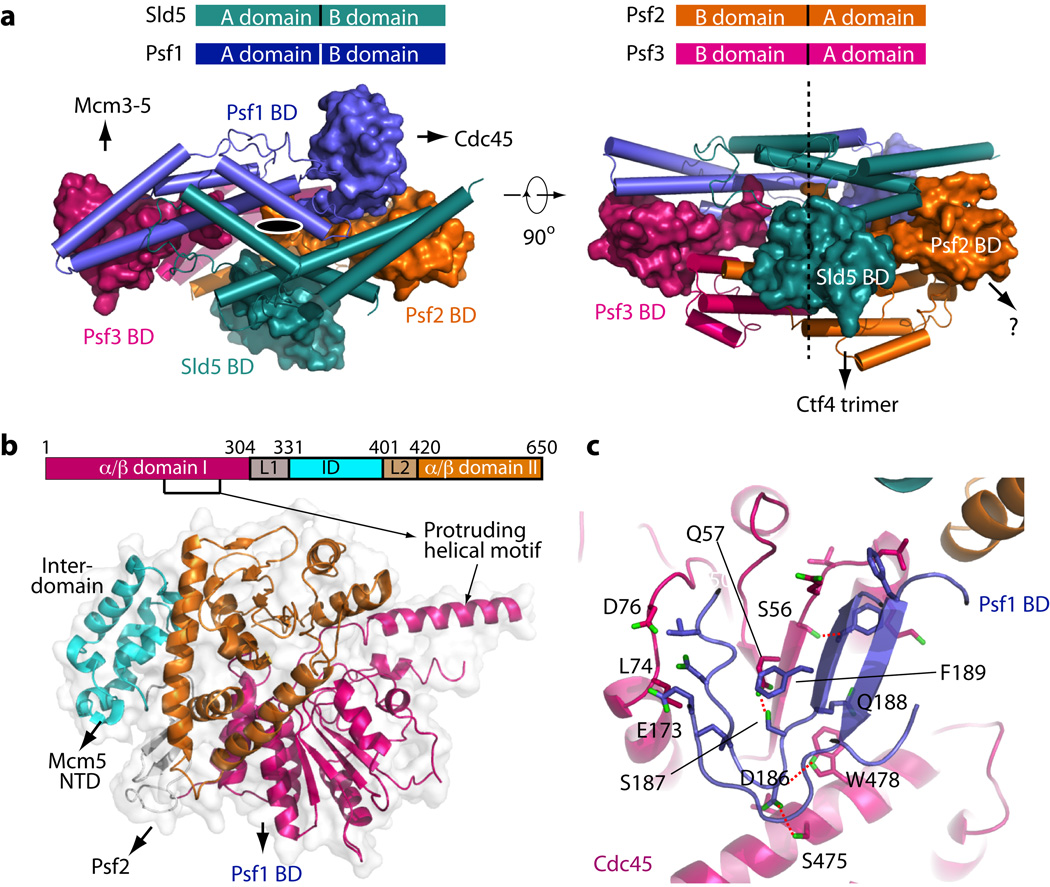
Figure 2
Structure and interactions of the yeast GINS and Cdc45
( a ) The full-length GINS structure in top and side views. Domain A is shown in cartoon, and domain B in surface. The top sketch shows that all four subunits have a similar two-domain architecture, b...
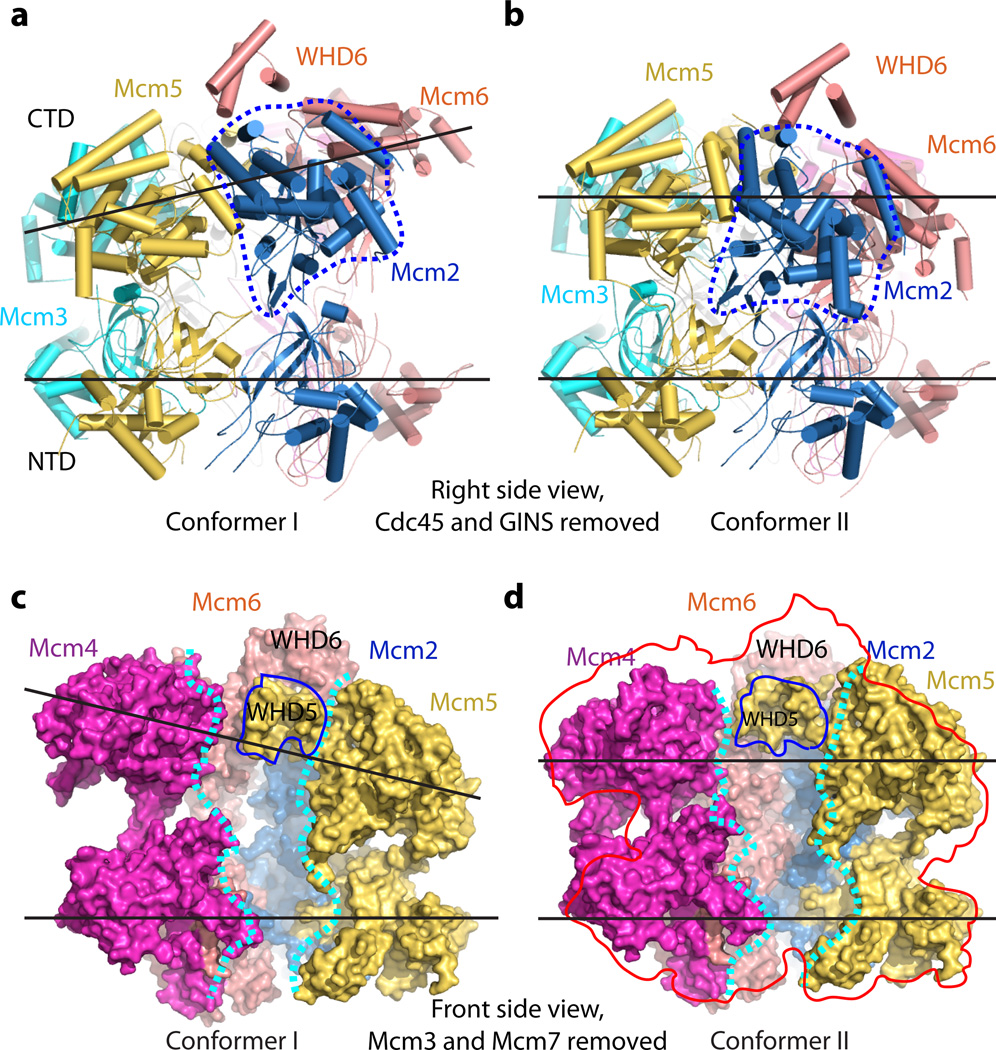
Figure 3
Side-by-side comparison of conformer I and conformer II in the Mcm2-7 region of CMG helicase
( au2013b ) Comparison of the two conformations shown in cartoon representation and viewed from the right side, from Cdc45 and GINS (which are both removed for clarity) with the CTD motor ring on top ...
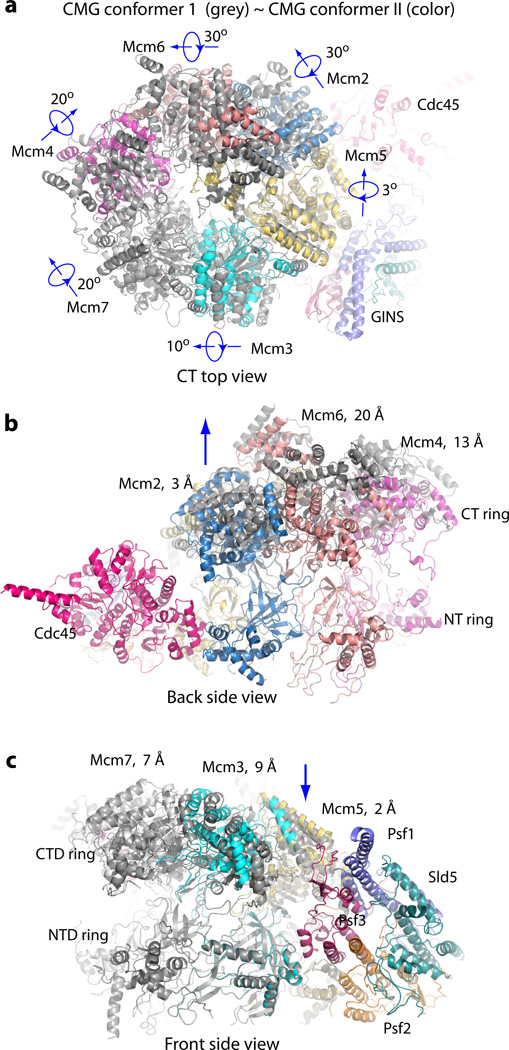
Figure 4
Superposition of CMG conformers I and II
( a ) Top view, ( b ) back side view showing the movement of the Mcm2-6-4 half motor ring, and ( c ) Front side view showing the smaller movements of the Mcm 5-3-7 half ring. Conformer I is shown in d...
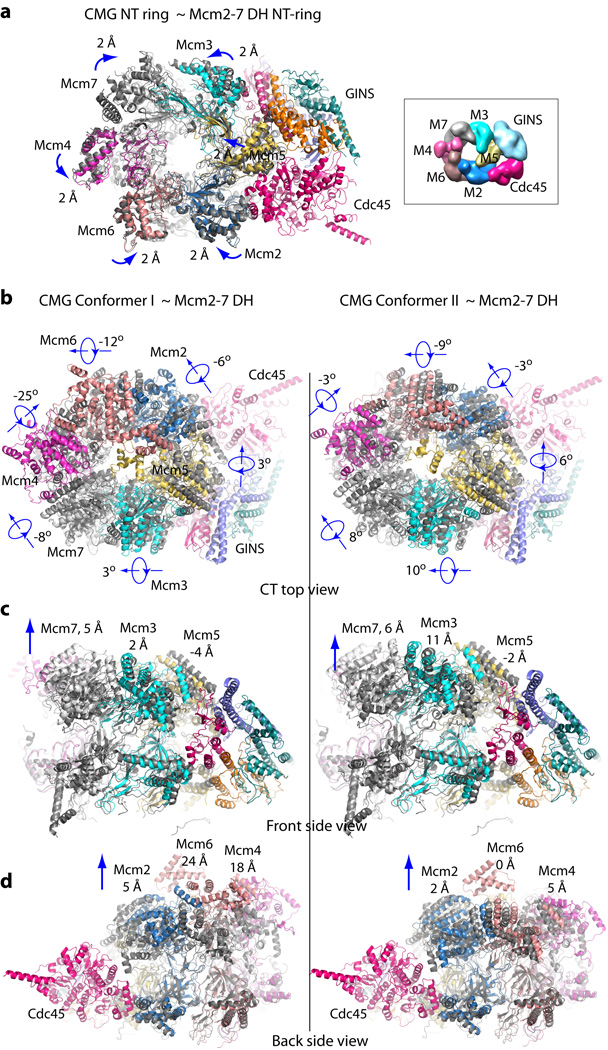
Figure 5
Remodeling changes between the Mcm2-7 in the double-hexamer (DH) and in the active CMG conformers
( a ) Superimposition of the Mcm2-7 NTD-tier ring of CMG (color cartoon representation) with that of the inactive double-hexamer (gray cartoon representation). The double-hexamer Mcm2-7 structure is (...
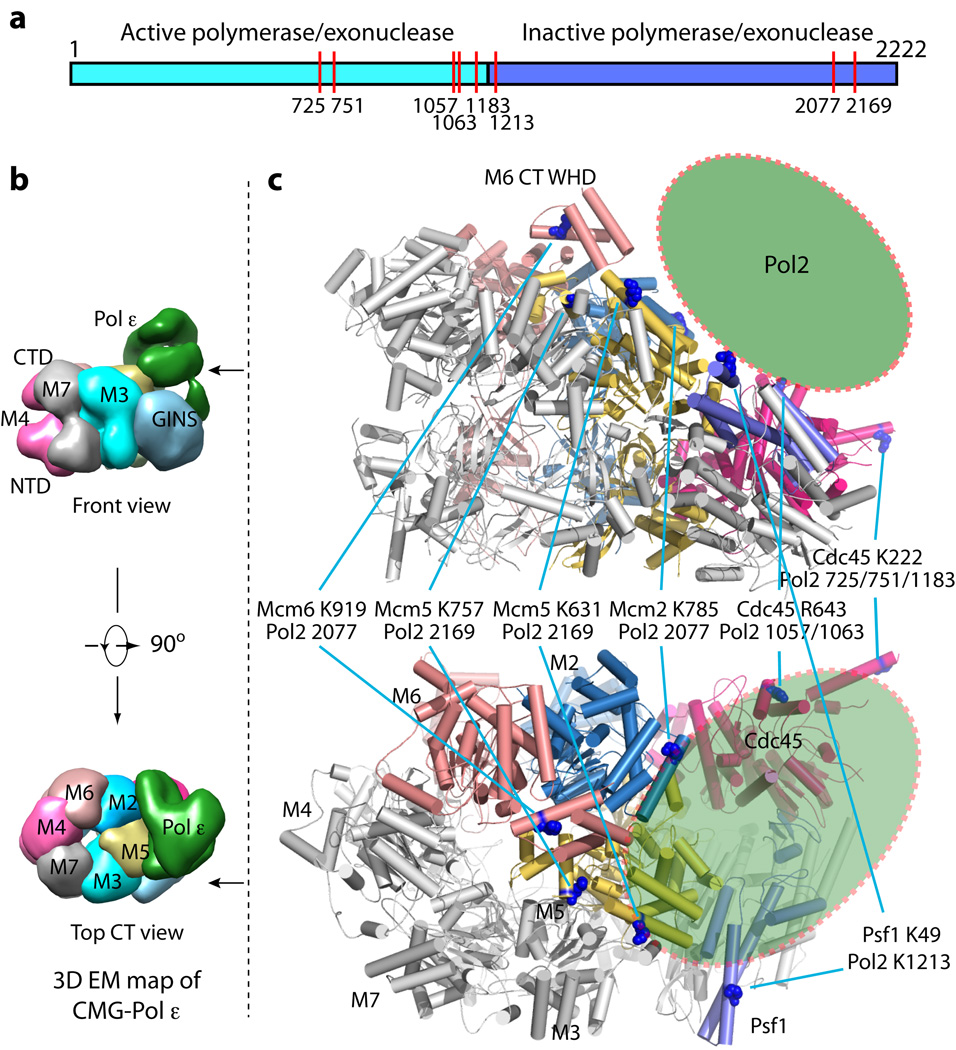
Figure 6
Pol2 footprint on the atomic model of CMG helicase
(a) The two-domain architecture of Pol2, the catalytic subunit of the Pol u03b5 complex. The N-terminal half contains the polymerase and exonuclease activities. The C-terminal half is homologous to a ...
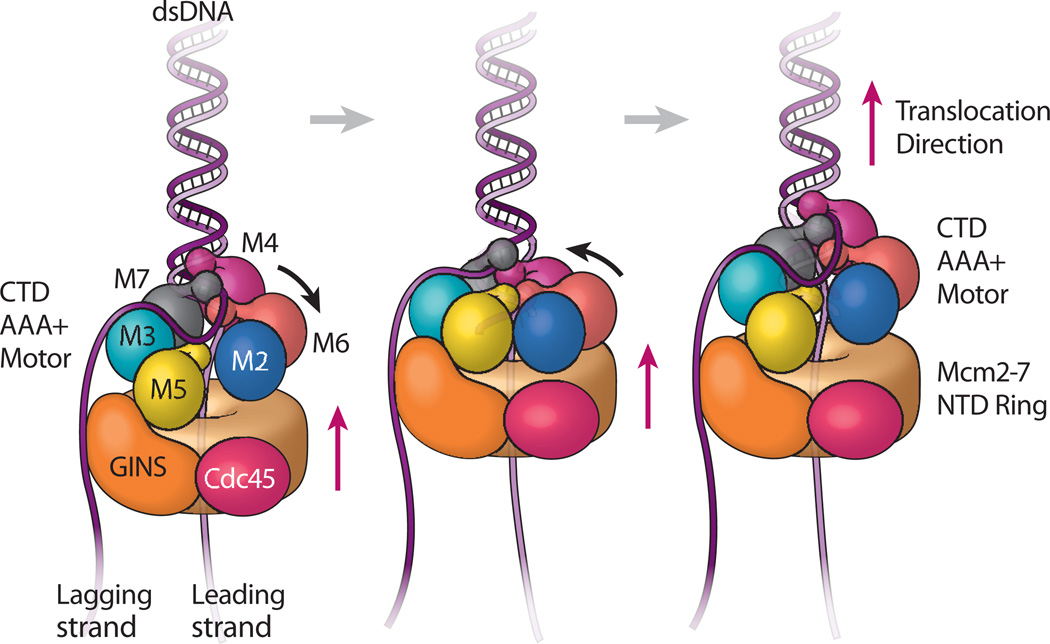
Figure 7
Nodding pumpjack model of CMG translocation
The leading strand (light purple) goes through the Mcm2-7 ring while the lagging strand (dark purple) is excluded to the outside. The Mcm2-7 is composed of the CTD AAA+ motor ring (subunits labeled an...
Figure images are served from the NIH/NLM PubMed Central Open Access Subset or Europe PMC; copyright remains with the publishers and authors.
💬 Discussion
0 commentsNo comments yet. Be the first to start a discussion!
Leave a Comment