Abstract
The fundamental morphology of the endometrial glands is not sufficiently understood by 2D observation because these glands have complicated winding and branching patterns. To construct a large picture of the endometrial gland structure, we performed tissue-clearing-based 3D imaging of human uterine endometrial tissue. Our 3D immunohistochemistry and layer analyses revealed that the endometrial glands form a plexus network in the stratum basalis and expand horizontally along the muscular layer, similar to the rhizome of grass. We then extended our method to assess the 3D morphology of tissue affected by adenomyosis, a representative "endometrium-related disease," and observed its 3D morphological features, including the direct invasion of endometrial glands into the myometrium and an ant colony-like network of ectopic endometrial glands within the myometrium. Thus, further understanding of the morphology of the human endometrium based on 3D analysis will lead to the identification of the pathogenesis of endometrium-related diseases.
🔬 Techniques
🔭 Microscopes
✨ Fluorophores
🧪 Sample Preparation
🔬 Cell Lines
🏭 Microscope Brands
💻 Software Details
💾 Data Repositories
🏛️ Research Organizations (ROR)
Affiliated research institutions:
📋 Methods
Tissue clearing and 3D imaging of human uterine tissue by the updated CUBIC protocol To clear human uterine endometrial tissue, we applied CUBIC protocol IV, which was previously utilized for clearing human brain tissue ( Figure 1 A) ( Tainaka et al., 2018 ). We collected 20 uterine endometrial samples from 16 patients who underwent hysterectomy due to gynecological diseases with no lesions in the endometrium ( Figure 1 B and Table 1 ). With CUBIC protocol IV, we succeeded in substantially clearing all 20 human uterine endometrial tissues ( Figure 1 C). The autofluorescence signal derived from collagen and elastic fibers ( Hong et al., 2020 ; Zhao et al., 2020 ) was useful for observing the intact 3D structure of the uterine endometrial tissue by LSF microscopy ( Figure 1 D, left panel). We added immunostaining with a fluorescently labeled anti-cytokeratin (CK)7 antibody to highlight the endometrial gland structure. Immunohistochemical staining with the anti-CK7 antibody demonstrated selective labeling of the luminal and glandular epithelial cells running through the endometrial stroma with single-cell resolution ( Figures 1 D and S1 ). By 3D reconstitution of the LSF microscopy images of the CK7-stained human endometrium, we succeeded in visualizing the detailed 3D structure of the endometrial glands ( Figure 1 E). Our stereoscopic image made it possible to analyze free-angle images of tissue cross sections. As shown in Figure 1 F, the XY slice of uterine endometrial tissue subjected to the CUBIC protocol retained the characteristic 2D morphology of the endometrial glands for each phase, namely, curving glands in the proliferative phase and serrated glands in the secretory phase. The 3D image reconstituted by Imaris software (Bitplane) enabled us to observe continuous tomographic images of the human endometrium in all directions ( Video S1 ). Figure 1 Tissue clearing and 3D imaging of human uterine tissue using CUBIC (A) Schematic diagram of the clearing and immunostaining protocol for human uterine tissue. (B) Sampling site (yellow box) of human uterine tissue from subject E2. (C) Clearing performance of CUBIC protocol IV for human uterine tissue from subject E2. (D) 3D images of tissue from subject E2 stained with Alexa Fluor 555-conjugated anti-CK7 antibody with clearing by CUBIC. (E) Magnified 3D image of tissue from subject E2 demonstrating numerous glands as well as luminal epithelium and myometrium. (F) Comparison between a microscopic H&E-stained image and the reconstituted XY-plane image after clearing by CUBIC. Upper panels: images of endometrium in the proliferative phase (subject E1). Lower panels: images of endometrium in the secretory phase (subject E8). XY-plane optical slices (subject E1, z = 7.62 μm; subject E8, z = 6.61 μm). (D–F) Images obtained by LSF microscopy. Autofluorescence was measured by excitation at 488 nm. CK7-expressing endometrial epithelial cells were measured by excitation at 532 nm. RT, room temperature; Autofluo, autofluorescence; CK7, cytokeratin 7; FFPE, formalin-fixed paraffin-embedded; H&E, hematoxylin and eosin. See also Figure S1 and Video S1 . Table 1 Clinical characteristics of the subjects Subject number Age Clinical diagnosis Menstrual cycle Gravidity Parity Body mass index E1 30 Cervical cancer (ⅠA1) Proliferative phase 1 1 34.1 E2 39 Cervical cancer (ⅠB1) Proliferative phase 3 2 17.9 E3 43 Pelvic organ prolapse Proliferative phase 1 1 23.8 E4 46 Myoma uteri Proliferative phase 0 0 25.0 E5-1, 2 42 Myoma uteri Secretory phase 4 2 20.7 E6 44 Myoma uteri, pelvic organ prolapse Secretory phase 1 1 22.8 E7 44 Myoma uteri Secretory phase 0 0 29.9 E8 46 Ovarian tumor Secretory phase 5 4 22.5 E9 46 Cervical cancer (ⅠB1) Secretory phase 1 1 17.8 E10 49 Myoma uteri, pelvic organ prolapse Secretory phase 3 3 20.9 E11-1, 2 45 Myoma uteri Menstrual phase 3 3 28.7 E12 48 Myoma uteri Menstrual phase 0 0 25.2 E13-1, 2 43 Myoma uteri Menstrual phase 3 3 29.2 E14 45 Cervical intraepithelial neoplasia 3 Menstrual phase 0 0 20.2 E15-1, 2 49 Myoma uteri Menstrual phase 2 2 38.9 E16 50 Myoma uteri Menstrual phase 2 2 23.5 A1 42 Adenomyosis Secretory phase 2 0 21.2 A2 45 Adenomyosis Secretory phase 0 0 23.8 A3 42 Adenomyosis Undergoing GnRH agonist treatment 2 1 26.4 A4 42 Adenomyosis Proliferative phase 1 0 20.0 GnRH, gonadotropin-releasing hormone. Video S1. Reconstructed 3D image of proliferative-phase, full-thickness human endometrial tissue (subject E2), related to Figure 1 The sample was stained with CK7 (yellow) and showed autofluorescence (blue). z stack (XY-plane view): 100 μm.
Show full methods section
Tissue clearing and 3D imaging of human uterine tissue by the updated CUBIC protocol To clear human uterine endometrial tissue, we applied CUBIC protocol IV, which was previously utilized for clearing human brain tissue ( Figure 1 A) ( Tainaka et al., 2018 ). We collected 20 uterine endometrial samples from 16 patients who underwent hysterectomy due to gynecological diseases with no lesions in the endometrium ( Figure 1 B and Table 1 ). With CUBIC protocol IV, we succeeded in substantially clearing all 20 human uterine endometrial tissues ( Figure 1 C). The autofluorescence signal derived from collagen and elastic fibers ( Hong et al., 2020 ; Zhao et al., 2020 ) was useful for observing the intact 3D structure of the uterine endometrial tissue by LSF microscopy ( Figure 1 D, left panel). We added immunostaining with a fluorescently labeled anti-cytokeratin (CK)7 antibody to highlight the endometrial gland structure. Immunohistochemical staining with the anti-CK7 antibody demonstrated selective labeling of the luminal and glandular epithelial cells running through the endometrial stroma with single-cell resolution ( Figures 1 D and S1 ). By 3D reconstitution of the LSF microscopy images of the CK7-stained human endometrium, we succeeded in visualizing the detailed 3D structure of the endometrial glands ( Figure 1 E). Our stereoscopic image made it possible to analyze free-angle images of tissue cross sections. As shown in Figure 1 F, the XY slice of uterine endometrial tissue subjected to the CUBIC protocol retained the characteristic 2D morphology of the endometrial glands for each phase, namely, curving glands in the proliferative phase and serrated glands in the secretory phase. The 3D image reconstituted by Imaris software (Bitplane) enabled us to observe continuous tomographic images of the human endometrium in all directions ( Video S1 ). Figure 1 Tissue clearing and 3D imaging of human uterine tissue using CUBIC (A) Schematic diagram of the clearing and immunostaining protocol for human uterine tissue. (B) Sampling site (yellow box) of human uterine tissue from subject E2. (C) Clearing performance of CUBIC protocol IV for human uterine tissue from subject E2. (D) 3D images of tissue from subject E2 stained with Alexa Fluor 555-conjugated anti-CK7 antibody with clearing by CUBIC. (E) Magnified 3D image of tissue from subject E2 demonstrating numerous glands as well as luminal epithelium and myometrium. (F) Comparison between a microscopic H&E-stained image and the reconstituted XY-plane image after clearing by CUBIC. Upper panels: images of endometrium in the proliferative phase (subject E1). Lower panels: images of endometrium in the secretory phase (subject E8). XY-plane optical slices (subject E1, z = 7.62 μm; subject E8, z = 6.61 μm). (D–F) Images obtained by LSF microscopy. Autofluorescence was measured by excitation at 488 nm. CK7-expressing endometrial epithelial cells were measured by excitation at 532 nm. RT, room temperature; Autofluo, autofluorescence; CK7, cytokeratin 7; FFPE, formalin-fixed paraffin-embedded; H&E, hematoxylin and eosin. See also Figure S1 and Video S1 . Table 1 Clinical characteristics of the subjects Subject number Age Clinical diagnosis Menstrual cycle Gravidity Parity Body mass index E1 30 Cervical cancer (ⅠA1) Proliferative phase 1 1 34.1 E2 39 Cervical cancer (ⅠB1) Proliferative phase 3 2 17.9 E3 43 Pelvic organ prolapse Proliferative phase 1 1 23.8 E4 46 Myoma uteri Proliferative phase 0 0 25.0 E5-1, 2 42 Myoma uteri Secretory phase 4 2 20.7 E6 44 Myoma uteri, pelvic organ prolapse Secretory phase 1 1 22.8 E7 44 Myoma uteri Secretory phase 0 0 29.9 E8 46 Ovarian tumor Secretory phase 5 4 22.5 E9 46 Cervical cancer (ⅠB1) Secretory phase 1 1 17.8 E10 49 Myoma uteri, pelvic organ prolapse Secretory phase 3 3 20.9 E11-1, 2 45 Myoma uteri Menstrual phase 3 3 28.7 E12 48 Myoma uteri Menstrual phase 0 0 25.2 E13-1, 2 43 Myoma uteri Menstrual phase 3 3 29.2 E14 45 Cervical intraepithelial neoplasia 3 Menstrual phase 0 0 20.2 E15-1, 2 49 Myoma uteri Menstrual phase 2 2 38.9 E16 50 Myoma uteri Menstrual phase 2 2 23.5 A1 42 Adenomyosis Secretory phase 2 0 21.2 A2 45 Adenomyosis Secretory phase 0 0 23.8 A3 42 Adenomyosis Undergoing GnRH agonist treatment 2 1 26.4 A4 42 Adenomyosis Proliferative phase 1 0 20.0 GnRH, gonadotropin-releasing hormone. Video S1. Reconstructed 3D image of proliferative-phase, full-thickness human endometrial tissue (subject E2), related to Figure 1 The sample was stained with CK7 (yellow) and showed autofluorescence (blue). z stack (XY-plane view): 100 μm.
Materials availability
The data on the 3D histology of the human uterine endometrium and endometrium-related diseases are freely available at TRUE (Three-dimensional Representation of human Uterine Endometrium), the website of our database ( https://true.med.niigata-u.ac.jp/ ).
Methods
All methods can be found in the accompanying transparent methods supplemental file .
Supplemental information Document S1. Transparent methods, Figures S1–S8, and Tables S1–S3
📊 Figures
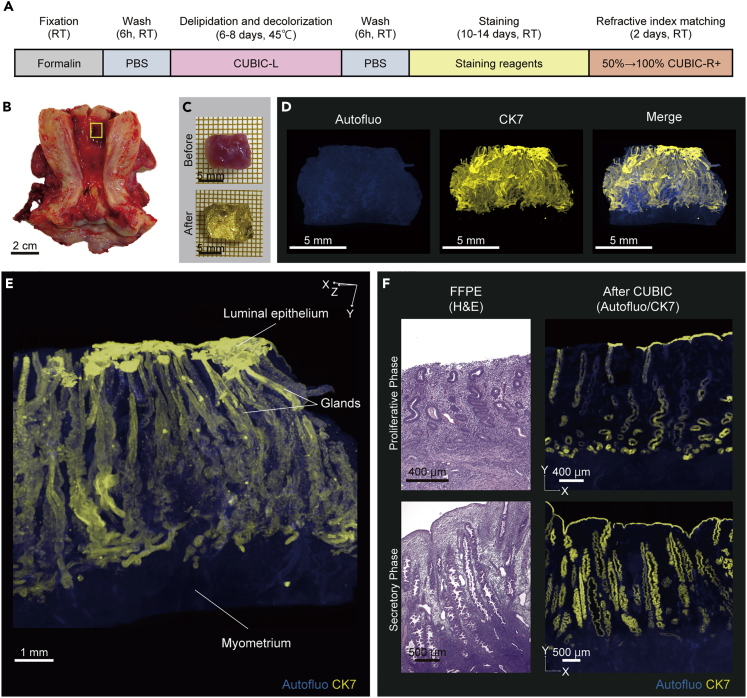
Figureu00a01
Tissue clearing and 3D imaging of human uterine tissue using CUBIC (A) Schematic diagram of the clearing and immunostaining protocol for human uterine tissue. (B) Sampling site (yellow box) of human u...
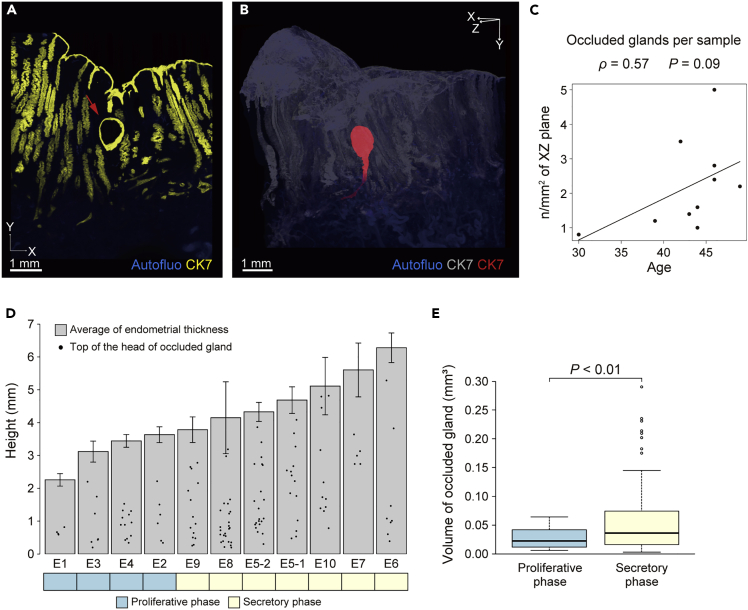
Figureu00a02
Morphology of occluded human endometrial glands (A and B) An occluded gland (subject E8). (A) Reconstructed XY-plane images (zu00a0= 99u00a0u03bcm). The red arrow indicates an occluded gland. (B) 3D d...
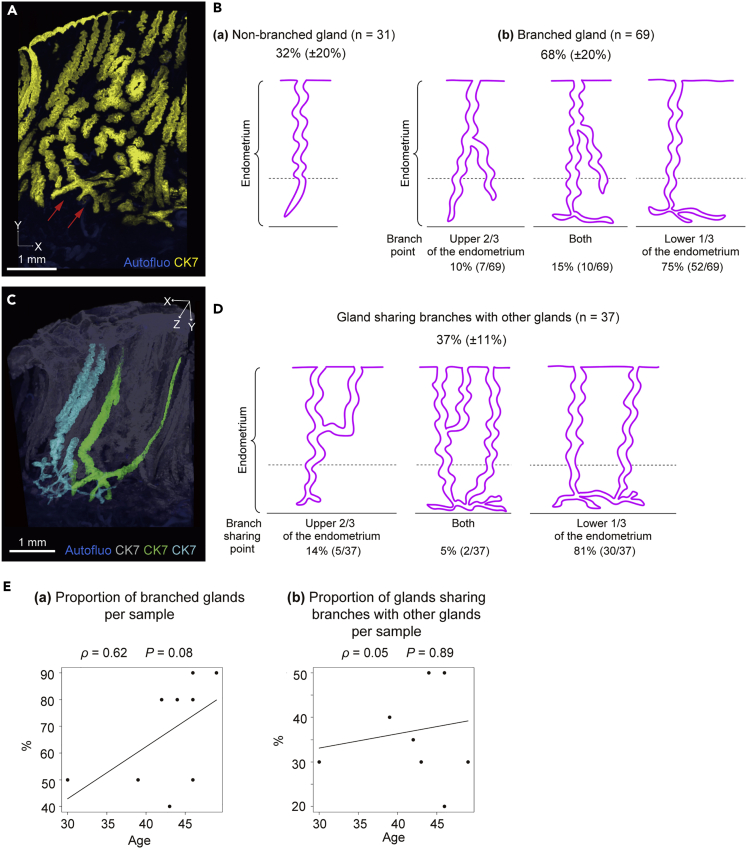
Figureu00a03
Morphology of branched human endometrial glands (A) Branches of endometrial glands (subject E8) on reconstructed XY-plane images (zu00a0= 198u00a0u03bcm). Red arrows indicate the branches. (B) Classif...
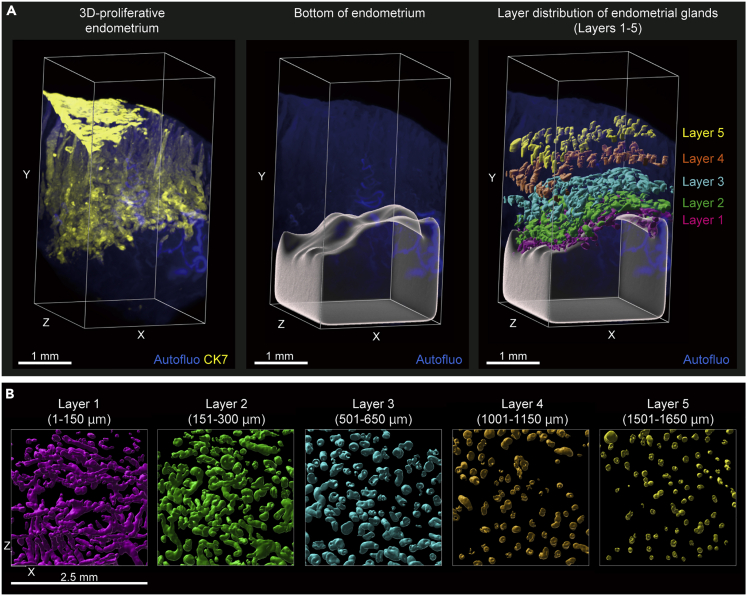
Figureu00a04
3D layer distribution of human endometrial glands (A) Left panel: the 3D tissue image was cropped on the XZ plane to 2.5u00a0mm u00d7 2.5u00a0mm (subject E1). Middle panel: 3D reconstruction of the bo...
Figureu00a05
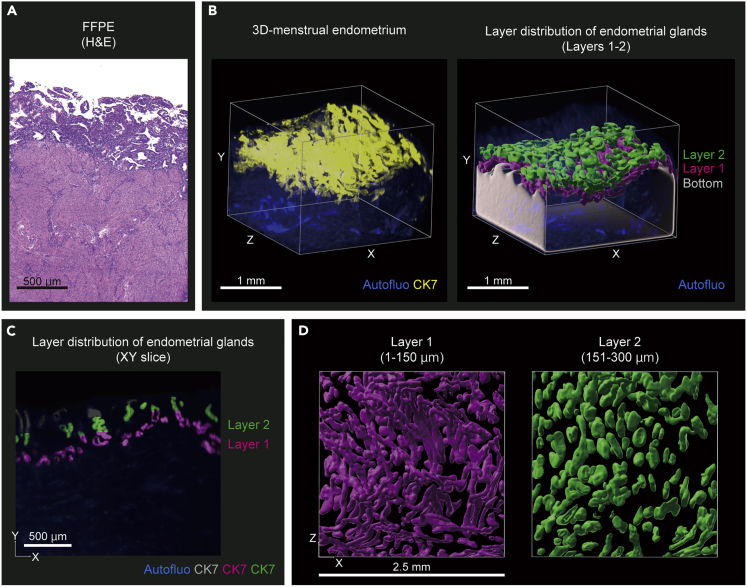
3D layer distribution of endometrial glands in a case of menstruation (A) Microscopic H&E-stained image of endometrium during menstruation (subject E11-1). (B) Left panel: the 3D tissue image was crop...

Figureu00a06
3D morphology of adenomyotic tissue (A) Left panel: microscopic H&E-stained image of adenomyotic tissue in the secretory phase (subject A1). Right panel: reconstructed XY section (zu00a0= 10u00a0u03bc...
Figureu00a07
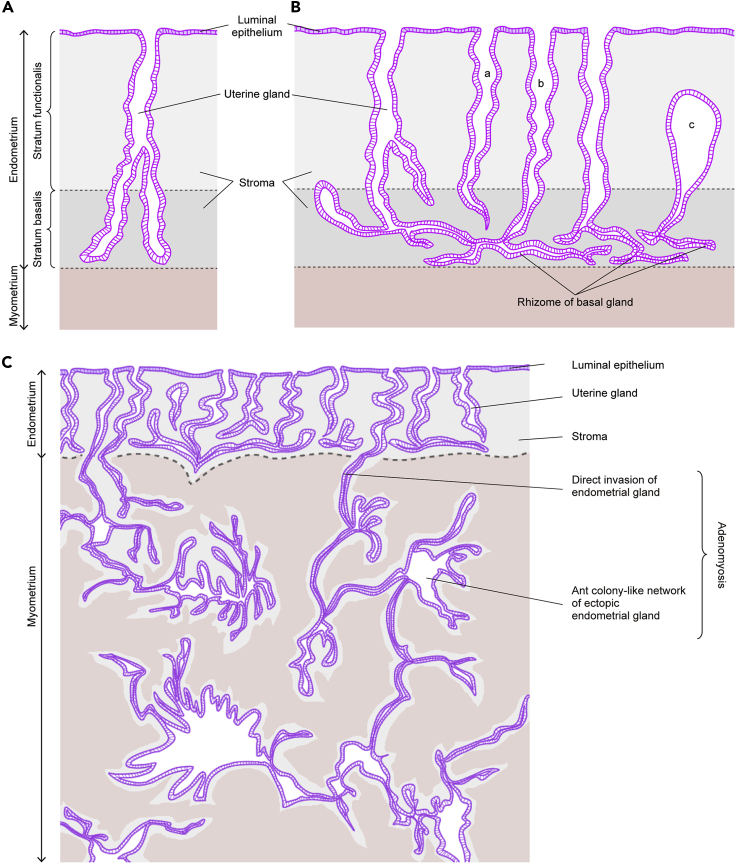
2D images of the normal human endometrium and adenomyotic tissue (A) Conventional 2D image of the endometrium. (B) New 2D image of the endometrium. (a) Nonbranched gland. (b) Gland sharing the rhizome...
Figure images are served from the NIH/NLM PubMed Central Open Access Subset or Europe PMC; copyright remains with the publishers and authors.
💬 Discussion
0 commentsNo comments yet. Be the first to start a discussion!
Leave a Comment