Abstract
The multidrug transporter ABCB1 (P-glycoprotein) is an ATP-binding cassette transporter that has a key role in protecting tissues from toxic insult and contributes to multidrug extrusion from cancer cells. Here, we report the near-atomic resolution cryo-EM structure of nucleotide-free ABCB1 trapped by an engineered disulfide cross-link between the nucleotide-binding domains (NBDs) and bound to the antigen-binding fragment of the human-specific inhibitory antibody UIC2 and to the third-generation ABCB1 inhibitor zosuquidar. Our structure reveals the transporter in an occluded conformation with a central, enclosed, inhibitor-binding pocket lined by residues from all transmembrane (TM) helices of ABCB1. The pocket spans almost the entire width of the lipid membrane and is occupied exclusively by two closely interacting zosuquidar molecules. The external, conformational epitope facilitating UIC2 binding is also visualized, providing a basis for its inhibition of substrate efflux. Additional cryo-EM structures suggest concerted movement of TM helices from both halves of the transporters associated with closing the NBD gap, as well as zosuquidar binding. Our results define distinct recognition interfaces of ABCB1 inhibitory agents, which may be exploited for therapeutic purposes.
🔬 Techniques
🔭 Microscopes
💻 Software
✨ Fluorophores
🧪 Sample Preparation
🔬 Cell Lines
🏭 Microscope Brands
🧪 Reagent Suppliers
📷 Detectors
💻 Software Details
💾 Data Repositories
🏛️ Research Organizations (ROR)
Affiliated research institutions:
📋 Methods
Protein Expression and Purification. A PCR-free cloning strategy was employed for all ABCB1 HM constructs, which were synthetically generated (Thermo Fisher Scientific). For the variant of the ABCB1 HM D-loop cross-link mutant (ABCB1 HM-X ), a 3C protease site (LEVLFQGP) replaced residues 668–675 in the linker connecting the two halves of the transporter. All genes were cloned into an expression vector harboring the pXLG gene expression cassette in a pUC57 vector (GenScript) ( 49 , 50 ) between BamH1 and Not1 restriction digestion sites. All genes were cloned with a C-terminal EYFP/rho-ID4 tag with an intervening precision (3C) protease cleavage site between the protein and purification tag. A stable cell line for ABCB1 HM-X was generated using the Flp-In T-REx Kit (Thermo Fisher Scientific) for inducible expression as per the manufacturer’s guidelines. Transient expression for ABCB1 HM and ABCB1 H (sequence ID AAA59576.1 ) constructs was carried out in HEK293T adherent cultures. Cells were grown and maintained in DMEM (Thermo Fisher Scientific) supplemented with 10% FBS (Thermo Fisher Scientific) at 37 °C with 5% CO 2 under humidified conditions. Purified DNA was mixed with branched polyethylenimine (PEI; Sigma) at a 1:2 (DNA/PEI) ratio and applied to cells after exchanging medium to expression medium (DMEM + 2% FBS). Expression and growth media were supplemented with a penicillin/streptomycin mixture (Thermo Fisher Scientific). For ABCB1 H , expression was allowed to proceed for 72 h at 37 °C. All synthetic gene constructs were expressed in the presence of 4 mM valproic acid (Sigma) at 30 °C for 96 h. A stable cell line for ABCB1 HM-X was grown and maintained similarly; induced with 1 μg⋅mL −1 tetracycline and protein expression, it was allowed to proceed for 72 h at 37 °C. Cells were washed with PBS before being harvested and flash-frozen in liquid nitrogen for storage at −80 °C. For protein purification, frozen cell pellets were thawed and homogenized using a Dounce homogenizer in an eightfold (vol/wt) excess of resuspension buffer containing 150 mM NaCl and 25 mM Hepes (pH 7.5), in addition to 10–20% glycerol and a protease inhibitor mix (prepstatin A, leupeptin, soy trypsin inhibitor, and phenylmethylsulfonyl fluoride), followed by addition of detergent, except for the ABCB1 HM-EQ sample for EM analysis, which was purified in 250 mM NaCl and 50 mM Tris (pH 7.5). For all ABCB1 H genes, protein extraction was allowed to proceed in the presence of a mixture of 0.4% dodecyl maltopyranoside (DDM), 0.1% octaethylene glycol monododecyl ether (C12E8), and 0.1% CHS for 90 min before being centrifuged for 30 min at 37,060 × g in a SA600 fixed-angle rotor. For ABCB1 HM constructs, 0.5/0.05% LMNG/CHS was used for solubilizing protein for 60 min before centrifugation. Clarified supernatant was applied to Sepharose-coupled Rho-ID4 antibody (University of British Columbia) and incubated for 3–18 h. Beads were washed four times with 10 column volumes (CV) of purification buffer containing 150 mM NaCl, 25 mM, and Hepes (pH 7.5), along with 10–20% glycerol and 0.01/0.01/0.004% DDM/C12E8/CHS (ABCB1 H ) or 0.02/0.004% LMNG/CHS (all ABCB1 HM constructs). For the ABCB1 HM-EQ sample for EM analysis, buffer and salt components were adjusted to contain 250 mM NaCl and 20 mM Tris (pH 8.0). For direct comparison of ABCB1 H and ABCB1 HM constructs in ATPase assays, DDM/C12E8/CHS-solubilized ABCB1 H was bound to ID4 columns and exchanged to LMNG/CHS buffer during the wash and subsequent purification steps. Protein was eluted by adding 3 CV of wash buffer containing a 1:10 wt/wt excess of 3C protease or by addition of 0.5 mg/mL ID4 peptide (GenScript) for 2–18 h. The 3C protease was His-tagged and removed by incubating the cleaved protein with nickel nitrilotriacetic acid beads (Qiagen). All purification steps were carried out at 4 °C. Antibody Purification and Fragmentation. UIC2 hybridoma cells were cultured in Wheaton CeLLine Bioreactors as per the manufacturer’s recommendations. Protein G and Protein A (GenScript) columns were used for antibody purification and antibody fragmentation, which were carried out using the Fab Preparation Kit protocol (Thermo Fisher Scientific). Fab purity was judged by SDS/PAGE, followed by size exclusion chromatography (SEC), after desalting into storage buffer containing 150 mM NaCl and 25 mM Hepes (pH 7.5) or 250 mM NaCl and 20 mM Tris (pH 8.0) for use with ABCB1 HM-EQ for EM analysis. Cytotoxicity Assays. The ABCB1 HM-X stable cell line was grown and maintained as described above. Induced or noninduced cells were plated at a density of 5,000–10,000 cells per well of a 96-well plate and allowed to attach for 1–2 h. Cells were then exchanged to medium containing paclitaxel at various concentrations and incubated for a further 48–72 h. Medium was exchanged, and cell viability was measured using the WST-1 cell proliferation/viability kit (Sigma). The assay was repeated in the presence of 10 μM zosuquidar, added 1–3 h before paclitaxel. To test the effect of UIC2, induced cells were plated as described above and preincubated with varying UIC2 concentrations for 1 h at 37 °C. Paclitaxel was then added directly to the medium (final concentration 0.5 μM), cells were incubated for 48–72 h, and viability was measured described as above. The results shown are for three independent experiments ( Fig. 1 B and C and SI Appendix , Fig. 2 A ). Data were fit to a sigmoidal dose–response curve, plotted in GraphPad Prism 6, and normalized to calculated B max values from the fitted curve after subtraction of the calculated B min values (to adjust for background levels in separate assays) from the respective datasets. Cysteine Cross-Linking of ABCB1 HM-X . Detergent-purified protein was incubated with 1 mM dichloro(1,10-phenanthroline)copper(II) (Sigma) for 1 h at 4 °C and desalted back into buffer lacking the oxidant using Sephadex G-25 desalting columns (GE Healthcare) to stop the reaction. For ABCB1 HM-X-3C , cross-linking efficiency was analyzed by SDS/PAGE ( SI Appendix , Fig. S2 B ). The 3C protease-cleaved samples were loaded in reducing and nonreducing loading buffer, and the ratio of cross-linked to non–cross-linked transporter was judged by comparing the full transporter band (cross-linked, ∼140 kDa) and the cleaved half-transporter bands (non–cross-linked, ∼50 kDa). Cross-linked protein was subsequently used for biochemical assays and EM sample preparation as described below. ATPase Assays. Measurements of ATP hydrolysis were performed using a molybdate base colorimetric assay as previously described ( 51 ). Protein concentrations used in the assays in the range of 0.1–0.2 mg/mL zosuquidar (Medkoo Biosciences) and taxol/paclitaxel (Sigma) were dissolved in DMSO and added to reaction mixes at the desired concentrations. The reactions were started upon addition of 2 mM ATP in the presence of 10 mM MgCl 2 at 37 °C. For K m determination, a range of ATP concentrations was used. Linear regression and statistical analyses were performed using GraphPad Prism 6. Antibody-Binding Assay. Purified Avi-tagged proteins were first desalted into biotinylation buffer [75 mM NaCl, 25 mM Hepes (pH 7.5), 10 mM magnesium acetate, 10 mM ATP, and 50 μM biotin] containing the detergent/CHS mix used for protein purification before addition of 5–10 μg biotin ligase BirA (produced in-house), and the reaction was allowed to proceed overnight at 4 °C, followed by desalting into buffer containing 150 mM NaCl, 25 mM Hepes (pH 7.5), 10–20% glycerol (buffer A), and the respective detergent/CHS mix. A total of 1–5 pmol of biotinylated proteins was added to each well of a preblocked 96-well Neutravidin plate (Thermo Fisher Scientific) for up to 1 h at room temperature. All incubations were carried out on a plate shaker (Unimax 1010 Orbital Platform shaker; Heidolph) at 350 rpm. Unbound transporters were discarded, and the wells were washed three times with 200 μL of buffer A supplemented with the respective detergent/CHS mix (buffer AD). A total of 100 μL of serially diluted UIC2 antibody was added to the wells and incubated for 30 min at room temperature. Unbound UIC2 was discarded, and the wells were washed three times with buffer AD as before. Horseradish peroxidase (100 μL)-conjugated goat mouse anti-IgG (catalog no. A16072; Thermo Fisher Scientific) diluted to 1 mg/mL (1:1,500) in buffer A was added to the wells for 30 min. After discarding unbound antibodies, the wells were washed as before, followed by development using the TMB Substrate Kit (Thermo Fisher Scientific). Absorbance (450 nM) was read using a BioTek Synergy HT plate reader. Readings were plotted against UIC2 concentrations and fit to a single-site specific binding equation in GraphPad Prism 6. Data were normalized to calculated B max values for comparative purposes. EM Sample Preparation. LMNG/CHS-purified ABCB1 HM constructs were mixed with a two- to threefold molar excess of UIC2-Fab. The ABCB1 HM-EQ –UIC2 complex was mixed with a 1:10 wt/wt excess of amphipol A8-35 (Anatrace) for 4 h at 4 °C, followed by overnight biobead (BB-SM2)-mediated removal of detergent. UIC2–Fab complexes of detergent-purified and amphipol-reconstituted samples were concentrated to 5–8 mg/mL before being purified on a G4000 SWXL SEC column in buffer containing 250 mM NaCl and 20 mM Tris (pH 8.0) (amphipol) or 150 mM NaCl and 25 mM Hepes (pH 7.5) (detergent samples). Peak fractions corresponding to the purified complexes were pooled and used for cryo-EM grid preparation. For the zosuquidar complex, the inhibitor was added to a final concentration of 10 μM before grid preparation. Freshly purified samples were applied to glow-discharged Lacey carbon grids (LC200; Electron Microscopy Sciences) and plunge-frozen in liquid nitrogen-cooled liquid ethane using a Vitrobot Mark IV (FEI) operated at 4 °C with a blotting time of 3–4 s and >90% humidity.
Show full methods section
Protein Expression and Purification. A PCR-free cloning strategy was employed for all ABCB1 HM constructs, which were synthetically generated (Thermo Fisher Scientific). For the variant of the ABCB1 HM D-loop cross-link mutant (ABCB1 HM-X ), a 3C protease site (LEVLFQGP) replaced residues 668–675 in the linker connecting the two halves of the transporter. All genes were cloned into an expression vector harboring the pXLG gene expression cassette in a pUC57 vector (GenScript) ( 49 , 50 ) between BamH1 and Not1 restriction digestion sites. All genes were cloned with a C-terminal EYFP/rho-ID4 tag with an intervening precision (3C) protease cleavage site between the protein and purification tag. A stable cell line for ABCB1 HM-X was generated using the Flp-In T-REx Kit (Thermo Fisher Scientific) for inducible expression as per the manufacturer’s guidelines. Transient expression for ABCB1 HM and ABCB1 H (sequence ID AAA59576.1 ) constructs was carried out in HEK293T adherent cultures. Cells were grown and maintained in DMEM (Thermo Fisher Scientific) supplemented with 10% FBS (Thermo Fisher Scientific) at 37 °C with 5% CO 2 under humidified conditions. Purified DNA was mixed with branched polyethylenimine (PEI; Sigma) at a 1:2 (DNA/PEI) ratio and applied to cells after exchanging medium to expression medium (DMEM + 2% FBS). Expression and growth media were supplemented with a penicillin/streptomycin mixture (Thermo Fisher Scientific). For ABCB1 H , expression was allowed to proceed for 72 h at 37 °C. All synthetic gene constructs were expressed in the presence of 4 mM valproic acid (Sigma) at 30 °C for 96 h. A stable cell line for ABCB1 HM-X was grown and maintained similarly; induced with 1 μg⋅mL −1 tetracycline and protein expression, it was allowed to proceed for 72 h at 37 °C. Cells were washed with PBS before being harvested and flash-frozen in liquid nitrogen for storage at −80 °C. For protein purification, frozen cell pellets were thawed and homogenized using a Dounce homogenizer in an eightfold (vol/wt) excess of resuspension buffer containing 150 mM NaCl and 25 mM Hepes (pH 7.5), in addition to 10–20% glycerol and a protease inhibitor mix (prepstatin A, leupeptin, soy trypsin inhibitor, and phenylmethylsulfonyl fluoride), followed by addition of detergent, except for the ABCB1 HM-EQ sample for EM analysis, which was purified in 250 mM NaCl and 50 mM Tris (pH 7.5). For all ABCB1 H genes, protein extraction was allowed to proceed in the presence of a mixture of 0.4% dodecyl maltopyranoside (DDM), 0.1% octaethylene glycol monododecyl ether (C12E8), and 0.1% CHS for 90 min before being centrifuged for 30 min at 37,060 × g in a SA600 fixed-angle rotor. For ABCB1 HM constructs, 0.5/0.05% LMNG/CHS was used for solubilizing protein for 60 min before centrifugation. Clarified supernatant was applied to Sepharose-coupled Rho-ID4 antibody (University of British Columbia) and incubated for 3–18 h. Beads were washed four times with 10 column volumes (CV) of purification buffer containing 150 mM NaCl, 25 mM, and Hepes (pH 7.5), along with 10–20% glycerol and 0.01/0.01/0.004% DDM/C12E8/CHS (ABCB1 H ) or 0.02/0.004% LMNG/CHS (all ABCB1 HM constructs). For the ABCB1 HM-EQ sample for EM analysis, buffer and salt components were adjusted to contain 250 mM NaCl and 20 mM Tris (pH 8.0). For direct comparison of ABCB1 H and ABCB1 HM constructs in ATPase assays, DDM/C12E8/CHS-solubilized ABCB1 H was bound to ID4 columns and exchanged to LMNG/CHS buffer during the wash and subsequent purification steps. Protein was eluted by adding 3 CV of wash buffer containing a 1:10 wt/wt excess of 3C protease or by addition of 0.5 mg/mL ID4 peptide (GenScript) for 2–18 h. The 3C protease was His-tagged and removed by incubating the cleaved protein with nickel nitrilotriacetic acid beads (Qiagen). All purification steps were carried out at 4 °C. Antibody Purification and Fragmentation. UIC2 hybridoma cells were cultured in Wheaton CeLLine Bioreactors as per the manufacturer’s recommendations. Protein G and Protein A (GenScript) columns were used for antibody purification and antibody fragmentation, which were carried out using the Fab Preparation Kit protocol (Thermo Fisher Scientific). Fab purity was judged by SDS/PAGE, followed by size exclusion chromatography (SEC), after desalting into storage buffer containing 150 mM NaCl and 25 mM Hepes (pH 7.5) or 250 mM NaCl and 20 mM Tris (pH 8.0) for use with ABCB1 HM-EQ for EM analysis. Cytotoxicity Assays. The ABCB1 HM-X stable cell line was grown and maintained as described above. Induced or noninduced cells were plated at a density of 5,000–10,000 cells per well of a 96-well plate and allowed to attach for 1–2 h. Cells were then exchanged to medium containing paclitaxel at various concentrations and incubated for a further 48–72 h. Medium was exchanged, and cell viability was measured using the WST-1 cell proliferation/viability kit (Sigma). The assay was repeated in the presence of 10 μM zosuquidar, added 1–3 h before paclitaxel. To test the effect of UIC2, induced cells were plated as described above and preincubated with varying UIC2 concentrations for 1 h at 37 °C. Paclitaxel was then added directly to the medium (final concentration 0.5 μM), cells were incubated for 48–72 h, and viability was measured described as above. The results shown are for three independent experiments ( Fig. 1 B and C and SI Appendix , Fig. 2 A ). Data were fit to a sigmoidal dose–response curve, plotted in GraphPad Prism 6, and normalized to calculated B max values from the fitted curve after subtraction of the calculated B min values (to adjust for background levels in separate assays) from the respective datasets. Cysteine Cross-Linking of ABCB1 HM-X . Detergent-purified protein was incubated with 1 mM dichloro(1,10-phenanthroline)copper(II) (Sigma) for 1 h at 4 °C and desalted back into buffer lacking the oxidant using Sephadex G-25 desalting columns (GE Healthcare) to stop the reaction. For ABCB1 HM-X-3C , cross-linking efficiency was analyzed by SDS/PAGE ( SI Appendix , Fig. S2 B ). The 3C protease-cleaved samples were loaded in reducing and nonreducing loading buffer, and the ratio of cross-linked to non–cross-linked transporter was judged by comparing the full transporter band (cross-linked, ∼140 kDa) and the cleaved half-transporter bands (non–cross-linked, ∼50 kDa). Cross-linked protein was subsequently used for biochemical assays and EM sample preparation as described below. ATPase Assays. Measurements of ATP hydrolysis were performed using a molybdate base colorimetric assay as previously described ( 51 ). Protein concentrations used in the assays in the range of 0.1–0.2 mg/mL zosuquidar (Medkoo Biosciences) and taxol/paclitaxel (Sigma) were dissolved in DMSO and added to reaction mixes at the desired concentrations. The reactions were started upon addition of 2 mM ATP in the presence of 10 mM MgCl 2 at 37 °C. For K m determination, a range of ATP concentrations was used. Linear regression and statistical analyses were performed using GraphPad Prism 6. Antibody-Binding Assay. Purified Avi-tagged proteins were first desalted into biotinylation buffer [75 mM NaCl, 25 mM Hepes (pH 7.5), 10 mM magnesium acetate, 10 mM ATP, and 50 μM biotin] containing the detergent/CHS mix used for protein purification before addition of 5–10 μg biotin ligase BirA (produced in-house), and the reaction was allowed to proceed overnight at 4 °C, followed by desalting into buffer containing 150 mM NaCl, 25 mM Hepes (pH 7.5), 10–20% glycerol (buffer A), and the respective detergent/CHS mix. A total of 1–5 pmol of biotinylated proteins was added to each well of a preblocked 96-well Neutravidin plate (Thermo Fisher Scientific) for up to 1 h at room temperature. All incubations were carried out on a plate shaker (Unimax 1010 Orbital Platform shaker; Heidolph) at 350 rpm. Unbound transporters were discarded, and the wells were washed three times with 200 μL of buffer A supplemented with the respective detergent/CHS mix (buffer AD). A total of 100 μL of serially diluted UIC2 antibody was added to the wells and incubated for 30 min at room temperature. Unbound UIC2 was discarded, and the wells were washed three times with buffer AD as before. Horseradish peroxidase (100 μL)-conjugated goat mouse anti-IgG (catalog no. A16072; Thermo Fisher Scientific) diluted to 1 mg/mL (1:1,500) in buffer A was added to the wells for 30 min. After discarding unbound antibodies, the wells were washed as before, followed by development using the TMB Substrate Kit (Thermo Fisher Scientific). Absorbance (450 nM) was read using a BioTek Synergy HT plate reader. Readings were plotted against UIC2 concentrations and fit to a single-site specific binding equation in GraphPad Prism 6. Data were normalized to calculated B max values for comparative purposes. EM Sample Preparation. LMNG/CHS-purified ABCB1 HM constructs were mixed with a two- to threefold molar excess of UIC2-Fab. The ABCB1 HM-EQ –UIC2 complex was mixed with a 1:10 wt/wt excess of amphipol A8-35 (Anatrace) for 4 h at 4 °C, followed by overnight biobead (BB-SM2)-mediated removal of detergent. UIC2–Fab complexes of detergent-purified and amphipol-reconstituted samples were concentrated to 5–8 mg/mL before being purified on a G4000 SWXL SEC column in buffer containing 250 mM NaCl and 20 mM Tris (pH 8.0) (amphipol) or 150 mM NaCl and 25 mM Hepes (pH 7.5) (detergent samples). Peak fractions corresponding to the purified complexes were pooled and used for cryo-EM grid preparation. For the zosuquidar complex, the inhibitor was added to a final concentration of 10 μM before grid preparation. Freshly purified samples were applied to glow-discharged Lacey carbon grids (LC200; Electron Microscopy Sciences) and plunge-frozen in liquid nitrogen-cooled liquid ethane using a Vitrobot Mark IV (FEI) operated at 4 °C with a blotting time of 3–4 s and >90% humidity.
Data
Collection and Processing. An overall data processing scheme for structure determination is provided in SI Appendix , Fig. S9 . Two different microscopes were used for data collection for the detergent-purified, cross-linked samples and the amphipol-reconstituted samples (FEI Titan Krios 1 and 2, respectively; SI Appendix , Table S1 ). Grids were clipped for loading into a Titan Krios microscope (FEI) running at 300 kV equipped with a Gatan Quantum-LS Energy Filter (GIF) and a Gatan K2 Summit direct electron detector. For the zosuquidar complex of ABCB1 HM-X –UIC2, image stacks comprising 48 frames were collected at a nominal magnification of 165,000× in superresolution mode with an estimated dose per frame of 1.54 electrons per square angstrom, corresponding to a total dose of 74 electrons per square angstrom. Stacks were motion-corrected, dose-weighted, and twofold Fourier-cropped to a calibrated pixel size of 0.84 Å in MotionCor2 ( 52 ). Contrast transfer function (CTF) estimates were performed using gCTF ( 53 ), followed by particle picking and extraction of a total of 469,224 particles from 2,479 micrographs in Relion 2.0 ( 54 – 56 ). After several rounds of 2D classification, 352,880 particles in all usable classes were used for 3D classification using a low-pass-filtered map of the cross-linked apo structure (discussed below) as a reference. Of those, two near-identically looking classes comprising 231,969 (66%) particles were combined and used for 3D refinement and postprocessing to yield a 3D map at 3.78 Å resolution, whereas the remaining particles fell into unusable classes with missing NBDs. We suspect this arises from poorly averaged or heterogeneous particle sets, as well as missing orientation views and the fact that despite high cross-linking efficiency, a subset of transporters may not be linked, and may thus add to overall variability in conformational mobility of the NBDs. A model map for the detergent belt was generated from this map in UCSF Chimera ( 57 ), masked in Relion, and used for signal subtraction from the input set of particles used for the initial refinement to yield a final postprocessed map resolution of 3.58 Å. The reported resolution for all maps was based on the FSC cutoff criterion of 0.143 ( 58 ). Local resolution estimation was performed using ResMap ( 59 ). For the apo ABCB1 HM-X –UIC2 sample, image stacks comprising 80 frames each with an estimated dose per frame of ∼0.9 electrons per square angstrom, corresponding to a total accumulated dose of 72 electrons per square angstrom, were collected at a magnification of 105,000× in superresolution mode, followed by motion correction and dose weighting in MotionCor2. Stacks were twofold binned via Fourier-cropping to a calibrated pixel size of 1.387 Å for processing using Relion 2.0. CTF estimates were performed using gCTF, followed by picking and extraction of a total of 820,566 particles from 2,614 micrographs in Relion. After 2D classification, an input set of 785,152 particles was used for 3D classification using a low-pass-filtered map of the ABCB1 HM-EQ –UIC2 structure (discussed below) as a reference. Of those, 517,053 particles (66%) from two similar-looking 3D classes were combined for a round of 3D refinement that yielded a 4.78-Å map. After masking and postprocessing in Relion using automatically determined B-factors, we obtained a resolution of 4.33 Å. This map was used to obtain a model map for the detergent belt, which was generated as described for the zosuquidar complex dataset and used for signal subtraction using the input particle set used for the initial refinement. The new signal-subtracted dataset was then used to refine a single 3D class comprising 517,053 particles. Masking and postprocessing using automatically determined B-factors as before yielded a final map with a resolution of 4.14 Å (map 1) that was used for model building. A second, smaller detergent belt model was similarly generated to create a second signal-subtracted dataset that served as input for one more round of 3D classification, where a search for three 3D classes yielded two distinct classes that shared a similar architecture but showed differences in conformations of TM4 and TM10. Class 1 (153,652 particles) and class 2 (158,827 particles), containing kinked and straight conformations of TM4 and TM10, respectively, were both refined to a resolution of ∼4.5 Å (map 2 and map 3, respectively). The remaining particles fell into the third class containing blurred density in the regions of TM4 and TM10 and were not analyzed further. For the ABCB1 HM-EQ –UIC2 complex, image stacks comprising 80 frames each were collected at a nominal magnification of 105,000× in superresolution mode with an estimated dose per frame of 1.0 electron per square angstrom, corresponding to a total dose of 80 electrons per square angstrom. The software suite Focus ( 60 ) was used for online data processing and pruning, applying motion correction with MotionCor2, including twofold binning of the recorded micrographs after motion correction to a calibrated pixel size of 1.336 Å and CTF estimation with gCTF. Particles were picked with gAUTOMATCH ( 61 ) using a template-based approach, with templates created from the published ABCB1–UIC2 complex structure ( 29 ) using e2proc2d.py (EMAN2) ( 62 ). The same model was used later as a starting model in 3D classification. Micrographs were imported for processing in Relion, and a total of 347,049 particles were extracted from 2,038 micrographs, followed by two rounds of 2D classification, to yield a particle set of 112,196 particles. Following two rounds of 3D classification, the remaining 78,282 particles were used for 3D auto-refinement in Relion. Partial signal subtraction was performed to remove the amphipol belt for final 3D refinement and postprocessing to yield a final resolution of 6.25 Å.
Model
Building and Refinement. Postprocessed maps, as well as non–B-factor sharpened maps were used for model building in Coot ( 63 ) for all datasets. The quality of electron density in the TMD regions of the apo and zosuquidar maps allowed for de novo model building. The map quality in the NBD region was, on average, of lower quality compared with the TMDs, which were resolved to near-atomic resolution ( SI Appendix , Figs. S4 and S7 ). Modeling of the NBD region was therefore guided by published structures of ABCB1 [Protein Data Bank (PDB) ID codes 4M1M and 5KO2], followed by manual adjustment where required and permitted by map quality. The UIC2 crystal structure (PDB ID code 5JUE) was manually docked into the Fab density using UCSF Chimera, followed by adjustment in Coot. Two molecules of zosuquidar were unambiguously fit into the corresponding electron density in the ABCB1-binding pocket. We observed electron density characteristic for a bound phospholipid that was tentatively modeled as phosphatidylethanolamine (PE) in both the apo- and zosuquidar-bound occluded ABCB1 HM-X structures. PE and glycan monomers were obtained from the Coot monomer library (monomer codes 3PE and NAG, respectively). Geometric restraints for all ligands were generated in Phenix. The model for ABCB1 HM-EQ –UIC2 was based on the structure of the apo-occluded state. Map quality allowed for rebuilding the TMDs to fit the density and was guided, in part, by the structure of mouse ABCB1 (4M1M). Real-space refinement of the models was carried out in Phenix ( 64 , 65 ), with default restraint parameterization along and automatically generated secondary structure restraints. Refinement statistics for all models are presented in SI Appendix , Table S1 . For validation of the zosuquidar complex model, random coordinate errors up to 0.3 Å were introduced into the refined model, which was subsequently refined against one of the half-maps from the 3D auto-refine run from Relion. Minimal differences in FSCs computed between the refined model and the half-map used for refinement compared with those between the refined model and the half-map excluded from refinement point to a model free from overrefinement ( SI Appendix , Fig. S3 ). All figures were prepared using UCSF Chimera and PyMOL (The PyMOL Molecular Graphics System, Version 1.8; Schrödinger, LLC). Cavity volumes were calculated using HOLLOW ( 66 ) as described. Structure alignment and rmsd calculations were done in PyMOL. Ligand interaction diagrams were prepared in LigPlot+ ( 67 ). Residue numbers in figures are based on equivalent residues in the fully human protein.
📊 Figures
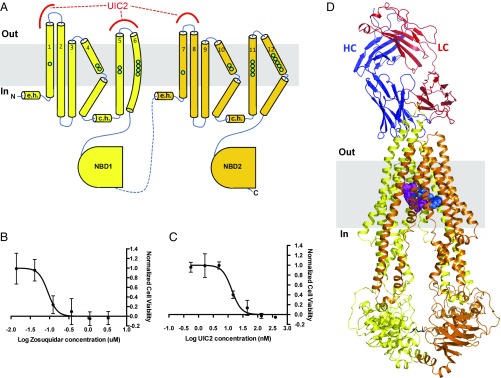
Fig. 1.
Structural and functional characterization of UIC2-Fab and zosuquidar-bound ABCB1. ( A ) Topology diagram of ABCB1. TM helices are numbered, and their relative lengths, as well as the locations of kin...
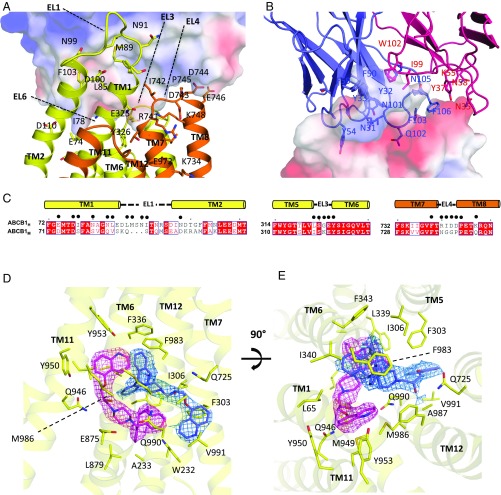
Fig. 2.
Details of UIC2-binding interface and zosuquidar-binding pocket. ( A ) Close-up view of the ABCB1u2013UIC2 interface with the UIC2-Fabu2013binding region shown as an electrostatic surface potential ma...
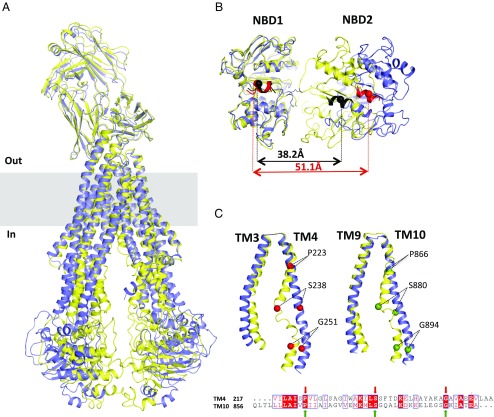
Fig. 3.
Conformational changes in ABCB1. ( A ) Comparison of apo-inward ABCB1 HM u2013UIC2 (blue) and disulfide-trapped, apo ABCB1 HM-X u2013UIC2 (yellow) using UIC2-Fab as an anchor point for the superpositi...
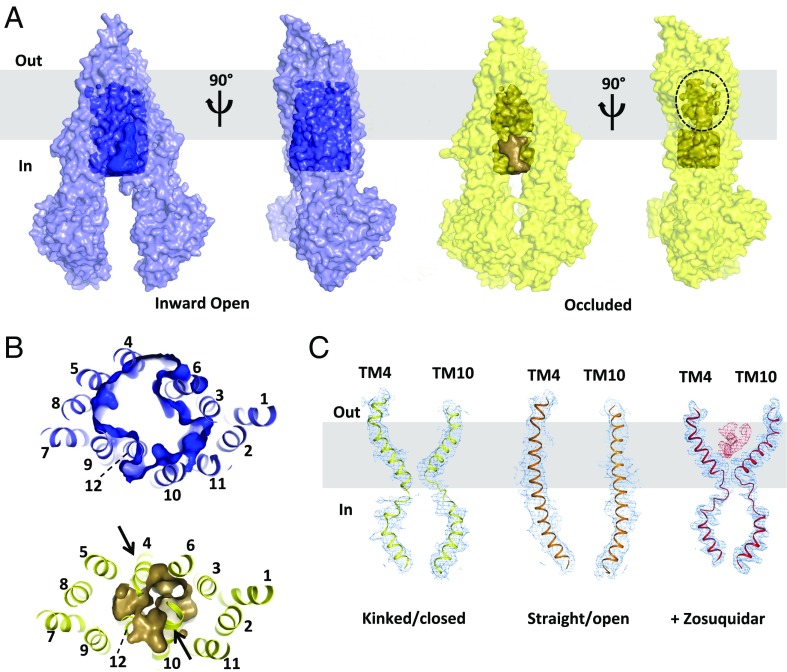
Fig. 4.
Structural changes in the translocation pathway. ( A ) Surface representations of inward-open ABCB1 HM and disulfide-trapped ABCB1 HM-X structures (without bound UIC2-Fab) colored blue and yellow, res...
Figure images are served from the NIH/NLM PubMed Central Open Access Subset or Europe PMC; copyright remains with the publishers and authors.
💬 Discussion
0 commentsNo comments yet. Be the first to start a discussion!
Leave a Comment