Abstract
Adaptor protein 2 (AP2) is a major constituent of clathrin-coated pits (CCPs). Whether it is essential for all forms of clathrin-mediated endocytosis (CME) in mammalian cells is an open issue. Here, we demonstrate, by live TIRF microscopy, the existence of a subclass of relatively short-lived CCPs lacking AP2 under physiological, unperturbed conditions. This subclass is retained in AP2-knockout cells and is able to support the internalization of epidermal growth factor receptor (EGFR) but not of transferrin receptor (TfR). The AP2-independent internalization mechanism relies on the endocytic adaptors eps15, eps15L1, and epsin1. The absence of AP2 impairs the recycling of the EGFR to the cell surface, thereby augmenting its degradation. Accordingly, under conditions of AP2 ablation, we detected dampening of EGFR-dependent AKT signaling and cell migration, arguing that distinct classes of CCPs could provide specialized functions in regulating EGFR recycling and signaling.
🔬 Techniques
🔭 Microscopes
🧬 Organisms
✨ Fluorophores
🧪 Sample Preparation
🔬 Cell Lines
🏭 Microscope Brands
🧪 Reagent Suppliers
🔎 Objectives
💻 Software Details
🏷️ Research Resource Identifiers (RRIDs)
Verified research resources used in this paper:
🏛️ Research Organizations (ROR)
Affiliated research institutions:
📋 Methods
Key Resources Table REAGENT or RESOURCE SOURCE IDENTIFIER Antibodies
R abbit polyclonal anti-EGFR (epitope: aa 1172-1186, Homo sapiens ) In house N/A Mouse anti-eps15 (epitope: aa 2-330, Mus musculus ) In house N/A Rabbit anti-eps15L1 (epitope: aa 216-266, Mus musculus ) In house N/A Mouse anti-epsin1/2 (epitope: aa 249-401 of epsin1, Homo sapiens ) In house N/A Mouse anti-EGFR 13A9 Genentech mAbEGFR 13A9 Anti-Alexa Fluor 488 ThermoFisher Cat# A-11094, RRID: AB_221544 Anti-clathrin heavy chain (clone 23) Transduction BD Cat#610499, RRID: AB_397865 anti-AP2μ Transduction BD Cat#611350, RRID: AB_398872 Anti-AP2α Sigma-Aldrich Cat#A4325, RRID: AB_258156 Anti-AP2β Sigma-Aldrich Cat#A4325, RRID: AB_258156 Anti-AP2σ Abcam Cat#ab128950, RRID: AB_11140842 Anti-Phosphotyrosine Antibody, clone 4G10 Millipore-Merck Cat#05-321 RRID: AB_309678 Anti-pShc Cell Signaling Cat#2434, RRID: AB_10841301 Anti-phospho-AKT (Ser473) Cell Signaling Cat#9271 RRID: AB_329825 Anti-phospho-ERK1/2 (Thr202/Tyr204) Cell Signaling Cat#9101, RRID: AB_331646 Anti-total-AKT Cell Signaling Cat#9272, RRID: AB_329827 Anti-total-ERK1/2 Sigma-Aldrich Cat# M7927, RRID: AB_260665 Anti-pEGFR (Y1173) Cell Signaling Cat# 4407, RRID: AB_331795 Anti-GAPDH Santa Cruz Biotechnology Cat# sc-32233, RRID: AB_627679 Anti-tubulin Millipore Cat# MAB1864, RRID: AB_2210391 Anti-vinculin Sigma-Aldrich Cat# V9131, RRID: AB_477629 Chemicals, Peptides, and Recombinant Proteins Recombinant human EGF BPSBioscience Cat#90201-3 125 I-EGF PerkinElmer Cat#NEX428 125 I-Tf PerkinElmer Cat#NEX212 Alexa488-EGF Molecular Probes Cat# E13345 Recombinant TAT-Cre recombinase In house N/A Protein-A Gold 10 nm Utrecht University Cat#PAG10nm EM grade glutaraldehyde Electron Microscopy Sciences Cat#16210 Sodium cacodylate trihydrate Sigma Cat#C4945 Osmium tetroxide 4% SOL.10X10ML Electron Microscopy Sciences Cat#19190 Potassium ferricyanide Electron Microscopy Sciences Cat# 20150 Ruthenium red Sigma Cat#84071 Absolute ethanol Sigma Cat#32221-M Epoxy embedding medium Sigma Cat#45359-1EA-F Secondary rabbit anti-mouse IgG Sigma Cat# M7023, RRID: AB_260634 Collagen I rat tail BD Bioscience Cat#354236 Critical Commercial Assays RNeasy kit QIAGEN Cat#74106 QuantiTect Reverse Transcription Kit QIAGEN Cat#205313 Inventoried Taqman assay, EPN1 Applied Biosystems Hs00203391_m1 Inventoried Taqman assay, EPN2 Applied Biosystems Hs00209150_m1 Inventoried Taqman assay, EPN3 Applied Biosystems Hs00978957_m1 Inventoried Taqman assay, Epn1 Applied Biosystems Mm01328492_m1 Inventoried Taqman assay, Epn2 Applied Biosystems Mm00665982_g1 Inventoried Taqman assay, Epn3 Applied Biosystems Mm00660955_m1 Inventoried Taqman assay, Cltc Applied Biosystems Mm01303974_m1 Inventoried Taqman assay, Ap1m1 Applied Biosystems Mm00475912_m1 Inventoried Taqman assay, Ap1m2 Applied Biosystems Mm00477565_m1 Inventoried Taqman assay, Ap2m1 Applied Biosystems Mm01702796_g1 Inventoried Taqman assay, Ap3m1 Applied Biosystems Mm00785907_s1 Inventoried Taqman assay, Ap3m2 Applied Biosystems Mm00512819_m1 Inventoried Taqman assay, Ap4m1 Applied Biosystems Mm00480494_m1 Inventoried Taqman assay, Ap5m1 Applied Biosystems Mm00513794_m1 Inventoried Taqman assay, Gapdh Applied Biosystems mm99999915_g1 Inventoried Taqman assay, 18S Applied Biosystems Hs99999901_s1 miRneasy kit QIAGEN Cat#217004 SuperScript VILO cDNA Synthesis Kit Invitrogen Cat#11754050 hsa-Stat3 Quantitect QT00068754 Experimental Models: Cell Lines HeLa cells In house ( Sigismund et al., 2013 ) N/A SUM159 cells gene edited to express AP2σ2-EGFP and CLTA-TagRFP This paper N/A AP2μ fl/fl MEFs This paper N/A Oligonucleotides All Stars control siRNA QIAGEN Cat #1027280 Stealth RNAi, Clathrin Heavy Chain GAAGAACUCUUUG CCCGGAAAUUUA ThermoFisher N/A RNAi, AP2α human AAGAGCAUGUGCACGCUGGCCA Dharmacon ( Motley et al., 2003 ) N/A iBONI siRNA, AP2μ human UGACCCGAAAGGCAUCCACCCCC Riboxx N/A Stealth RNAi, epsin1 human UUACAAGGCCAUGACGCUGAUGGAG ThermoFisher N/A Stealth RNAi, epsin1 mouse GACUGGCUCUGAGGCUGUAUCACAA ThermoFisher N/A iBONI siRNA, eps15 mouse AAUACUCUCCCUUUGAACUUCCCCC Riboxx N/A iBONI siRNA, eps15L1 mouse UUUCAAAGAUGCCAUCAAACCCCC Riboxx N/A Stealth RNAi, epsin 2 human AAGAAAGCCGAAGGGACACAGUUAA ThermoFisher N/A iBONI siRNA, AP1μ mouse UUCUUCCGAUACUUGAUGCCCCC Riboxx N/A iBONI siRNA, AP3μ1 mouse UAAAUGGCUUAUACUUCUCCCCC Riboxx N/A iBONI siRNA, AP3μ2 mouse UACAUCCCAAGACAGCAUCCCCC Riboxx N/A iBONI siRNA, AP4μ mouse, pool of four oligos Riboxx N/A iBONI siRNA, AP5μ mouse AUAAUCCAGACCAGUAAGCCCCC Riboxx N/A Custom RT-qPCR primers for EGF-induced transcriptomic analysis See Table S1 See Table S1 Recombinant DNA pMSCV- CLTA-TagRFP Cocucci et al., 2012 N/A pMSCV-AP2σ2-EGFP Cocucci et al., 2012 N/A pSLIK-EGFR This paper N/A pSLIK-neo lentiviral vector Addgene ( Shin et al., 2006 ) Cat#25735 pSICOR-shRNA human eps15 Sigismund et al., 2005 N/A pSICOR-shRNA human eps15L1 Sigismund et al., 2005 N/A Software and Algorithms cmeAnalysis software package Aguet et al., 2013 N/A Contact for Reagent and Resourse Sharing Further information and requests for resources and reagents should be directed to and will be fulfilled by the Lead Contact, Sara Sigismund ( sara.sigismund@ieo.it ).
Show full methods section
Key Resources Table REAGENT or RESOURCE SOURCE IDENTIFIER Antibodies
R abbit polyclonal anti-EGFR (epitope: aa 1172-1186, Homo sapiens ) In house N/A Mouse anti-eps15 (epitope: aa 2-330, Mus musculus ) In house N/A Rabbit anti-eps15L1 (epitope: aa 216-266, Mus musculus ) In house N/A Mouse anti-epsin1/2 (epitope: aa 249-401 of epsin1, Homo sapiens ) In house N/A Mouse anti-EGFR 13A9 Genentech mAbEGFR 13A9 Anti-Alexa Fluor 488 ThermoFisher Cat# A-11094, RRID: AB_221544 Anti-clathrin heavy chain (clone 23) Transduction BD Cat#610499, RRID: AB_397865 anti-AP2μ Transduction BD Cat#611350, RRID: AB_398872 Anti-AP2α Sigma-Aldrich Cat#A4325, RRID: AB_258156 Anti-AP2β Sigma-Aldrich Cat#A4325, RRID: AB_258156 Anti-AP2σ Abcam Cat#ab128950, RRID: AB_11140842 Anti-Phosphotyrosine Antibody, clone 4G10 Millipore-Merck Cat#05-321 RRID: AB_309678 Anti-pShc Cell Signaling Cat#2434, RRID: AB_10841301 Anti-phospho-AKT (Ser473) Cell Signaling Cat#9271 RRID: AB_329825 Anti-phospho-ERK1/2 (Thr202/Tyr204) Cell Signaling Cat#9101, RRID: AB_331646 Anti-total-AKT Cell Signaling Cat#9272, RRID: AB_329827 Anti-total-ERK1/2 Sigma-Aldrich Cat# M7927, RRID: AB_260665 Anti-pEGFR (Y1173) Cell Signaling Cat# 4407, RRID: AB_331795 Anti-GAPDH Santa Cruz Biotechnology Cat# sc-32233, RRID: AB_627679 Anti-tubulin Millipore Cat# MAB1864, RRID: AB_2210391 Anti-vinculin Sigma-Aldrich Cat# V9131, RRID: AB_477629 Chemicals, Peptides, and Recombinant Proteins Recombinant human EGF BPSBioscience Cat#90201-3 125 I-EGF PerkinElmer Cat#NEX428 125 I-Tf PerkinElmer Cat#NEX212 Alexa488-EGF Molecular Probes Cat# E13345 Recombinant TAT-Cre recombinase In house N/A Protein-A Gold 10 nm Utrecht University Cat#PAG10nm EM grade glutaraldehyde Electron Microscopy Sciences Cat#16210 Sodium cacodylate trihydrate Sigma Cat#C4945 Osmium tetroxide 4% SOL.10X10ML Electron Microscopy Sciences Cat#19190 Potassium ferricyanide Electron Microscopy Sciences Cat# 20150 Ruthenium red Sigma Cat#84071 Absolute ethanol Sigma Cat#32221-M Epoxy embedding medium Sigma Cat#45359-1EA-F Secondary rabbit anti-mouse IgG Sigma Cat# M7023, RRID: AB_260634 Collagen I rat tail BD Bioscience Cat#354236 Critical Commercial Assays RNeasy kit QIAGEN Cat#74106 QuantiTect Reverse Transcription Kit QIAGEN Cat#205313 Inventoried Taqman assay, EPN1 Applied Biosystems Hs00203391_m1 Inventoried Taqman assay, EPN2 Applied Biosystems Hs00209150_m1 Inventoried Taqman assay, EPN3 Applied Biosystems Hs00978957_m1 Inventoried Taqman assay, Epn1 Applied Biosystems Mm01328492_m1 Inventoried Taqman assay, Epn2 Applied Biosystems Mm00665982_g1 Inventoried Taqman assay, Epn3 Applied Biosystems Mm00660955_m1 Inventoried Taqman assay, Cltc Applied Biosystems Mm01303974_m1 Inventoried Taqman assay, Ap1m1 Applied Biosystems Mm00475912_m1 Inventoried Taqman assay, Ap1m2 Applied Biosystems Mm00477565_m1 Inventoried Taqman assay, Ap2m1 Applied Biosystems Mm01702796_g1 Inventoried Taqman assay, Ap3m1 Applied Biosystems Mm00785907_s1 Inventoried Taqman assay, Ap3m2 Applied Biosystems Mm00512819_m1 Inventoried Taqman assay, Ap4m1 Applied Biosystems Mm00480494_m1 Inventoried Taqman assay, Ap5m1 Applied Biosystems Mm00513794_m1 Inventoried Taqman assay, Gapdh Applied Biosystems mm99999915_g1 Inventoried Taqman assay, 18S Applied Biosystems Hs99999901_s1 miRneasy kit QIAGEN Cat#217004 SuperScript VILO cDNA Synthesis Kit Invitrogen Cat#11754050 hsa-Stat3 Quantitect QT00068754 Experimental Models: Cell Lines HeLa cells In house ( Sigismund et al., 2013 ) N/A SUM159 cells gene edited to express AP2σ2-EGFP and CLTA-TagRFP This paper N/A AP2μ fl/fl MEFs This paper N/A Oligonucleotides All Stars control siRNA QIAGEN Cat #1027280 Stealth RNAi, Clathrin Heavy Chain GAAGAACUCUUUG CCCGGAAAUUUA ThermoFisher N/A RNAi, AP2α human AAGAGCAUGUGCACGCUGGCCA Dharmacon ( Motley et al., 2003 ) N/A iBONI siRNA, AP2μ human UGACCCGAAAGGCAUCCACCCCC Riboxx N/A Stealth RNAi, epsin1 human UUACAAGGCCAUGACGCUGAUGGAG ThermoFisher N/A Stealth RNAi, epsin1 mouse GACUGGCUCUGAGGCUGUAUCACAA ThermoFisher N/A iBONI siRNA, eps15 mouse AAUACUCUCCCUUUGAACUUCCCCC Riboxx N/A iBONI siRNA, eps15L1 mouse UUUCAAAGAUGCCAUCAAACCCCC Riboxx N/A Stealth RNAi, epsin 2 human AAGAAAGCCGAAGGGACACAGUUAA ThermoFisher N/A iBONI siRNA, AP1μ mouse UUCUUCCGAUACUUGAUGCCCCC Riboxx N/A iBONI siRNA, AP3μ1 mouse UAAAUGGCUUAUACUUCUCCCCC Riboxx N/A iBONI siRNA, AP3μ2 mouse UACAUCCCAAGACAGCAUCCCCC Riboxx N/A iBONI siRNA, AP4μ mouse, pool of four oligos Riboxx N/A iBONI siRNA, AP5μ mouse AUAAUCCAGACCAGUAAGCCCCC Riboxx N/A Custom RT-qPCR primers for EGF-induced transcriptomic analysis See Table S1 See Table S1 Recombinant DNA pMSCV- CLTA-TagRFP Cocucci et al., 2012 N/A pMSCV-AP2σ2-EGFP Cocucci et al., 2012 N/A pSLIK-EGFR This paper N/A pSLIK-neo lentiviral vector Addgene ( Shin et al., 2006 ) Cat#25735 pSICOR-shRNA human eps15 Sigismund et al., 2005 N/A pSICOR-shRNA human eps15L1 Sigismund et al., 2005 N/A Software and Algorithms cmeAnalysis software package Aguet et al., 2013 N/A Contact for Reagent and Resourse Sharing Further information and requests for resources and reagents should be directed to and will be fulfilled by the Lead Contact, Sara Sigismund ( sara.sigismund@ieo.it ).
Experimental Model and Subject Details
HeLa cells (cervical cancer, female) were cultured were grown at 37°C and 5% CO 2 in GlutaMAX-Minimum Essential Medium (MEM, GIBCO Invitrogen), supplemented with 10% FBS, 1 mM sodium pyruvate (Euroclone), 0.1 mM non-essential amino acids (Euroclone).
Human-derived mostly diploid
SUM159 cells (breast cancer, female), gene edited to express AP2σ2-EGFP and CLTA-TagRFP, were grown at 37°C and 5% CO 2 in DMEM/F12 supplemented with 5% fetal bovine serum (FBS; S11150 ; Atlanta Biologicals, Flowery Branch, GA), 100 U/ml penicillin and streptomycin (45000-652; VWR International, Radnor, PA), 1 μg/ml hydrocortisone (H4001; Sigma-Aldrich, St. Louis, MO), 5 μg/ml insulin (I9278; Sigma-Aldrich), and 10 mM 4-(2-hydroxyethyl)- 1-piperazineethanesulfonic acid (HEPES; 25-060-CI; Mediatech, Manassas, VA), pH 7.4. AP2μ fl/fl mouse embryonic fibroblasts (MEFs) were isolated from AP2μ fl/fl mice ( Kononenko et al., 2014 ) as previously described ( Pozzi et al., 2012 ), and were spontaneously immortalized after a series of passages in cultures (information about sex of these cells is not available). AP2μ fl/fl MEFs were cultured at 37°C and 5% CO 2 in Dulbecco’s Modified Eagle Medium (DMEM, Lonza) supplemented with 10% FBS and glutamine 2 mM. Immortalized AP2μ fl/fl MEFs were infected with pMSCV retroviral vector expressing AP2σ2-EGFP and CLTA-TagRFP ( Cocucci et al., 2012 ) and subjected to selection with puromycin for 7 days. AP2-EGFR MEFs used in EM experiments ( Figures 4 C, 4D, and 5 D) were generated by infecting AP2-WT MEFs with pSLIK-EGFR inducible lentiviral vector. Forty-eight hours after infection, selection of infected cells was performed by adding neomycin at a concentration of 400 μg/ml for seven days. To induce expression of the EGFR transgene, doxycycline (0.05 μg/ml) was added to cell culture medium for 16 hours. Human cells were authenticated at each batch freezing by STR profiling (StemElite ID System, Promega). All cell lines were tested for mycoplasma at each batch freezing by PCR ( Uphoff and Drexler, 2002 ) and biochemical assay (MycoAlert, Lonza). Method Details EGF concentrations, constructs and antibodies Throughout the manuscript, we have used a low EGF concentration (1.5 ng/ml), unless otherwise indicated. Constructs pMSCV retroviral vectors expressing AP2σ2-EGFP and CLTA-TagRFP were previously described ( Cocucci et al., 2012 ); the pSLIK-EGFR vector was generated by subcloning the cDNA coding for human EGFR from a pBABE-based vector ( Sigismund et al., 2005 ) to the pSLIK-neo lentiviral vector [for inducible expression in mammalian cells ( Shin et al., 2006 )]. Antibodies rabbit polyclonal anti-EGFR (epitope: aa 1172-1186, Homo sapiens ), mouse anti-eps15 (epitope: aa 2-330, Mus musculus ), rabbit anti-eps15L1 (epitope: aa 216-266, Mus musculus ), mouse anti-epsin1/2 (epitope: aa 249-401 of epsin1, Homo sapiens ) were produced in-house and used in IB experiments.
Mouse anti-EGFR 13A9
(Genentech) was used to follow endocytosis in in vivo EM analyses. Anti-Alexa Fluor 488 (ThermoFisher) was used for cryosection immunolabeling for EM analysis. Other antibodies used in IB are listed in the Key Resources Table. CRE treatment of AP2μ fl/fl MEFs In order to induce the excision of the AP2 gene and the complete loss of AP2 protein expression, immortalized AP2μ fl/fl MEFs were treated with TAT-CRE recombinase produced in-house to obtain AP2-KO MEFs. Briefly, cells at 50%–60% confluency were washed twice in PBS and treated with 100 μg/mL of TAT-CRE in medium without serum at 37°C. After 1 h incubation, 50 μM chloroquine was added to the medium for an additional hour at 37°C. Cells were then washed twice in PBS and supplemented with normal culture medium. The TAT-CRE treatment was repeated after 3 days; this second round of treatment is recommended to increase the efficiency of recombination. Experiments were performed after 14 days from the first TAT-CRE treatment. The experiments of endocytosis with 125 I-EGF and 125 I-Tf were confirmed also in AP2μ fl/fl primary MEFs treated or not with CRE, obtaining the same results as with immortalized MEFs.
Genome editing of SUM159 cells using the TALEN-based approach
Human-derived mostly diploid
SUM159 cells were homozygously gene edited to express endogenous CLTA-TagRFP together with AP2σ2-EGFP using the TALEN protocol ( Sanjana et al., 2012 ). The TALEN target sequences were located as follow (the AP2σ2 downstream sequence overlaps with the stop codon underlined): 5′ - > 3′ targeting sequences position relative to stop codon CLTA TCTCCCTCAAGCAGGCCCCG −9 GTGGGACACCTTTGTGATGT +5 AP2σ2 TGGGGCTCGCCTGCCCTCAC −14 TGCTGAAACAGCTGC TGA TG 0 ∗ The cells were generated as described ( He et al., 2017 , Aguet et al., 2016 ). Briefly, SUM159 cells were co-transfected with the upstream and downstream TALEN targeting sequences and the donor construct coding for the fluorescent protein using TransIT-2020 Transfection Reagent (Mirus Bio LLC, Madison, WI). Cells expressing endogenous clathrin light chain A (CLTA gene) fused to TagRFP at its C terminus and endogenous σ2 of AP-2 (AP2S1 gene) fused at its C terminus with EGFP were sorted by flow cytometry single cell sorting. The insertion of the sequence coding for the fluorescent protein on both alleles was verified by PCR amplification from purified genomic DNA using GoTaq Polymerase (Promega, Madison, WI) using: for the CLTA gene, forward 5′-TTGTTGTTGCTTCCAGGGCA-3′ and reverse 5′-GCCAGGGAGAACACAGTTGA-3′ primers for the AP2S1 gene, forward 5′-TGAGGTCTGTGTCCCAGCTC-3′ and reverse 5′-GGTTACTCGGGACACACACG-3′ primers. TIRF based live-cell microscopy imaging and analysis The TIRF microscopy including cell plating was carried as described ( Aguet et al., 2016 , Cocucci et al., 2014 , Cocucci et al., 2012 ) using conditions that would allow detection of the fluorescence intensity from a single molecule of EGFP within a diffraction limited spot. SUM159 cells were plated onto glass coverslips for 3-4 h whereas MEF cells were plated onto the fibronectin-coated coverslips for 2-3 h, after which they were washed with sterile PBS, transferred onto an Attofluor Cell Chamber (Invitrogen) containing 800 μL of prewarmed MEMα without phenol red (GIBCO) supplemented with 5% FBS and then placed onto a temperature controlled sample holder (20/20 Technology, Wilmington) enclosed placed inside the environmentally controlled chamber of the microscope and time series acquired as described ( Aguet et al., 2016 , Cocucci et al., 2014 , Cocucci et al., 2012 ). Time series obtained using TIRF microscopy were analyzed using the cmeAnalysis software package ( Aguet et al., 2013 ) to trace clathrin-coated structures labeled with CLTA-TagRFP (master channel) and classified as those either containing AP2-σ2-EGFP for at least 40% of their lifetimes (AP2+) or those lacking AP2-σ2-EGFP (AP2-). A range of initial mean squared displacement (MSD) cutoffs (0.010, 0.0155 or 0.02 μm 2 ), calculated from the sum of the squares of displacement in x and y between the first and second time points, were used to differentiate relatively immobile clathrin structures initiating at the plasma membrane from those potentially originating at the trans-Golgi network or endosomes. The relatively immobile clathrin traces were then grouped according to their content of AP2 grouped by lifetimes. RNAi experiments For eps15/eps15L1 double KD, HeLa cells stably depleted using pSICOR-shRNA sequences directed against human eps15 and eps15 L1 were previously described ( Sigismund et al., 2005 ). These cells were subjected to transient RNAi-mediated knockdown for epsin1, epsin2, clathrin or AP2 in different combinations, as indicated. RNAi transfections were performed using LipofectAMINE RNAi MAX reagent from Invitrogen, according to manufacturer’s instructions. Cells were subjected to double transfection (in both suspension and adhesion), treated with 10 nM RNAi oligo (except for clathrin KD: 24 nM RNAi oligo). Cells were analyzed 4-5 days after transfection. RNAi oligos The negative control siRNA used in our assays was All Stars from QIAGEN. Other oligos were indicated in the Key Resources Table.
Quantitative real-time PCR analysis Total
RNA was extracted from HeLa and MEF cells (control, KD or KO, as indicated) using the RNeasy kit from QIAGEN, according to the manufacturer’s protocol. Single stranded cDNA synthesis was performed using the QuantiTect Reverse Transcription Kit (QIAGEN) following manufacturer’s instructions. For the analysis of KD levels by RT-qPCR, the Taqman chemistry (Thermo Fisher Scientific) was used; qPCR instrument was from Applied Biosystems. For the different genes, inventoried Taqman assays (Applied Biosystems) were employed, indicated in the Key Resources Table. For the transcriptomics analysis of EGF-induced genes ( Figures 7 A and 7B), total RNA was reverse-transcribed with SuperScript® VILO cDNA Synthesis Kit (Life Technologies cat.no. 11754050) and measured with Quantifast SYBR green master mix (QIAGEN) in Biorad Cfx384 RT-qPCR detection system. The complete list of primers used in this study is shown in Table S1 . Cell lysis and immunoblot (IB) Cells were lysed in RIPA buffer (50 mM Tris–HCl, 150 mM NaCl, 1 mM EDTA, 1% Triton X-100, 1% sodium deoxycholate, 0.1% SDS); protease inhibitor cocktail (CALBIOCHEM) and phosphatase inhibitors (20 mM sodium pyrophosphate pH 7.5, 50 mM NaF, 2 mM PMSF, 10 mM Na3VO4 pH 7.5) were freshly added. For EGF stimulation, HeLa or MEF cells were plated on five 10 cm dishes at 50% confluence. The day after, cells were serum starved for 16 h and then stimulated at the indicated time points with 1.5 ng/ml EGF. Total cell lysates (20-30 μg) were loaded onto 4%–20% gradient precast SDS polyacrylamide gels (BIORAD). IB and IP were performed as described ( Conte and Sigismund, 2017 , Penengo et al., 2006 ). Radioactive assays Surface EGFRs were measured by 125 I-EGF saturation binding as described ( Sigismund et al., 2013 ). Radioactive internalization assays were performed as described ( Caldieri et al., 2017 ) with 1.5 ng/ml of 125 I-EGF or 1 μg/ml of 125 I-Tf. Results are expressed as the internalization rate constant [Ke, ( Caldieri et al., 2017 )] or as a % of Ke in control cells, as indicated, and are the mean ± SD, calculated on duplicate points of at least two independent experiments. Degradation of 125 I-EGF at low dose was measured as described ( Sigismund et al., 2008 ). In brief, HeLa cells, subjected to KD as indicated, were serum-starved for 2 hours and then incubated with 1.5 ng/ml 125 I-EGF for 8 min at 37°C, followed by mild acid/salt treatment (0.2 M Na Acetate buffer pH 4.5, 0.5 M NaCl) for 5 min at 4°C to remove bound EGF. 125 I-EGF-loaded cells were then chased in medium without serum at 37°C for the indicated time points. At the end of each chase time, the medium was collected, the surface-bound 125 I-EGF was extracted by acid treatment (0.2 M acetic acid pH 2.8, 0.5 M NaCl), and the cells were lysed in 1 mM NaOH. The medium and intracellular lysate fractions were then TCA-precipitated to separate intact from degraded 125 I-EGF. Non-specific counts were measured for each time point in the presence of a 300-fold excess of cold ligand, and were never > 3%–10% of the total counts.
Cell migration assay
Cell migration assays were performed using a BD Boyden Chamber (BD Biosciences) with 8 μm pores, coated with Collagen I rat tail (10 μg/ml, BD Biosciences). Both chambers were filled with medium. The lower chamber contained serum-starved medium, EGF (1.5 ng/ml) or complete medium. Serum-starved cells (4x10 4 cells/well) were seeded into the upper chamber of the transwell and allowed to migrate overnight at 37°C. Three replicates for each condition were performed. After the incubation period, cells remaining in the upper chamber were washed away with PBS and removed by a cotton swab. Fixed cells were then stained with DAPI. Cells were counted in three randomly chosen fields using an inverted fluorescence microscope (10X magnification). Plasma membrane sheets (PMS) PMS were prepared as previously described ( Sanan and Anderson, 1991 ). Briefly, formvar/carbon coated nickel grids coated with 1 mg/ml poly-Lysine-D were placed on a pre-wet filter of cellulose acetate on ice. Cells were washed with KSHM buffer (100 mM potassium acetate, 85 mM sucrose, 20 mM HEPES-KOH, pH 7.4, and 1 mM magnesium acetate) and the coverslips were placed cells face down on the EM grids. The excess of buffer was aspirated with a pasture pipette attached to a vacuum pump and a rubber cork was pressed on the coverslip for 10 s. The coverslips were flipped over and the grids were fixed on ice for 30 min in 4% glutaraldehyde in KSHM buffer. PMS were then post-fixed in 1% OsO4 10 s on ice, 1% tannic acid, 1% uranyl acetate and finally rinsed in distilled water and air-dried. Grids were observed with a LEO 912AB Zeiss Transmission Electron Microscope (Carl Zeiss). Digital micrographs were taken with a 2k × 2k bottom-mounted slow-scan Proscan camera (ProScan) controlled by the EsivisionPro 3.2 software (Soft Imaging System) and analyzed using ImageJ as previously reported ( Grove et al., 2014 ). Transmission Electron Microscopy (TEM) For TEM analysis, cells treated as indicated were fixed for 1 h at room temperature in 2,5% glutaraldehyde in 100 mM NaCacodylate buffer pH 7.2 and then post-fixed in 1% osmium tetroxide, 1,5% potassium ferricyanide in 100 mM NaCacodylate buffer for 1 hour on ice. Alternatively, in order to discriminate plasma membrane connected pits, cells were fixed with 1.25% glutaraldehyde in 66 mM NaCacodylate buffer containing 0.5mg/ml ruthenium red. After several washes in 150 mM NaCacodylate buffer cells were post fixed in 1.3% osmium tetroxide in a 66 mM NaCacodylate buffer (pH 7.2) containing 0.5 mg/ml ruthenium red for 2 h at room temperature. Both samples were then rinsed in NaCacodylate buffer, washed with distilled water and enbloc stained with 0.5% uranyl acetate in dH 2 0 overnight at 4°C in the dark. Finally, samples were rinsed in dH 2 O, dehydrated with increasing concentrations of ethanol, embedded in Epon and cured in an oven at 60°C for 48 h. Ultrathin sections (70 – 90 nm) were obtained using an ultramicrotome (UC7, Leica microsystem, Vienna, Austria), collected, stained with uranyl acetate and Sato’s lead solutions, and observed in a Transmission Electron Microscope (Leo 912AB, Carl Zeiss, Oberkochen, Germany). Digital micrographs were taken with a 2Kx2K bottom mounted slow-scan camera (ProScan, Lagerlechfeld, Germany) controlled by the EsivisionPro 3.2 software (Soft Imaging System, Münster, Germany). For Morphometrical analysis images of the random selected cellular profiles were analyzed using ImageJ software. CCP density was calculated by dividing the number of CCP for PM length, and further normalized for the variation in cell size observed. Pre-embedding immunolabeling Serum-starved cells were incubated with anti-EGFR 13A9 antibody, followed by incubation with rabbit anti-mouse, and, finally, with Protein A-gold 10 nm (Utrecht University), 30 min incubation on ice/each step. Cells were then incubated at 37°C for 5 min with 30 ng/ml EGF. A control sample incubated with all reagents except anti-EGFR 13A9 antibody was included in the experiment to control that no internalization was induced by the secondary antibody and Protein A-gold 10 nm ( Figure S3 F). Cells were then washed in PBS and fixed for 1 h at room temperature in 1.2% glutaraldehyde in 66 mM sodium cacodylate buffer pH 7.2 containing 0.5 mg/ml of ruthenium red. After quick washes with 150 mM sodium cacodylate buffer, the samples were post-fixed in 1.3% osmium tetroxide in a 66 mM sodium cacodylate buffer (pH 7.2) containing 0.5 mg/ml ruthenium red for 2 h at room temperature. Cells were then rinsed with 150 mM NaCacodylate, washed with distilled water and enbloc stained with 0.5% uranyl acetate in dH20 overnight at 4°C in the dark. Finally, samples were rinsed in dH2O, dehydrated with increasing concentrations of ethanol, embedded in Epon and cured in an oven at 60°C for 48 h. Anti-EGF immunolabeling of cryosections As an independent procedure to visualize EGFR internalizing clathrin-coated pits (CCPs), we performed cryosection experiments ( Figures S3 F and S3G). Briefly, cells were stimulated with Alexa 488 EGF (30 ng/ml) for 5 min, fixed for 1 h at room temperature (0.2% glutaraldehyde/ 2% paraformaldehyde in PHEM Buffer 0.1 M) and processed as described previously ( Slot and Geuze, 2007 ). Briefly, samples were embedded in 12% gelatin, infiltrated in 2.3 M sucrose and frozen in liquid nitrogen. Cryosections were obtained using a Leica EM FC7 ultramicrotome (Leica microsystem, Vienna, Austria) and collected on 150 mesh formvar carbon-coated copper grids. The labeling procedure was carried out using a rabbit anti-Alexa Fluor 488 antibody (5 μg/ml) in 1% BSA in PBS that was afterward visualized with proteinA conjugated to 10 nm colloidal gold particles (Protein A-gold 10 nm, Utrecht University). Grids were contrasted in a solution of uranyl acetate and methyl-cellulose, air-dried and observed in a Talos L120C transmission electron microscope (Thermo Fisher Scientific).
Analysis of cell surface area and perimeter
Cells grown on coverslips were fixed and stained with phalloidin-FITC. Nuclei were counterstained with DAPI. Fluorescence imaging was performed with a Confocal Leica TCS SP5 using a 40X 1.40 NA oil objective and LAS software. Z stacks of different cells were collected. Images were analyzed using ImageJ software. Single cells were selected with ROIs (region of interest) and geometrical properties of each cell (perimeter, basal area, thickness as well as major and minor axis of the best fitting ellipse) were determined. Selected cells were approximated to elliptic cones shape and the total surface area calculated. Per each sample 50 cells were analyzed.
Quantification and Statistical Analysis
For radioactive assays, statistical analysis was performed using two-tailed Student’s t test with Excel when we compared two conditions. When more conditions were compared, Each Pair Student’s t test with JMP 10.0 statistical software (SAS Institute, Inc) was performed, which exploits the Fishers LSD test as a follow up to ANOVA. Quantitation of the blots was performed with Photoshop. Statistical analysis was performed using two-tailed Student’s t test with Excel. For migration assay, statistical analysis was performed using two-tailed Student’s t test with Excel. For PMS and TEM, images were analyzed with ImageJ and statistical analysis was performed using GraphPad Prism. Two tailed paired Student’s t test was used to calculate statistical significance among different samples.
Experimental Model and Subject Details
HeLa cells (cervical cancer, female) were cultured were grown at 37°C and 5% CO 2 in GlutaMAX-Minimum Essential Medium (MEM, GIBCO Invitrogen), supplemented with 10% FBS, 1 mM sodium pyruvate (Euroclone), 0.1 mM non-essential amino acids (Euroclone).
Human-derived mostly diploid
SUM159 cells (breast cancer, female), gene edited to express AP2σ2-EGFP and CLTA-TagRFP, were grown at 37°C and 5% CO 2 in DMEM/F12 supplemented with 5% fetal bovine serum (FBS; S11150 ; Atlanta Biologicals, Flowery Branch, GA), 100 U/ml penicillin and streptomycin (45000-652; VWR International, Radnor, PA), 1 μg/ml hydrocortisone (H4001; Sigma-Aldrich, St. Louis, MO), 5 μg/ml insulin (I9278; Sigma-Aldrich), and 10 mM 4-(2-hydroxyethyl)- 1-piperazineethanesulfonic acid (HEPES; 25-060-CI; Mediatech, Manassas, VA), pH 7.4. AP2μ fl/fl mouse embryonic fibroblasts (MEFs) were isolated from AP2μ fl/fl mice ( Kononenko et al., 2014 ) as previously described ( Pozzi et al., 2012 ), and were spontaneously immortalized after a series of passages in cultures (information about sex of these cells is not available). AP2μ fl/fl MEFs were cultured at 37°C and 5% CO 2 in Dulbecco’s Modified Eagle Medium (DMEM, Lonza) supplemented with 10% FBS and glutamine 2 mM. Immortalized AP2μ fl/fl MEFs were infected with pMSCV retroviral vector expressing AP2σ2-EGFP and CLTA-TagRFP ( Cocucci et al., 2012 ) and subjected to selection with puromycin for 7 days. AP2-EGFR MEFs used in EM experiments ( Figures 4 C, 4D, and 5 D) were generated by infecting AP2-WT MEFs with pSLIK-EGFR inducible lentiviral vector. Forty-eight hours after infection, selection of infected cells was performed by adding neomycin at a concentration of 400 μg/ml for seven days. To induce expression of the EGFR transgene, doxycycline (0.05 μg/ml) was added to cell culture medium for 16 hours. Human cells were authenticated at each batch freezing by STR profiling (StemElite ID System, Promega). All cell lines were tested for mycoplasma at each batch freezing by PCR ( Uphoff and Drexler, 2002 ) and biochemical assay (MycoAlert, Lonza).
Method Details EGF concentrations, constructs and antibodies Throughout the manuscript, we have used a low EGF concentration (1.5 ng/ml), unless otherwise indicated. Constructs pMSCV retroviral vectors expressing AP2σ2-EGFP and CLTA-TagRFP were previously described ( Cocucci et al., 2012 ); the pSLIK-EGFR vector was generated by subcloning the cDNA coding for human EGFR from a pBABE-based vector ( Sigismund et al., 2005 ) to the pSLIK-neo lentiviral vector [for inducible expression in mammalian cells ( Shin et al., 2006 )]. Antibodies rabbit polyclonal anti-EGFR (epitope: aa 1172-1186, Homo sapiens ), mouse anti-eps15 (epitope: aa 2-330, Mus musculus ), rabbit anti-eps15L1 (epitope: aa 216-266, Mus musculus ), mouse anti-epsin1/2 (epitope: aa 249-401 of epsin1, Homo sapiens ) were produced in-house and used in IB experiments.
Mouse anti-EGFR 13A9
(Genentech) was used to follow endocytosis in in vivo EM analyses. Anti-Alexa Fluor 488 (ThermoFisher) was used for cryosection immunolabeling for EM analysis. Other antibodies used in IB are listed in the Key Resources Table. CRE treatment of AP2μ fl/fl MEFs In order to induce the excision of the AP2 gene and the complete loss of AP2 protein expression, immortalized AP2μ fl/fl MEFs were treated with TAT-CRE recombinase produced in-house to obtain AP2-KO MEFs. Briefly, cells at 50%–60% confluency were washed twice in PBS and treated with 100 μg/mL of TAT-CRE in medium without serum at 37°C. After 1 h incubation, 50 μM chloroquine was added to the medium for an additional hour at 37°C. Cells were then washed twice in PBS and supplemented with normal culture medium. The TAT-CRE treatment was repeated after 3 days; this second round of treatment is recommended to increase the efficiency of recombination. Experiments were performed after 14 days from the first TAT-CRE treatment. The experiments of endocytosis with 125 I-EGF and 125 I-Tf were confirmed also in AP2μ fl/fl primary MEFs treated or not with CRE, obtaining the same results as with immortalized MEFs.
Genome editing of SUM159 cells using the TALEN-based approach
Human-derived mostly diploid
SUM159 cells were homozygously gene edited to express endogenous CLTA-TagRFP together with AP2σ2-EGFP using the TALEN protocol ( Sanjana et al., 2012 ). The TALEN target sequences were located as follow (the AP2σ2 downstream sequence overlaps with the stop codon underlined): 5′ - > 3′ targeting sequences position relative to stop codon CLTA TCTCCCTCAAGCAGGCCCCG −9 GTGGGACACCTTTGTGATGT +5 AP2σ2 TGGGGCTCGCCTGCCCTCAC −14 TGCTGAAACAGCTGC TGA TG 0 ∗ The cells were generated as described ( He et al., 2017 , Aguet et al., 2016 ). Briefly, SUM159 cells were co-transfected with the upstream and downstream TALEN targeting sequences and the donor construct coding for the fluorescent protein using TransIT-2020 Transfection Reagent (Mirus Bio LLC, Madison, WI). Cells expressing endogenous clathrin light chain A (CLTA gene) fused to TagRFP at its C terminus and endogenous σ2 of AP-2 (AP2S1 gene) fused at its C terminus with EGFP were sorted by flow cytometry single cell sorting. The insertion of the sequence coding for the fluorescent protein on both alleles was verified by PCR amplification from purified genomic DNA using GoTaq Polymerase (Promega, Madison, WI) using: for the CLTA gene, forward 5′-TTGTTGTTGCTTCCAGGGCA-3′ and reverse 5′-GCCAGGGAGAACACAGTTGA-3′ primers for the AP2S1 gene, forward 5′-TGAGGTCTGTGTCCCAGCTC-3′ and reverse 5′-GGTTACTCGGGACACACACG-3′ primers. TIRF based live-cell microscopy imaging and analysis The TIRF microscopy including cell plating was carried as described ( Aguet et al., 2016 , Cocucci et al., 2014 , Cocucci et al., 2012 ) using conditions that would allow detection of the fluorescence intensity from a single molecule of EGFP within a diffraction limited spot. SUM159 cells were plated onto glass coverslips for 3-4 h whereas MEF cells were plated onto the fibronectin-coated coverslips for 2-3 h, after which they were washed with sterile PBS, transferred onto an Attofluor Cell Chamber (Invitrogen) containing 800 μL of prewarmed MEMα without phenol red (GIBCO) supplemented with 5% FBS and then placed onto a temperature controlled sample holder (20/20 Technology, Wilmington) enclosed placed inside the environmentally controlled chamber of the microscope and time series acquired as described ( Aguet et al., 2016 , Cocucci et al., 2014 , Cocucci et al., 2012 ). Time series obtained using TIRF microscopy were analyzed using the cmeAnalysis software package ( Aguet et al., 2013 ) to trace clathrin-coated structures labeled with CLTA-TagRFP (master channel) and classified as those either containing AP2-σ2-EGFP for at least 40% of their lifetimes (AP2+) or those lacking AP2-σ2-EGFP (AP2-). A range of initial mean squared displacement (MSD) cutoffs (0.010, 0.0155 or 0.02 μm 2 ), calculated from the sum of the squares of displacement in x and y between the first and second time points, were used to differentiate relatively immobile clathrin structures initiating at the plasma membrane from those potentially originating at the trans-Golgi network or endosomes. The relatively immobile clathrin traces were then grouped according to their content of AP2 grouped by lifetimes. RNAi experiments For eps15/eps15L1 double KD, HeLa cells stably depleted using pSICOR-shRNA sequences directed against human eps15 and eps15 L1 were previously described ( Sigismund et al., 2005 ). These cells were subjected to transient RNAi-mediated knockdown for epsin1, epsin2, clathrin or AP2 in different combinations, as indicated. RNAi transfections were performed using LipofectAMINE RNAi MAX reagent from Invitrogen, according to manufacturer’s instructions. Cells were subjected to double transfection (in both suspension and adhesion), treated with 10 nM RNAi oligo (except for clathrin KD: 24 nM RNAi oligo). Cells were analyzed 4-5 days after transfection. RNAi oligos The negative control siRNA used in our assays was All Stars from QIAGEN. Other oligos were indicated in the Key Resources Table.
Quantitative real-time PCR analysis Total
RNA was extracted from HeLa and MEF cells (control, KD or KO, as indicated) using the RNeasy kit from QIAGEN, according to the manufacturer’s protocol. Single stranded cDNA synthesis was performed using the QuantiTect Reverse Transcription Kit (QIAGEN) following manufacturer’s instructions. For the analysis of KD levels by RT-qPCR, the Taqman chemistry (Thermo Fisher Scientific) was used; qPCR instrument was from Applied Biosystems. For the different genes, inventoried Taqman assays (Applied Biosystems) were employed, indicated in the Key Resources Table. For the transcriptomics analysis of EGF-induced genes ( Figures 7 A and 7B), total RNA was reverse-transcribed with SuperScript® VILO cDNA Synthesis Kit (Life Technologies cat.no. 11754050) and measured with Quantifast SYBR green master mix (QIAGEN) in Biorad Cfx384 RT-qPCR detection system. The complete list of primers used in this study is shown in Table S1 . Cell lysis and immunoblot (IB) Cells were lysed in RIPA buffer (50 mM Tris–HCl, 150 mM NaCl, 1 mM EDTA, 1% Triton X-100, 1% sodium deoxycholate, 0.1% SDS); protease inhibitor cocktail (CALBIOCHEM) and phosphatase inhibitors (20 mM sodium pyrophosphate pH 7.5, 50 mM NaF, 2 mM PMSF, 10 mM Na3VO4 pH 7.5) were freshly added. For EGF stimulation, HeLa or MEF cells were plated on five 10 cm dishes at 50% confluence. The day after, cells were serum starved for 16 h and then stimulated at the indicated time points with 1.5 ng/ml EGF. Total cell lysates (20-30 μg) were loaded onto 4%–20% gradient precast SDS polyacrylamide gels (BIORAD). IB and IP were performed as described ( Conte and Sigismund, 2017 , Penengo et al., 2006 ). Radioactive assays Surface EGFRs were measured by 125 I-EGF saturation binding as described ( Sigismund et al., 2013 ). Radioactive internalization assays were performed as described ( Caldieri et al., 2017 ) with 1.5 ng/ml of 125 I-EGF or 1 μg/ml of 125 I-Tf. Results are expressed as the internalization rate constant [Ke, ( Caldieri et al., 2017 )] or as a % of Ke in control cells, as indicated, and are the mean ± SD, calculated on duplicate points of at least two independent experiments. Degradation of 125 I-EGF at low dose was measured as described ( Sigismund et al., 2008 ). In brief, HeLa cells, subjected to KD as indicated, were serum-starved for 2 hours and then incubated with 1.5 ng/ml 125 I-EGF for 8 min at 37°C, followed by mild acid/salt treatment (0.2 M Na Acetate buffer pH 4.5, 0.5 M NaCl) for 5 min at 4°C to remove bound EGF. 125 I-EGF-loaded cells were then chased in medium without serum at 37°C for the indicated time points. At the end of each chase time, the medium was collected, the surface-bound 125 I-EGF was extracted by acid treatment (0.2 M acetic acid pH 2.8, 0.5 M NaCl), and the cells were lysed in 1 mM NaOH. The medium and intracellular lysate fractions were then TCA-precipitated to separate intact from degraded 125 I-EGF. Non-specific counts were measured for each time point in the presence of a 300-fold excess of cold ligand, and were never > 3%–10% of the total counts.
Cell migration assay
Cell migration assays were performed using a BD Boyden Chamber (BD Biosciences) with 8 μm pores, coated with Collagen I rat tail (10 μg/ml, BD Biosciences). Both chambers were filled with medium. The lower chamber contained serum-starved medium, EGF (1.5 ng/ml) or complete medium. Serum-starved cells (4x10 4 cells/well) were seeded into the upper chamber of the transwell and allowed to migrate overnight at 37°C. Three replicates for each condition were performed. After the incubation period, cells remaining in the upper chamber were washed away with PBS and removed by a cotton swab. Fixed cells were then stained with DAPI. Cells were counted in three randomly chosen fields using an inverted fluorescence microscope (10X magnification). Plasma membrane sheets (PMS) PMS were prepared as previously described ( Sanan and Anderson, 1991 ). Briefly, formvar/carbon coated nickel grids coated with 1 mg/ml poly-Lysine-D were placed on a pre-wet filter of cellulose acetate on ice. Cells were washed with KSHM buffer (100 mM potassium acetate, 85 mM sucrose, 20 mM HEPES-KOH, pH 7.4, and 1 mM magnesium acetate) and the coverslips were placed cells face down on the EM grids. The excess of buffer was aspirated with a pasture pipette attached to a vacuum pump and a rubber cork was pressed on the coverslip for 10 s. The coverslips were flipped over and the grids were fixed on ice for 30 min in 4% glutaraldehyde in KSHM buffer. PMS were then post-fixed in 1% OsO4 10 s on ice, 1% tannic acid, 1% uranyl acetate and finally rinsed in distilled water and air-dried. Grids were observed with a LEO 912AB Zeiss Transmission Electron Microscope (Carl Zeiss). Digital micrographs were taken with a 2k × 2k bottom-mounted slow-scan Proscan camera (ProScan) controlled by the EsivisionPro 3.2 software (Soft Imaging System) and analyzed using ImageJ as previously reported ( Grove et al., 2014 ). Transmission Electron Microscopy (TEM) For TEM analysis, cells treated as indicated were fixed for 1 h at room temperature in 2,5% glutaraldehyde in 100 mM NaCacodylate buffer pH 7.2 and then post-fixed in 1% osmium tetroxide, 1,5% potassium ferricyanide in 100 mM NaCacodylate buffer for 1 hour on ice. Alternatively, in order to discriminate plasma membrane connected pits, cells were fixed with 1.25% glutaraldehyde in 66 mM NaCacodylate buffer containing 0.5mg/ml ruthenium red. After several washes in 150 mM NaCacodylate buffer cells were post fixed in 1.3% osmium tetroxide in a 66 mM NaCacodylate buffer (pH 7.2) containing 0.5 mg/ml ruthenium red for 2 h at room temperature. Both samples were then rinsed in NaCacodylate buffer, washed with distilled water and enbloc stained with 0.5% uranyl acetate in dH 2 0 overnight at 4°C in the dark. Finally, samples were rinsed in dH 2 O, dehydrated with increasing concentrations of ethanol, embedded in Epon and cured in an oven at 60°C for 48 h. Ultrathin sections (70 – 90 nm) were obtained using an ultramicrotome (UC7, Leica microsystem, Vienna, Austria), collected, stained with uranyl acetate and Sato’s lead solutions, and observed in a Transmission Electron Microscope (Leo 912AB, Carl Zeiss, Oberkochen, Germany). Digital micrographs were taken with a 2Kx2K bottom mounted slow-scan camera (ProScan, Lagerlechfeld, Germany) controlled by the EsivisionPro 3.2 software (Soft Imaging System, Münster, Germany). For Morphometrical analysis images of the random selected cellular profiles were analyzed using ImageJ software. CCP density was calculated by dividing the number of CCP for PM length, and further normalized for the variation in cell size observed. Pre-embedding immunolabeling Serum-starved cells were incubated with anti-EGFR 13A9 antibody, followed by incubation with rabbit anti-mouse, and, finally, with Protein A-gold 10 nm (Utrecht University), 30 min incubation on ice/each step. Cells were then incubated at 37°C for 5 min with 30 ng/ml EGF. A control sample incubated with all reagents except anti-EGFR 13A9 antibody was included in the experiment to control that no internalization was induced by the secondary antibody and Protein A-gold 10 nm ( Figure S3 F). Cells were then washed in PBS and fixed for 1 h at room temperature in 1.2% glutaraldehyde in 66 mM sodium cacodylate buffer pH 7.2 containing 0.5 mg/ml of ruthenium red. After quick washes with 150 mM sodium cacodylate buffer, the samples were post-fixed in 1.3% osmium tetroxide in a 66 mM sodium cacodylate buffer (pH 7.2) containing 0.5 mg/ml ruthenium red for 2 h at room temperature. Cells were then rinsed with 150 mM NaCacodylate, washed with distilled water and enbloc stained with 0.5% uranyl acetate in dH20 overnight at 4°C in the dark. Finally, samples were rinsed in dH2O, dehydrated with increasing concentrations of ethanol, embedded in Epon and cured in an oven at 60°C for 48 h. Anti-EGF immunolabeling of cryosections As an independent procedure to visualize EGFR internalizing clathrin-coated pits (CCPs), we performed cryosection experiments ( Figures S3 F and S3G). Briefly, cells were stimulated with Alexa 488 EGF (30 ng/ml) for 5 min, fixed for 1 h at room temperature (0.2% glutaraldehyde/ 2% paraformaldehyde in PHEM Buffer 0.1 M) and processed as described previously ( Slot and Geuze, 2007 ). Briefly, samples were embedded in 12% gelatin, infiltrated in 2.3 M sucrose and frozen in liquid nitrogen. Cryosections were obtained using a Leica EM FC7 ultramicrotome (Leica microsystem, Vienna, Austria) and collected on 150 mesh formvar carbon-coated copper grids. The labeling procedure was carried out using a rabbit anti-Alexa Fluor 488 antibody (5 μg/ml) in 1% BSA in PBS that was afterward visualized with proteinA conjugated to 10 nm colloidal gold particles (Protein A-gold 10 nm, Utrecht University). Grids were contrasted in a solution of uranyl acetate and methyl-cellulose, air-dried and observed in a Talos L120C transmission electron microscope (Thermo Fisher Scientific).
Analysis of cell surface area and perimeter
Cells grown on coverslips were fixed and stained with phalloidin-FITC. Nuclei were counterstained with DAPI. Fluorescence imaging was performed with a Confocal Leica TCS SP5 using a 40X 1.40 NA oil objective and LAS software. Z stacks of different cells were collected. Images were analyzed using ImageJ software. Single cells were selected with ROIs (region of interest) and geometrical properties of each cell (perimeter, basal area, thickness as well as major and minor axis of the best fitting ellipse) were determined. Selected cells were approximated to elliptic cones shape and the total surface area calculated. Per each sample 50 cells were analyzed.
Supplemental Information Document S1. Figures S1–S6 and Table S1 Document S2. Article plus Supplemental Information
📊 Figures
Figureu00a01
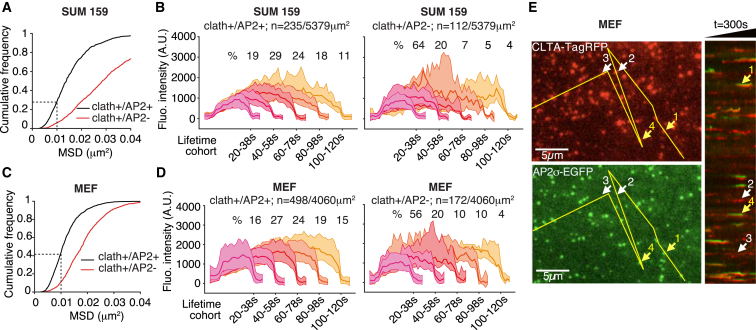
Live TIRF Imaging of CCPs in SUM159 and AP2-WT MEF Cells (A) Cumulative frequency distribution of the initial mean square displacement (MSD) of clathrin-coated structures containing or not AP2 in SUM1...
Figureu00a02
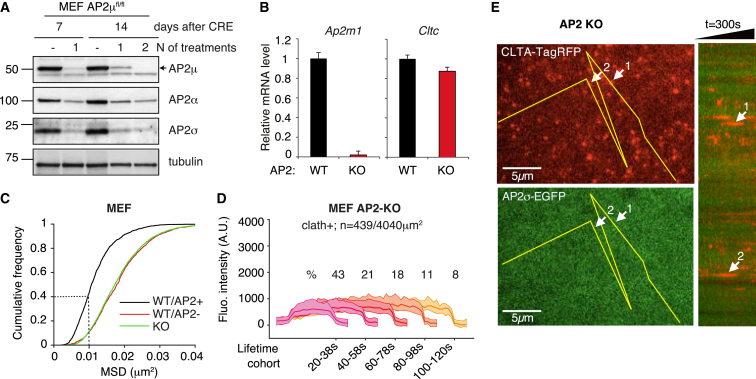
Live TIRF Imaging of CCPs in AP2 KO MEF Cells (A) MEFs from conditional AP2u03bc fl/fl mice ( Figureu00a0S2 A) were treated inu00a0vitro with CRE recombinase, as indicated, followed by immunoblotting ...
Figureu00a03
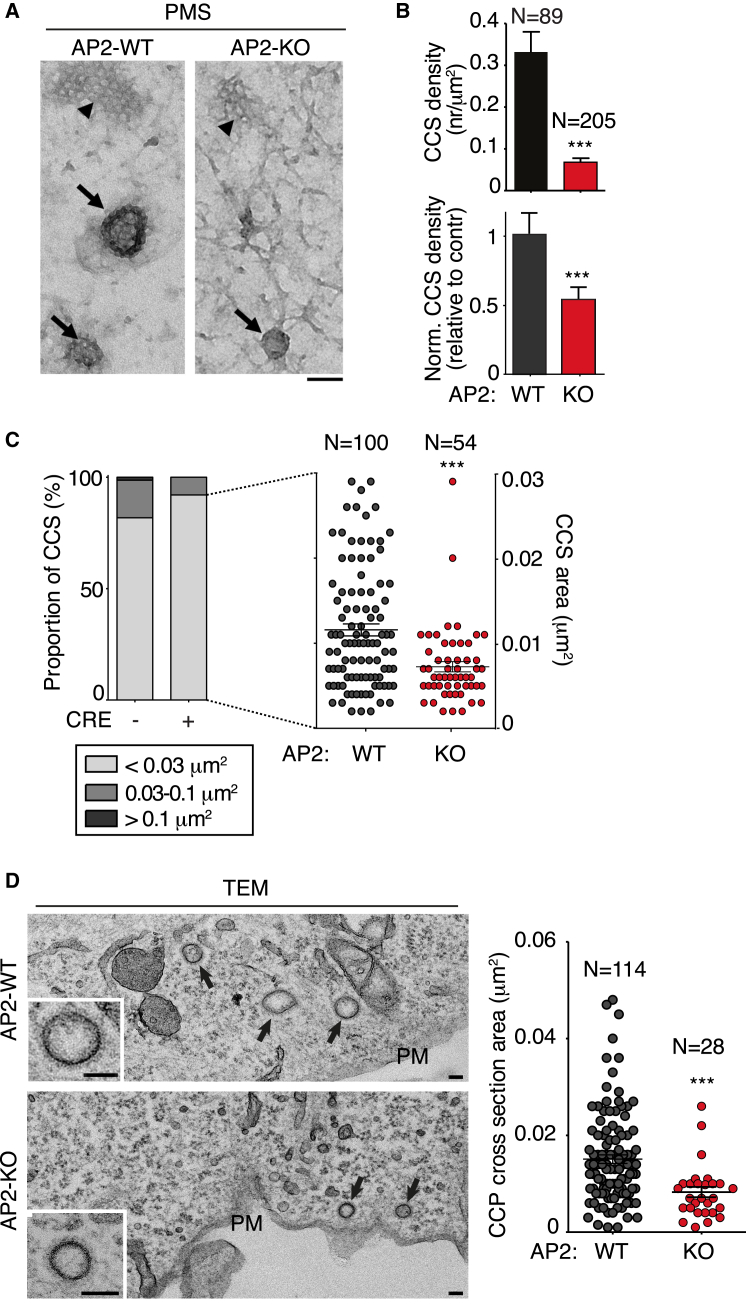
Morphological Characterization of CCPs in AP2-WT and AP2-KO Cells (A) Plasma membrane sheets (PMSs) of AP2-WT and AP2-KO MEFs showing examples of clathrin-coated structures (arrowheads, flat clathrin ...
Figureu00a04
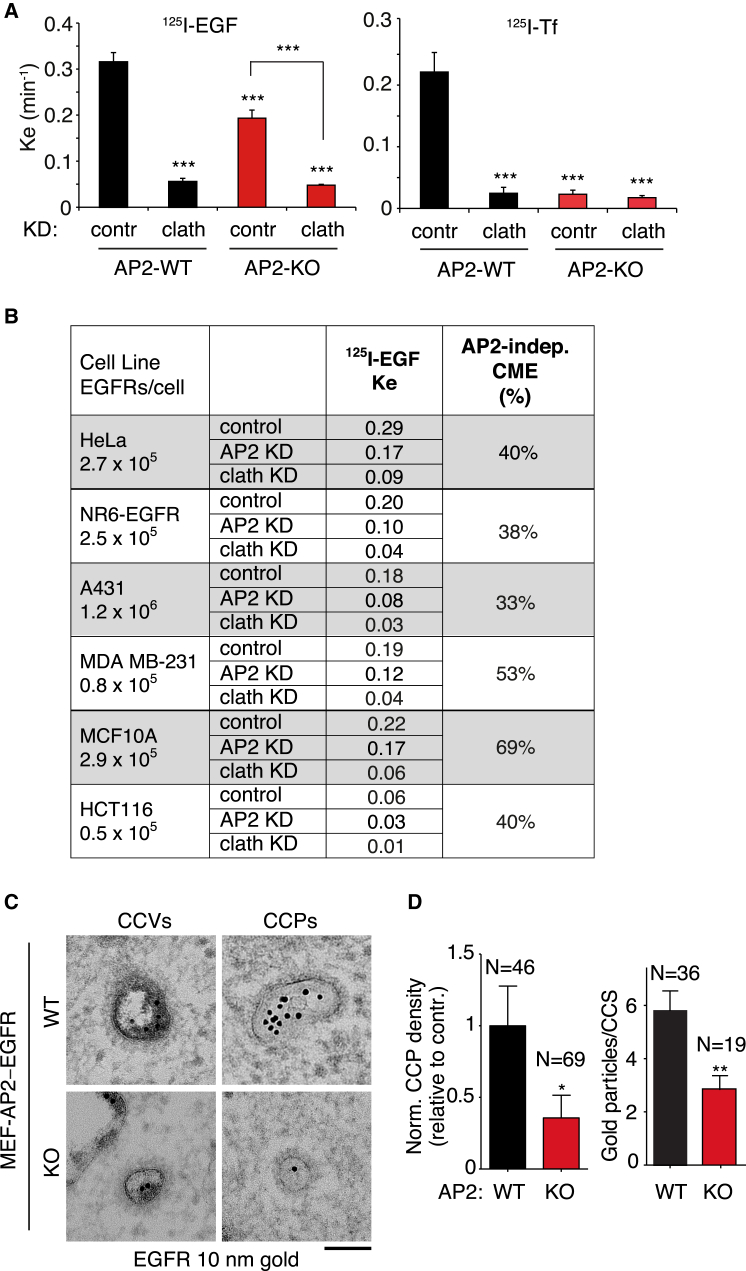
EGF Internalization in AP2-KO MEFs or upon AP2-KD in Different Cell Contexts (A) 125 I-EGF (left) and 125 I-Tf (right) internalization in AP2-WT and AP2-KO MEFs in the presence or absence of clathrin ...
Figureu00a05
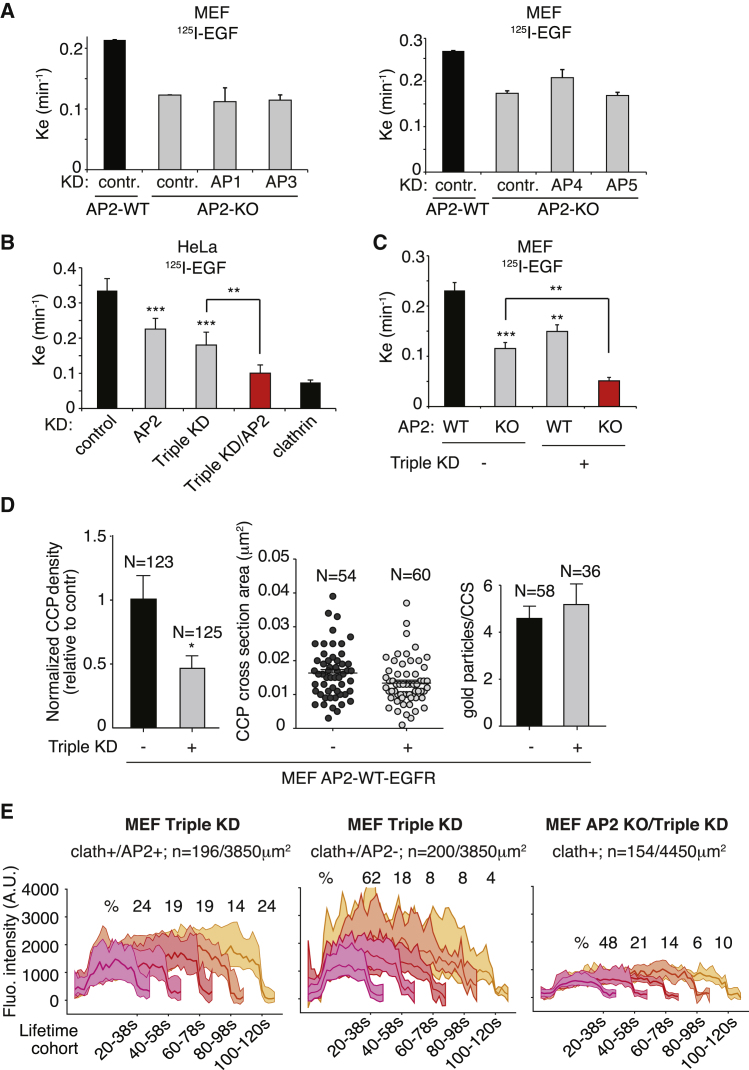
Mechanism of AP2-Independent EGFR-CME: Role of eps15/L1 and epsin1 (A) Transient KD of the u03bc subunit of the indicated AP complexes was performed in AP2-KO MEFs, and K e of 125 I-EGF internalizatio...
Figureu00a06
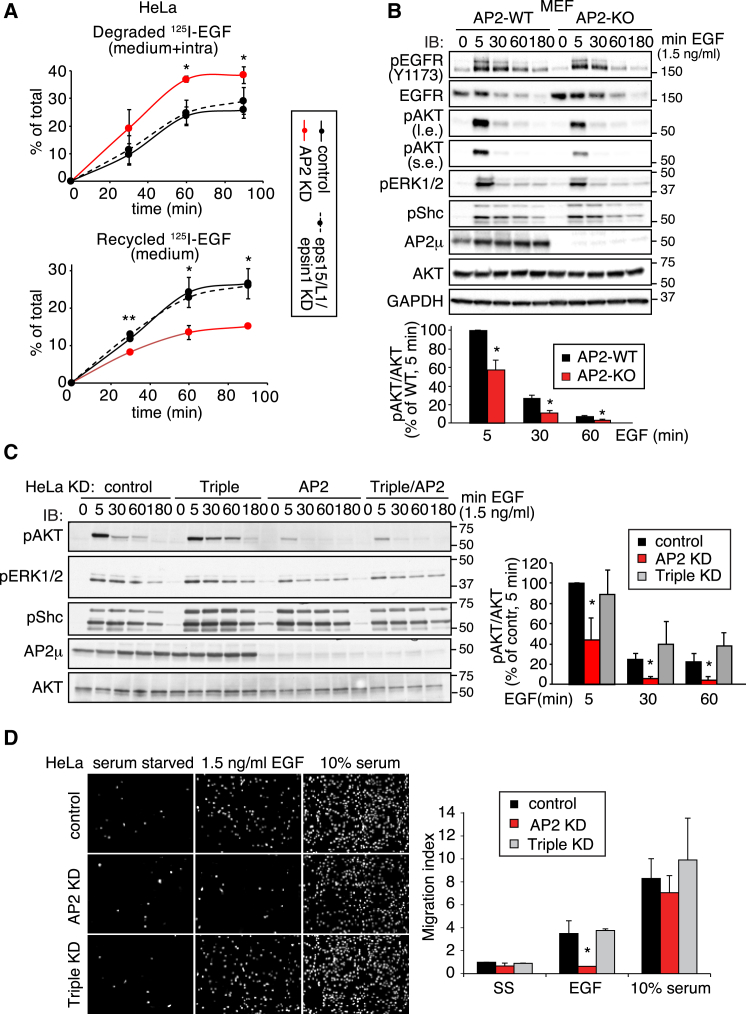
EGF-Dependent Signaling and Migration in AP2-Depleted Cells (A) HeLa cells were subjected to AP2 KD or eps15/L1/epsin1 KD followed by 125 I-EGF degradation assay at low EGF concentration (1.5u00a0ng/m...
Figureu00a07
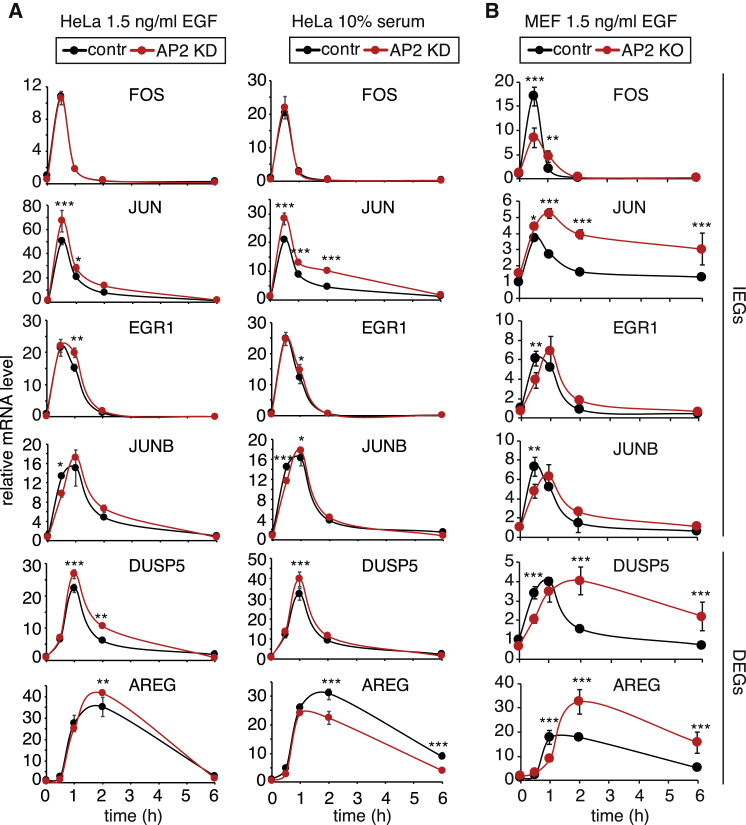
EGF-Dependent Transcriptional Output in AP2-Depleted Cells (A) Control or AP2 KD HeLa cells were serum starved overnight followed by stimulation with low-dose EGF (1.5u00a0ng/mL) or with complete medi...
Figure images are served from the NIH/NLM PubMed Central Open Access Subset or Europe PMC; copyright remains with the publishers and authors.
💬 Discussion
0 commentsNo comments yet. Be the first to start a discussion!
Leave a Comment