Abstract
Abstract Cas12f, also known as Cas14, is an exceptionally small type V-F CRISPR–Cas nuclease that is roughly half the size of comparable nucleases of this type. To reveal the mechanisms underlying substrate recognition and cleavage, we determined the cryo-EM structures of the Cas12f-sgRNA-target DNA and Cas12f-sgRNA complexes at 3.1 and 3.9 Å, respectively. An asymmetric Cas12f dimer is bound to one sgRNA for recognition and cleavage of dsDNA substrate with a T-rich PAM sequence. Despite its dimerization, Cas12f adopts a conserved activation mechanism among the type V nucleases which requires coordinated conformational changes induced by the formation of the crRNA-target DNA heteroduplex, including the close-to-open transition in the lid motif of the RuvC domain. Only one RuvC domain in the Cas12f dimer is activated by substrate recognition, and the substrate bound to the activated RuvC domain is captured in the structure. Structure-assisted truncated sgRNA, which is less than half the length of the original sgRNA, is still active for target DNA cleavage. Our results expand our understanding of the diverse type V CRISPR–Cas nucleases and facilitate potential genome editing applications using the miniature Cas12f.
🔬 Techniques
🧬 Organisms
💻 Software
✨ Fluorophores
🧪 Sample Preparation
🔬 Cell Lines
🏭 Microscope Brands
🧪 Reagent Suppliers
💻 Software Details
💾 Data Repositories
🏛️ Research Organizations (ROR)
Affiliated research institutions:
📋 Methods
Protein expression and purification
The plasmid encoding full-length Cas12f (UnCas12f1) was purchased from Addgene #112500 with an N-terminal 10xHis-MBP-tag. The plasmid was transformed into Escherichia coli BL21(DE3) cells and grown to OD 600 = 0.5 in Terrific Broth (TB). Protein overexpression was induced by adding 0.5 mM IPTG followed by incubation at 18°C overnight. The cells were collected and then resuspended in buffer A containing 25 mM Tris–HCl (pH 7.6), 1 M NaCl, 5% glycerol, 1 mM PMSF and 5 mM β‐mercaptoethanol, and disrupted by sonication. Cell lysate was clarified by centrifugation. The supernatant was loaded onto Ni-NTA resin, washed with buffer B containing 25 mM Tris–HCl (pH 7.6), 1 M NaCl, 30 mM imidazole, and 5 mM β‐mercaptoethanol, and the Cas12f protein was eluted by buffer B supplemented with 250 mM imidazole. The His-MBP-tag was removed by overnight incubation with TEV protease at 4°C. The target protein was exchanged into buffer C containing 25 mM Tris–HCl (pH 7.6), 500 mM NaCl, 2 mM DTT and 5% glycerol, loaded onto a HiTrap SP HP column (GE Healthcare), and eluted with a linear NaCl gradient (0.1– 2 M) followed by size exclusion chromatography over a Superdex 200 (GE Healthcare) in buffer D containing 25 mM Tris–HCl (pH 7.6), 150 mM NaCl, 2 mM DTT and 1 mM MgCl 2 . Fractions were concentrated and stored at –80°C. To assemble the Cas12f–sgRNA binary complex, Cas12f proteins were incubated with sgRNA ( Supplementary Table S1 ) at a ratio of 1:1.2 at 37°C for 30 min in buffer D. To reconstitute the Cas12f–sgRNA–target DNA complex, Cas12f D510A mutant proteins were incubated with guide RNA at 37°C for 30 min followed by adding the target DNA ( Supplementary Table S1 ) synthesized from IDT at a ratio of 1:1.2:1.3. After 30 min, the reaction mixture was subjected to SEC over a Superdex 200 column (GE Healthcare) equilibrated with buffer D for further purification. sgRNA preparation sgRNAs were produced by in vitro transcription using the HiScribe T7 High Yield RNA synthesis kit (NEB) with PCR amplified gBlocks (IDT) as templates. sgRNAs were purified over a Resource-Q column (GE Healthcare) and eluted with a linear NaCl gradient (50 mM-1000 mM) in 25 mM Tris–HCl (pH 8.0). The eluted sgRNAs were concentrated and stored at –80°C Mutagenesis Single amino acid mutations were introduced by the QuikChange site-directed mutagenesis method. Mutations with multiple amino acids were introduced by ligating inverse PCR-amplified backbone with mutations bearing DNA oligonucleotides via the In-Fusion Cloning Kit (ClonTech). All mutants were confirmed by Sanger sequencing. In vitro DNA cleavage assay Target DNA containing the 5′-TTTA-3′ PAM was ordered from IDT and cloned into a pET28-MHL vector using the In-Fusion Cloning Kit (ClonTech). Plasmids were linearized before usage. Cas12f proteins (200 nM) were mixed with guide RNA at a ratio of 1:1.1 at 37°C for 30 min in cleavage buffer containing 2.5 mM Tris–HCl (pH 7.6), 50 mM NaCl, 10 mM MgCl 2 , and 0.5 mM DTT, and then linearized plasmids (5 nM) were added. The reactions were quenched by adding EDTA and proteinase K (Thermo Fisher Scientific) after 45 min. The cleavage products were resolved on 0.7% agarose gels and visualized by ethidium bromide staining.
Show full methods section
Protein expression and purification
The plasmid encoding full-length Cas12f (UnCas12f1) was purchased from Addgene #112500 with an N-terminal 10xHis-MBP-tag. The plasmid was transformed into Escherichia coli BL21(DE3) cells and grown to OD 600 = 0.5 in Terrific Broth (TB). Protein overexpression was induced by adding 0.5 mM IPTG followed by incubation at 18°C overnight. The cells were collected and then resuspended in buffer A containing 25 mM Tris–HCl (pH 7.6), 1 M NaCl, 5% glycerol, 1 mM PMSF and 5 mM β‐mercaptoethanol, and disrupted by sonication. Cell lysate was clarified by centrifugation. The supernatant was loaded onto Ni-NTA resin, washed with buffer B containing 25 mM Tris–HCl (pH 7.6), 1 M NaCl, 30 mM imidazole, and 5 mM β‐mercaptoethanol, and the Cas12f protein was eluted by buffer B supplemented with 250 mM imidazole. The His-MBP-tag was removed by overnight incubation with TEV protease at 4°C. The target protein was exchanged into buffer C containing 25 mM Tris–HCl (pH 7.6), 500 mM NaCl, 2 mM DTT and 5% glycerol, loaded onto a HiTrap SP HP column (GE Healthcare), and eluted with a linear NaCl gradient (0.1– 2 M) followed by size exclusion chromatography over a Superdex 200 (GE Healthcare) in buffer D containing 25 mM Tris–HCl (pH 7.6), 150 mM NaCl, 2 mM DTT and 1 mM MgCl 2 . Fractions were concentrated and stored at –80°C. To assemble the Cas12f–sgRNA binary complex, Cas12f proteins were incubated with sgRNA ( Supplementary Table S1 ) at a ratio of 1:1.2 at 37°C for 30 min in buffer D. To reconstitute the Cas12f–sgRNA–target DNA complex, Cas12f D510A mutant proteins were incubated with guide RNA at 37°C for 30 min followed by adding the target DNA ( Supplementary Table S1 ) synthesized from IDT at a ratio of 1:1.2:1.3. After 30 min, the reaction mixture was subjected to SEC over a Superdex 200 column (GE Healthcare) equilibrated with buffer D for further purification. sgRNA preparation sgRNAs were produced by in vitro transcription using the HiScribe T7 High Yield RNA synthesis kit (NEB) with PCR amplified gBlocks (IDT) as templates. sgRNAs were purified over a Resource-Q column (GE Healthcare) and eluted with a linear NaCl gradient (50 mM-1000 mM) in 25 mM Tris–HCl (pH 8.0). The eluted sgRNAs were concentrated and stored at –80°C Mutagenesis Single amino acid mutations were introduced by the QuikChange site-directed mutagenesis method. Mutations with multiple amino acids were introduced by ligating inverse PCR-amplified backbone with mutations bearing DNA oligonucleotides via the In-Fusion Cloning Kit (ClonTech). All mutants were confirmed by Sanger sequencing. In vitro DNA cleavage assay Target DNA containing the 5′-TTTA-3′ PAM was ordered from IDT and cloned into a pET28-MHL vector using the In-Fusion Cloning Kit (ClonTech). Plasmids were linearized before usage. Cas12f proteins (200 nM) were mixed with guide RNA at a ratio of 1:1.1 at 37°C for 30 min in cleavage buffer containing 2.5 mM Tris–HCl (pH 7.6), 50 mM NaCl, 10 mM MgCl 2 , and 0.5 mM DTT, and then linearized plasmids (5 nM) were added. The reactions were quenched by adding EDTA and proteinase K (Thermo Fisher Scientific) after 45 min. The cleavage products were resolved on 0.7% agarose gels and visualized by ethidium bromide staining.
Electron microscopy
Aliquots of 4 μl Cas12f-sgRNA binary complex (1 mg/ml) and Cas12f-sgRNA-dsDNA ternary complex (1 mg/ml) were applied to glow-discharged UltrAuFoil holey gold grids (R1.2/1.3, 300 mesh). The grids were blotted for 2 s and plunged into liquid ethane using a Vitrobot Mark IV. Cryo-EM data were collected with a Titan Krios microscope (FEI) operated at 300 kV and images were collected using Leginon ( 27 ) at a nominal magnification of 81 000× (resulting in a calibrated physical pixel size of 1.05 Å/pixel) with a defocus range of –0.8 to –2.0 μm. The images were recorded on a K3 electron direct detector in super-resolution mode at the end of a GIF-Quantum energy filter operated with a slit width of 20 eV. A dose rate of 20 electrons per pixel per second and an exposure time of 3.12 s were used, generating 40 movie frames with a total dose of ∼54 electrons/Å 2 . Statistics for cryo-EM data are listed in Table 1 . Table 1. Cryo-EM data collection, refinement and validation statistics Cas12f–sgRNA–target DNA Cas12f–sgRNA Data collection and processing Magnification 81 000 81 000 Voltage (kV) 300 300 Electron exposure (e – /Å 2 ) 54 54 Defocus range (-μm) 0.8–2.0 0.8–2.0 Pixel size (Å) 1.05 1.05 Symmetry imposed C1 C1 Initial particle images (no.) 3 284 618 1 846 279 Final particle images (no.) 384 132 154 090 Map resolution (Å) 3.1 3.9 FSC threshold 0.143 0.143 Map resolution range (Å) 2.8–4.0 3.7–4.9 Refinement Initial model used None PBD: 7L49 Model resolution (Å) 3.1 3.9 FSC threshold 0.5 0.5 Model resolution range (Å) 2.8–4.0 3.7–4.9 Map sharpening B factor (Å 2 ) –97 –117 Model composition Non-hydrogen atoms 12 330 10 889 Protein residues 1041 1041 Nucleotides 187 116 Ligands 4 (Zn) 4 (Zn) B factors (Å 2 ) Protein 39.67 169.73 Nucleotide 58.09 172.02 Ligands 73.48 163.37 R.m.s. deviations Bond lengths (Å) 0.005 0.004 Bond angles (°) 0.943 0.961 Validation MolProbity score 1.85 1.88 Clashscore 6.19 6.09 Poor rotamers (%) 0.00 0.22 Ramachandran plot Favored (%) 91.42 90.16 Allowed (%) 8.58 9.84 Disallowed (%) 0.00 0.00 Image processing The movie frames were imported to RELION-3 ( 28 ). Movie frames were aligned using MotionCor2 ( 29 ) with a binning factor of 2. Contrast transfer function (CTF) parameters were estimated using Gctf ( 30 ). A few thousand particles were auto-picked without template to generate 2D averages for subsequent template-based auto-picking. The auto-picked and extracted particle datasets were split into batches for 2D classifications, which were used to exclude false and bad particles that fell into 2D averages with poor features. Particles from different views were used to generate an initial model in cryoSPARC ( 31 ). 3D classification was further performed to distinguished different compositional/conformational heterogeneity. The homogeneous dataset was used for final 3D refinement with C1 symmetry. For the Cas12f–sgRNA binary complex dataset, 1 846 279 particles were auto-picked and extracted from 1391 dose weighted micrographs. 448 190 particles were selected from 2D classification and used for 3D classification. 154 190 particles were selected from 3D classification and used for final 3D refinement. For the Cas12f–sgRNA–dsDNA ternary complex dataset, 3 284 618 particles were auto-picked and extracted from 2450 dose weighted micrographs. 992 872 particles were selected from 2D classification and used for 3D classification. 384 132 particles were selected from 3D classification and used for final 3D refinement. Focused refinement around the Nuc domain was further performed to improve the local map quality. Cryo-EM image processing is summarized in Table 1 . Model building, refinement, and validation De novo model building of the Cas12f–sgRNA–target DNA structure was performed manually in COOT ( 32 ) guided by secondary structure predictions from PSIPRED ( 33 ). Refinement of the structure models against corresponding maps were performed using the phenix.real_space_refine tool in Phenix ( 34 ). For the Cas12f–sgRNA complex, the structure model of the Cas12f–sgRNA–target–DNA complex was fitted into the cryo-EM map, and each domain was manually adjusted in COOT. The resultant model was refined against the corresponding cryo-EM map using the phenix.real_space_refine tool in Phenix. 3D FSC analysis for the presented maps were performed using the Remote 3DFSC Processing Server ( https://3dfsc.salk.edu/upload/ ) ( 35 ).
Structural visualization
Figures were generated using PyMOL and UCSF Chimera ( 36 ).
Supplementary Material gkab179_Supplemental_Files Click here for additional data file.
📊 Figures
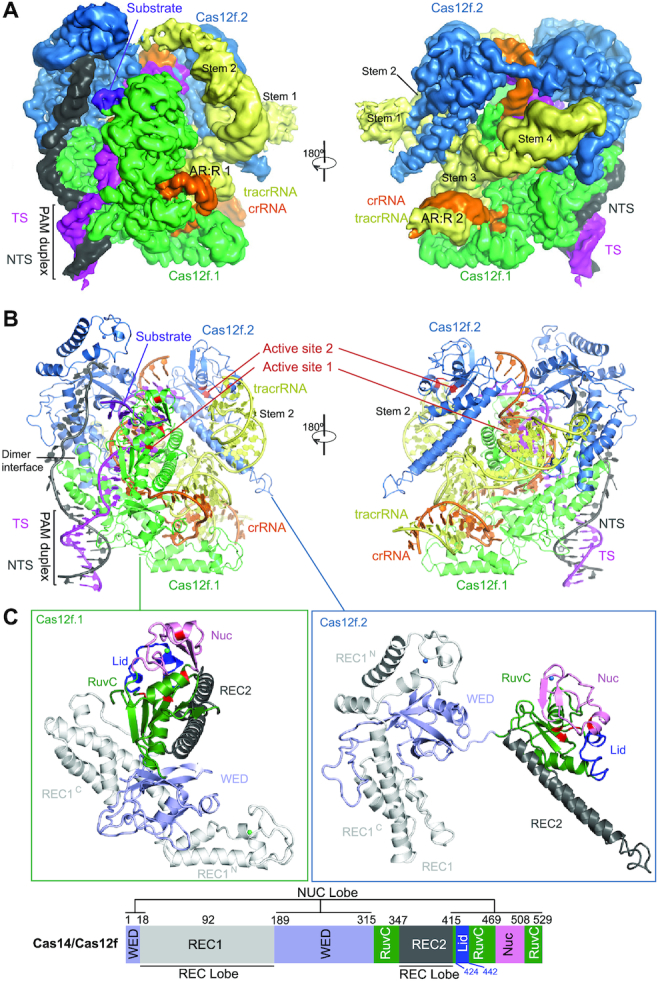
Figure 1.
Overall structure of the Cas12fu2013sgRNAu2013target DNA complex. ( A ) Cryo-EM map of the Cas12fu2013sgRNAu2013target DNA complex at 3.1 u00c5 in two views with each subunit color coded (Cas12f.1 in ...
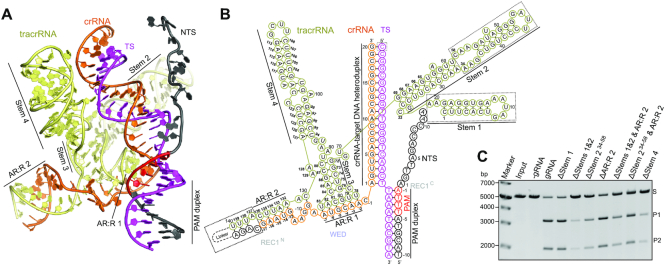
Figure 2.
Overall structure of sgRNA. ( A ) Structure of the sgRNA and target DNA in the Cas12fu2013sgRNAu2013target DNA complex in cartoon presentation. ( B ) Schematic of the sgRNA and target DNA. Structurall...
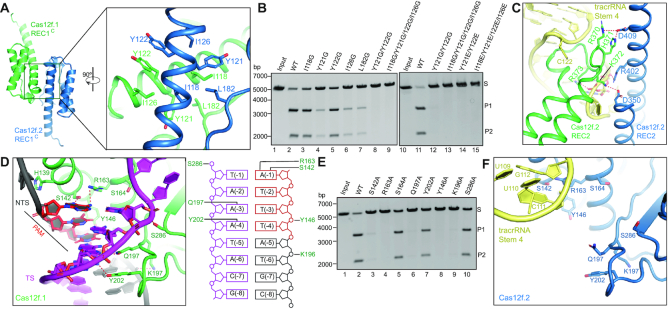
Figure 3.
Dimerization, PAM recognition, and active site of Cas12f. ( A ) Dimerization interface of Cas12f mediated by REC1 C . ( B ) Substrate DNA cleavage assay using wild-type Cas12f and Cas12f with mutation...
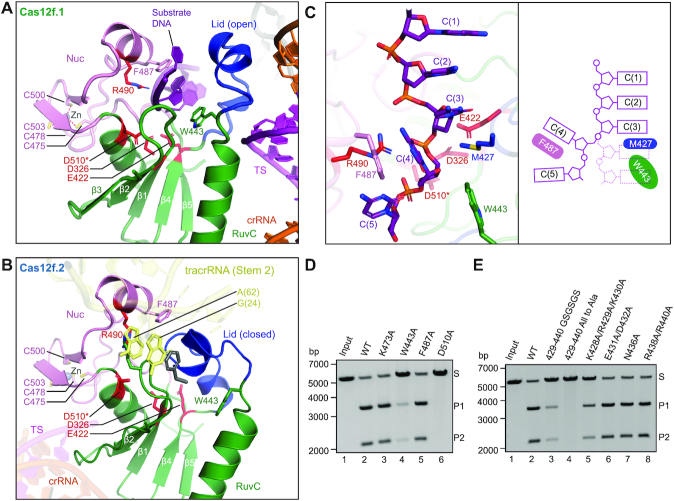
Figure 4.
Nuclease site of Cas12f. ( A ) The nuclease site of the RuvC domain of Cas12f.1 in an open conformation. The acidic residues (D326, E422u00a0and D510) from the RuvC domain and R490 from the Nuc domain...
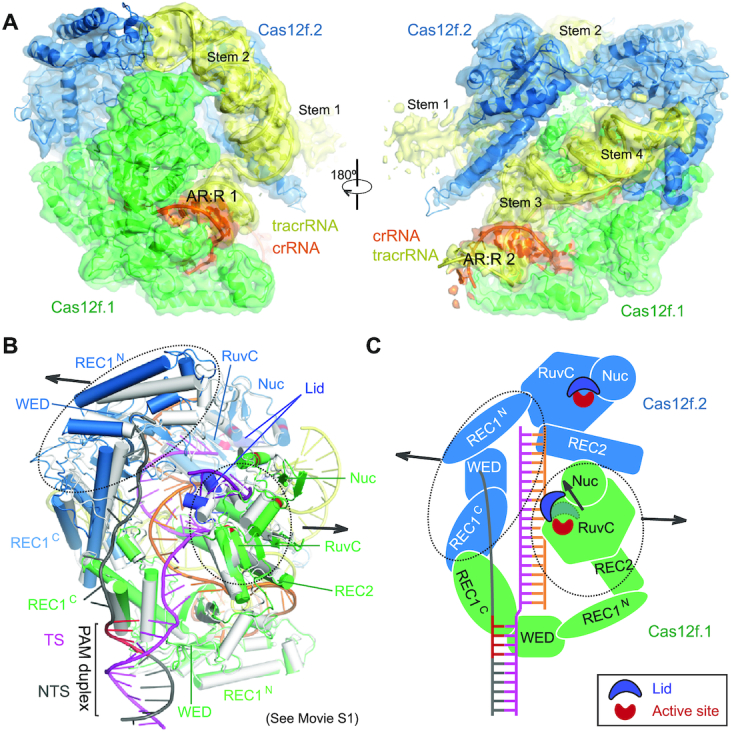
Figure 5.
Structure of the Cas12f-sgRNA complex. ( A ) Cryo-EM map of the Cas12f-sgRNA complex at 3.9 u00c5 in two views with each subunit color coded as in Figure 1A . The map is shown in transparent surface w...
Figure images are served from the NIH/NLM PubMed Central Open Access Subset or Europe PMC; copyright remains with the publishers and authors.
💬 Discussion
0 commentsNo comments yet. Be the first to start a discussion!
Leave a Comment