Abstract
DNA supercoiling has emerged as a major contributor to gene regulation in bacteria, but how DNA supercoiling impacts transcription dynamics in eukaryotes is unclear. Here, using single-molecule dual-color nascent transcription imaging in budding yeast, we show that transcriptional bursting of divergent and tandem GAL genes is coupled. Temporal coupling of neighboring genes requires rapid release of DNA supercoils by topoisomerases. When DNA supercoils accumulate, transcription of one gene inhibits transcription at its adjacent genes. Transcription inhibition of the GAL genes results from destabilized binding of the transcription factor Gal4. Moreover, wild-type yeast minimizes supercoiling-mediated inhibition by maintaining sufficient levels of topoisomerases. Overall, we discover fundamental differences in transcriptional control by DNA supercoiling between bacteria and yeast and show that rapid supercoiling release in eukaryotes ensures proper gene expression of neighboring genes.
🔬 Techniques
🧬 Organisms
💻 Software
✨ Fluorophores
🧪 Sample Preparation
🏭 Microscope Brands
🧪 Reagent Suppliers
📷 Detectors
🔎 Objectives
🎨 Filters
💻 Software Details
💾 Data Repositories
🏷️ Research Resource Identifiers (RRIDs)
Verified research resources used in this paper:
🏛️ Research Organizations (ROR)
Affiliated research institutions:
📋 Methods
Key resources table REAGENT or RESOURCE SOURCE IDENTIFIER Antibodies
IgG from rabbit serum Sigma-Aldrich Cat# I5006; RRID: AB_1163659 c-Myc polyclonal Thermo Fischer Scientific Cat# PA5-85185; RRID: AB_2792331 PGK1 monoclonal Thermo Fischer Scientific Cat# 459250;RRID: AB_2532235 IRDye® 800CW anti-mouse Li-cor Cat# 925-32210; RRID: AB_2687825 IRDye® 800CW anti-rabbit Li-cor Cat# 926-32211; RRID: AB_621843 Chemicals, peptides, and recombinant proteins Yeast Nitrogen Base w/o AA, Carbohydrate & w/ AS (YNB) (Powder) US Biological Cat# Y2025 Drop-out Mix Complete w/o Yeast Nitrogen Base (Powder) US Biological Cat# D9515 Bacto™ Agar Thermo Fischer Scientific Cat#214030 Bacto™ Peptone Thermo Fischer Scientific Cat# 211677 Bacto™ Yeast Extract, technical Thermo Fischer Scientific Cat# 288620 D-Glucose Sigma-Aldrich Cat# 8270-10KG D-Raffinose Bio-Connect Life Sciences Cat# OR06197_2kg D-Galactose Sigma-Aldrich Cat# G0750-500G 1× Tris-EDTA buffer pH 8.0 Invitrogen Cat# 12090015 D-Sorbitol Sigma-Aldrich Cat# S6021 Potassium phosphate monobasic (powder) Sigma-Aldrich Cat# P9791 Potassium phosphate dibasic (powder) Sigma-Aldrich Cat# P8281 B-Mercaptoethanol Sigma-Aldrich Cat# M6250 Lyticase from Arthrobacter luteus (powder) Sigma-Aldrich Cat# L2524 Ribonucleoside Vanadyl Complex (RVC; liquid) NEB Cat# S1402S Formamide (deionized) Sigma-Aldrich Cat# F9037 UltraPure™ SSC, 20X Thermo Fisher Scientific Cat# 15557044 Dextran sulfate sodium salt Sigma-Aldrich Cat# 67578 ProLong® Gold Antifade Mountant with DAPI Invitrogen Cat# P36935 Sodium chloride (NaCl) Sigma-Aldrich Cat# S9888 Glycerol Sigma-Aldrich Cat# G5516 Phosphate-buffered saline (PBS) Thermo Fisher Scientific Cat# 18912014 MyTaq Red Mix 2x Bioline Cat#: BIO-25044 DMSO Sigma Cat#: D4540 DNase I recombinant, RNase-free Sigma-Aldrich (Roche) Cat# 04716728001 cOmplete EDTA-free protease inhibitor cocktail tablets Sigma-Aldrich (Roche) Cat# 11873580001 Pefabloc SC-Protease-Inhibitor Carl Roth Cat# A154.3 Dynabeads M-280 Tosylactivated Thermo Fisher Scientific Cat# 14204 RNace-It Ribonuclease Cocktail Agilent Cat# 400720 Recombinant GST-TEV protease Challal et al. 79 N/A Guanidine hydrochloride Sigma-Aldrich Cat# G4505 Ni-NTA Agarose Qiagen Cat# 30230 Imidazole Sigma-Aldrich Cat# I0125 RNaseOUT Recombinant Ribonuclease Inhibitor Thermo Fisher Scientific Cat# 10777019 T4 RNA Ligase 2, truncated KQ NEB Cat# M0373L T4 Polynucleotide Kinase NEB Cat# M0201L T4 RNA Ligase 1 (ssRNA Ligase) NEB Cat# M0204L Proteinase K, recombinant, PCR grade Sigma-Aldrich (Roche) Cat# 03115887001 SuperScript IV Reverse Transcriptase Thermo Fisher Scientific Cat# 18090050 Exonuclease I NEB Cat# M0293S RNase H NEB Cat# M0297S LA Taq Takara Cat# RR002M Zymolase 100T US biological Cat# Z1004.250 Micrococcal nuclease Sigma-Aldrich Cat# N5386-200UN Sorbitol Sigma Aldrich Cat# 1077581000 Ammonium acetate solution Sigma Aldrich Cat# A2706 NP-40 Sigma Aldrich Cat# 92016 SDS Sigma Aldrich Cat# L3771 Spermidine Sigma Aldrich Cat# S0266 Phenol/chloroform (PCI 15:14:1) Sigma-Aldrich Cat# P2069-100ML RNaseA/T1 Thermo Fisher Scientific Cat# EN0551 Agarose MP Sigma Aldrich Cat# 11388991001 3-indole acetic acid (IAA, auxin) Sigma Aldrich Cat# I3750-100G-A NuPAGE™ SDS Running buffer 20x Thermo Fisher Scientific Cat# LA0041 NuPAGE™ 3-8%Tris-Acetate protein gels Thermo Fisher Scientific Cat#EA0375PK2 Nitrocellulose membrane Bio-rad Cat# 1620112 Auxinole Sigma Aldrich Cat# SML3231-25MG JFX650 dye Grimm et al. 80 N/A Critical commercial assays LightCycler FastStart DNA Master SYBR Green I Roche Cat# 12239364001 LightCycler 480 SYBR Green I Master Roche Cat# 04887352001 Qubit dsDNA HS Assay Kit Thermo Fisher Scientific (Invitrogen) Cat# Q32851 Vivacon 500 Sartorius Cat# VN01H22 QIAquick PCR Purification Kit Qiagen Cat# 28104 PCR Isolate II PCR and Gel Kit Bioline Cat# BIO-52060 Bioanalyzer High Sensitivity DNA kit Agilent Cat# 5067-4626 ISOLATE II Plasmid Mini Kit Bioline Cat# BIO-52057 KAPA HTP Library Preparation Kit KAPA Biosystems Cat# 07961901001 Deposited data MNase-seq data this study GEO: GSE196945 Pol II CRAC-seq this study GEO: GSE217963 Raw images and Western blots this study Mendeley Data: https://doi.org/10.17632/z2w34669gj.1 Experimental models: Organisms/strains Please refer to Table S1 this study N/A Oligonucleotides Please refer to Tables S3 , S4 , and S5 this study N/A Recombinant DNA Please refer to Table S2 this study N/A Software and algorithms ImageJ Schneider et al. 81 https://imagej.nih.gov/ij/index.html Python custom code https://doi.org/10.5281/zenodo.7820986 https://doi.org/10.5281/zenodo.7820895 https://doi.org/10.5281/zenodo.7820931 https://doi.org/10.5281/zenodo.7821005 Bowtie2 Langmead and Salzberg 82 http://bowtie-bio.sourceforge.net/bowtie2/index.shtml MATLAB (MatTrack v6) Mazza et al., 83 kind gift from David Ball https://doi.org/10.5281/zenodo.7821136 DESeq2 Love et al. 84 https://bioconductor.org/packages/release/bioc/html/DESeq2.html RStudio RStudio RRID: SCR_000432 Affinity Designer Serif https://affinity.serif.com/en-us/designer/ ; RRID: SCR_016952 Other "Megatron" W5 UV crosslinking unit UVO3 Ltd https://www.uvo3.co.uk/ Mixer Mill MM 400 Retsch Cat# 20.745.0001 Gelfree 8100 Fractionation Station Expedeon Cat# 48100 18 mm round cover slips coated with poly-L-lysine Neuvitro Cat# GG-18-1.5-pll 25mm round cover glasses (#1.5, thickness) VWR Cat# 631-0172 25mm round cover glasses HI D=0.17m Zeiss Cat# 000000-1787-996 Wash-N-Dry coverslip rack Sigma Aldrich Cat# Z688568-1EA 400 mL tall glass beakers Novodirect Cat# 15439093 Microscope slides, SuperFrost® VWR Cat# ISO8037/I Attofluor™ Cell Chamber, for microscopy Thermofisher Scientific Cat# A7816 Dumont Horlogemakers pincet Gebogen Nr. 7 (forceps, tweezers) Vos Medisch Cat# 1121 Cell density meter VWR Cat#634-0882 Parafilm® M (4 inches wide) Merck P7668 Zeiss Plan-Apochromat 40×/1.40NA Oil Zeiss Cat# 420762-9900-000 Zeiss 4-alpha Plan-Apochromat 100×/1.46NA Oil Zeiss Cat# 420792-9800-000 Zeiss alpha Plan-Apochromat 100x 1.57NA oil Zeiss Cat# 420792-9771-000 SPECTRA X light engine WL:360–680 nm Lumencor N/A ORCA Flash 4v3 digital sCMOS camera Hamamatsu Cat# C13440-20CU UNO Top stage incubator and objective heater Okolab N/A Excitation filters, emission flters and dichroic mirrors See method details N/A Resource availability Lead contact Further information and requests for resources and reagents should be directed to and will be fulfilled by the lead contact, Tineke L. Lenstra ( t.lenstra@nki.nl ).
Show full methods section
Key resources table REAGENT or RESOURCE SOURCE IDENTIFIER Antibodies
IgG from rabbit serum Sigma-Aldrich Cat# I5006; RRID: AB_1163659 c-Myc polyclonal Thermo Fischer Scientific Cat# PA5-85185; RRID: AB_2792331 PGK1 monoclonal Thermo Fischer Scientific Cat# 459250;RRID: AB_2532235 IRDye® 800CW anti-mouse Li-cor Cat# 925-32210; RRID: AB_2687825 IRDye® 800CW anti-rabbit Li-cor Cat# 926-32211; RRID: AB_621843 Chemicals, peptides, and recombinant proteins Yeast Nitrogen Base w/o AA, Carbohydrate & w/ AS (YNB) (Powder) US Biological Cat# Y2025 Drop-out Mix Complete w/o Yeast Nitrogen Base (Powder) US Biological Cat# D9515 Bacto™ Agar Thermo Fischer Scientific Cat#214030 Bacto™ Peptone Thermo Fischer Scientific Cat# 211677 Bacto™ Yeast Extract, technical Thermo Fischer Scientific Cat# 288620 D-Glucose Sigma-Aldrich Cat# 8270-10KG D-Raffinose Bio-Connect Life Sciences Cat# OR06197_2kg D-Galactose Sigma-Aldrich Cat# G0750-500G 1× Tris-EDTA buffer pH 8.0 Invitrogen Cat# 12090015 D-Sorbitol Sigma-Aldrich Cat# S6021 Potassium phosphate monobasic (powder) Sigma-Aldrich Cat# P9791 Potassium phosphate dibasic (powder) Sigma-Aldrich Cat# P8281 B-Mercaptoethanol Sigma-Aldrich Cat# M6250 Lyticase from Arthrobacter luteus (powder) Sigma-Aldrich Cat# L2524 Ribonucleoside Vanadyl Complex (RVC; liquid) NEB Cat# S1402S Formamide (deionized) Sigma-Aldrich Cat# F9037 UltraPure™ SSC, 20X Thermo Fisher Scientific Cat# 15557044 Dextran sulfate sodium salt Sigma-Aldrich Cat# 67578 ProLong® Gold Antifade Mountant with DAPI Invitrogen Cat# P36935 Sodium chloride (NaCl) Sigma-Aldrich Cat# S9888 Glycerol Sigma-Aldrich Cat# G5516 Phosphate-buffered saline (PBS) Thermo Fisher Scientific Cat# 18912014 MyTaq Red Mix 2x Bioline Cat#: BIO-25044 DMSO Sigma Cat#: D4540 DNase I recombinant, RNase-free Sigma-Aldrich (Roche) Cat# 04716728001 cOmplete EDTA-free protease inhibitor cocktail tablets Sigma-Aldrich (Roche) Cat# 11873580001 Pefabloc SC-Protease-Inhibitor Carl Roth Cat# A154.3 Dynabeads M-280 Tosylactivated Thermo Fisher Scientific Cat# 14204 RNace-It Ribonuclease Cocktail Agilent Cat# 400720 Recombinant GST-TEV protease Challal et al. 79 N/A Guanidine hydrochloride Sigma-Aldrich Cat# G4505 Ni-NTA Agarose Qiagen Cat# 30230 Imidazole Sigma-Aldrich Cat# I0125 RNaseOUT Recombinant Ribonuclease Inhibitor Thermo Fisher Scientific Cat# 10777019 T4 RNA Ligase 2, truncated KQ NEB Cat# M0373L T4 Polynucleotide Kinase NEB Cat# M0201L T4 RNA Ligase 1 (ssRNA Ligase) NEB Cat# M0204L Proteinase K, recombinant, PCR grade Sigma-Aldrich (Roche) Cat# 03115887001 SuperScript IV Reverse Transcriptase Thermo Fisher Scientific Cat# 18090050 Exonuclease I NEB Cat# M0293S RNase H NEB Cat# M0297S LA Taq Takara Cat# RR002M Zymolase 100T US biological Cat# Z1004.250 Micrococcal nuclease Sigma-Aldrich Cat# N5386-200UN Sorbitol Sigma Aldrich Cat# 1077581000 Ammonium acetate solution Sigma Aldrich Cat# A2706 NP-40 Sigma Aldrich Cat# 92016 SDS Sigma Aldrich Cat# L3771 Spermidine Sigma Aldrich Cat# S0266 Phenol/chloroform (PCI 15:14:1) Sigma-Aldrich Cat# P2069-100ML RNaseA/T1 Thermo Fisher Scientific Cat# EN0551 Agarose MP Sigma Aldrich Cat# 11388991001 3-indole acetic acid (IAA, auxin) Sigma Aldrich Cat# I3750-100G-A NuPAGE™ SDS Running buffer 20x Thermo Fisher Scientific Cat# LA0041 NuPAGE™ 3-8%Tris-Acetate protein gels Thermo Fisher Scientific Cat#EA0375PK2 Nitrocellulose membrane Bio-rad Cat# 1620112 Auxinole Sigma Aldrich Cat# SML3231-25MG JFX650 dye Grimm et al. 80 N/A Critical commercial assays LightCycler FastStart DNA Master SYBR Green I Roche Cat# 12239364001 LightCycler 480 SYBR Green I Master Roche Cat# 04887352001 Qubit dsDNA HS Assay Kit Thermo Fisher Scientific (Invitrogen) Cat# Q32851 Vivacon 500 Sartorius Cat# VN01H22 QIAquick PCR Purification Kit Qiagen Cat# 28104 PCR Isolate II PCR and Gel Kit Bioline Cat# BIO-52060 Bioanalyzer High Sensitivity DNA kit Agilent Cat# 5067-4626 ISOLATE II Plasmid Mini Kit Bioline Cat# BIO-52057 KAPA HTP Library Preparation Kit KAPA Biosystems Cat# 07961901001 Deposited data MNase-seq data this study GEO: GSE196945 Pol II CRAC-seq this study GEO: GSE217963 Raw images and Western blots this study Mendeley Data: https://doi.org/10.17632/z2w34669gj.1 Experimental models: Organisms/strains Please refer to Table S1 this study N/A Oligonucleotides Please refer to Tables S3 , S4 , and S5 this study N/A Recombinant DNA Please refer to Table S2 this study N/A Software and algorithms ImageJ Schneider et al. 81 https://imagej.nih.gov/ij/index.html Python custom code https://doi.org/10.5281/zenodo.7820986 https://doi.org/10.5281/zenodo.7820895 https://doi.org/10.5281/zenodo.7820931 https://doi.org/10.5281/zenodo.7821005 Bowtie2 Langmead and Salzberg 82 http://bowtie-bio.sourceforge.net/bowtie2/index.shtml MATLAB (MatTrack v6) Mazza et al., 83 kind gift from David Ball https://doi.org/10.5281/zenodo.7821136 DESeq2 Love et al. 84 https://bioconductor.org/packages/release/bioc/html/DESeq2.html RStudio RStudio RRID: SCR_000432 Affinity Designer Serif https://affinity.serif.com/en-us/designer/ ; RRID: SCR_016952 Other "Megatron" W5 UV crosslinking unit UVO3 Ltd https://www.uvo3.co.uk/ Mixer Mill MM 400 Retsch Cat# 20.745.0001 Gelfree 8100 Fractionation Station Expedeon Cat# 48100 18 mm round cover slips coated with poly-L-lysine Neuvitro Cat# GG-18-1.5-pll 25mm round cover glasses (#1.5, thickness) VWR Cat# 631-0172 25mm round cover glasses HI D=0.17m Zeiss Cat# 000000-1787-996 Wash-N-Dry coverslip rack Sigma Aldrich Cat# Z688568-1EA 400 mL tall glass beakers Novodirect Cat# 15439093 Microscope slides, SuperFrost® VWR Cat# ISO8037/I Attofluor™ Cell Chamber, for microscopy Thermofisher Scientific Cat# A7816 Dumont Horlogemakers pincet Gebogen Nr. 7 (forceps, tweezers) Vos Medisch Cat# 1121 Cell density meter VWR Cat#634-0882 Parafilm® M (4 inches wide) Merck P7668 Zeiss Plan-Apochromat 40×/1.40NA Oil Zeiss Cat# 420762-9900-000 Zeiss 4-alpha Plan-Apochromat 100×/1.46NA Oil Zeiss Cat# 420792-9800-000 Zeiss alpha Plan-Apochromat 100x 1.57NA oil Zeiss Cat# 420792-9771-000 SPECTRA X light engine WL:360–680 nm Lumencor N/A ORCA Flash 4v3 digital sCMOS camera Hamamatsu Cat# C13440-20CU UNO Top stage incubator and objective heater Okolab N/A Excitation filters, emission flters and dichroic mirrors See method details N/A Resource availability Lead contact Further information and requests for resources and reagents should be directed to and will be fulfilled by the lead contact, Tineke L. Lenstra ( t.lenstra@nki.nl ).
Materials availability
Plasmids and yeast strains generated in this study are available upon reasonable request from the lead contact with a completed Materials Transfer Agreement.
Experimental model and subject details
Yeast strains, plasmids, and oligos Haploid yeast cells ( Saccharomyces cerevisiae ) of BY4741 and BY4742 backgrounds were transformed and mated to obtain the BY4743 diploids listed in Table S1 . 12xMS2V6 loops were integrated at 5’ GAL1 with a PCR product containing loxP-kanMX-loxP and at 5’ GAL7 with loxP2272-kanMX-loxP2272, a loxP mutant to prevent recombination with WT loxP sequence. The kanMX was excised with inducible CRE recombinase. Plasmids containing the MS2 and PP7 coat proteins, fused to mScarlet and GFPEnvy, respectively (pTL174 and pTL333), were digested with PacI and integrated at the ura3 Δ 0 locus. Auxin-inducible degron tags at TOP1 and TOP2 were amplified from YTL738 or pTL398 and integrated at the endogenous loci. Plasmid containing OsTIR1 (pTL231) was digested with PacI and integrated at the his3 Δ 1 locus. Gal4UASscr, GAL7 truncation and spacer mutations were made using CRISPR/Cas9. 85 The spacer sequence included convergent ADH1t and CUT60t terminator sequences to prevent transcriptional interference. All integrations were checked with PCR and sequencing. Gyrase and Topo I were ectopically expressed from plasmids. smFISH experiments with gene-specific probes upon topoisomerase degradation and CRAC-seq experiments were performed in haploid cells with W303 background. Cells were grown at 30°C in synthetic media. Strains, plasmids and oligos used to construct the strains can be found in Tables S1 , S2 , and S3 , respectively. Method details Live-cell imaging of transcription dynamics Live-cell imaging of transcription dynamics was performed as previously described in Donovan et al. 60 and Brouwer et al. 86 with minor modifications. Cells were grown at 30°C for at least 14 h in synthetic complete media supplemented with 2% raffinose. The cells were imaged after 30 min galactose induction at 30°C at mid-log (optical density, OD 600 0.2–0.4) on a coverslip with an agarose pad consisting of synthetic complete media and 2% galactose. For indole-3-acetic acid (IAA; auxin) treatment, cells were treated with galactose for 30 min and with 500 μM for 15 min before imaging. For auxinole treatment, cells were grown for at least 14 h in 500 μM auxinole and induced with galactose for 30 min before imaging. Imaging was performed on a setup consisting of an inverted microscope (Zeiss AxioObserver), an alpha Plan-Apochromat 100x 1.46NA oil objective, an sCMOS camera (Hamamatsu ORCA Flash 4v3) with a dual bandpass dichroic (Chroma 59012bs), a 570 nm longpass beamsplitter (Chroma T565lpxr-UF1), and 515/30 and 600/52 emission filters (Semrock FF01-515/30-25 and Semrock FF01-600/52-25), an UNO Top stage incubator and objective heater (OKOlab) at 30°C, LED excitation at 470/24 nm and 550/15 nm (SpectraX, Lumencor) at 0.20% and 0.40% power with an ND2 filter, resulting in a 62 mW/cm 2 and 413 mW/cm 2 excitation intensity. Wide-field images of GFPEnvy and mScarlet signals were acquired sequentially to prevent spectral crosstalk. Images were recorded at 10s interval for 30 min, with 9 z -stacks (Δz 0.5 μm) and 200 ms exposure using the Micro-Manager software, version 1.4. 87 For each condition, at least 3 replicate datasets were acquired with a total at least 100 cells. Single-molecule FISH Yeast cultures were grown to mid-log (OD 600 0.5) in 25 mL synthetic complete media with 2% raffinose and 2% galactose and smFISH was performed as previously described with minor modifications. 39 , 60 For auxinole treatment, cells were grown in synthetic complete media with 500 μM auxinole and 2% galactose. For the auxin timepoints, 100mL cultures were grown to OD 600 0.4 before being divided into 4×25 mL cultures and treated with 500 μM auxin for specified amount of time before fixation. If timepoint is not specified, cells were treated with auxin for 60 min. Cells were harvested at the same time after auxin addition to ensure the same OD. Cells were fixed with 5% paraformaldehyde (Electron Microscopy Sciences, 15714-S) for 20 min, washed three times with buffer B (1.2 M sorbitol and 100 mM potassium phosphate buffer pH 7.5) and then spheroplasted with 300 units of lyticase (Sigma-Aldrich, L2524-25KU). Cells were then immobilized on poly-L-lysine-coated coverslips (Neuvitro) and permeabilized with 70% ethanol. Coverslips were hybridized for 4 h at 37°C with hybridization buffer containing 10% dextran sulfate, 10% formamide, 2×SSC, and 5 pmol of fluorescent probes. For FISH targeting the PP7 and MS2 repeats, four PP7 probes labeled with Quasar570 and 48 MS2 probes labeled with Quasar670 dyes were used. For FISH targeting GAL1 , GAL10 or GAL7 , 48 probes labeled with Quasar570 ( GAL1 and GAL7 ) or Quasar670 ( GAL10 ) were used ( Table S4 ). Coverslips were washed 2× for 30 min with 10% formamide, 2×SSC at 37°C, then 1× with 2×SSC, and 1× for 5 min with PBS at room temperature. Coverslips were mounted on microscope slides using ProLong Gold mounting media with DAPI (Thermo Fisher, P36934 ). Imaging was performed on two similar microscopes consisting of an inverted microscope (Zeiss AxioObserver), a Plan-Apochromat 40x 1.4NA oil DIC UV objective, a 1.60x optovar, and an sCMOS camera (Hamamatsu ORCA Flash 4v3). For Quasar570, a 562 nm longpass dichroic (Chroma T562lpxr), 595/50 nm emission filter (Chroma ET595/50m) and 550/15 nm LED excitation at full power (Spectra X, Lumencor) were used. For Quasar670, a 660 nm longpass dichroic (Semrock FF660-Di02-25x36 or Chroma T660lpxrxt), 697/60 nm emission filter (Chroma ET697/60m) and 640/30 nm LED excitation at full power (Spectra X, Lumencor) were used. For DAPI, either a 410nm/490nm/570nm/660nm dichroic (Chroma vcgr-spx-p01-PC), a 430/35 nm, 512/45 nm, 593/40 nm, 665 nm longpass emission filter (Chroma vcgr-spx-p01-EM) or a 425 nm longpass dichroic (Chroma T425lpxr) and a 460/50 nm emission filter (Chroma ET460/50m) and LED excitation at 395/25 nm at 25% power (Spectra X, Lumencor) were used. For each sample and each channel, we utilized the Micro-Manager software, version 1.4 to acquire at least 50 fields-of-view, each consisting of a 21 z -stack (Δ z 0.3 μm) at 25 ms exposure for DAPI and 250 ms exposure for Quasar570 and Quasar670. For the smFISH experiments with the untagged topoisomerase-deficient haploids, all imaging settings were the same except a 1.25× optovar was used and each field-of-view consisted of 13 z -stack (Δ z 0.5 μm).
Western blot
Yeast cultures were grown to mid-log (OD 600nm 0.4) in 25 mL synthetic complete media with 2% raffinose and 2% galactose. For auxinole treatment, cells were grown in synthetic complete media with 500 μM auxinole and 2% galactose. The cells were treated with 500 μM auxin for 15, 30, or 60 min. Cells were harvested at the same time to ensure the same OD. Cells were washed with PBS twice and then incubated in 200 mM NaOH for 10 min. The cells were pelleted and resuspended in 2× SDS-PAGE solvent (4% SDS, 20% glycerol, 0.1 M DTT, 0.125 M Tris-HCl pH 7.5 and Roche EDTA-free protease inhibitor cocktail) and boiled at 95°C for 5min. The lysates were centrifuged, the supernatant was collected and snap-frozen in liquid nitrogen and stored at −80°C. To determine the loading volume, samples were first checked with a dot blot. The same WT control strain was used to ensure similar loading between experiments. For the western blot, samples were run on a 3-8% Tris-acetate gel (Thermo Fisher Scientific, EA0375PK2) at 100V for 2 hours and wet transferred (Bio-Rad, 1703930) on a nitrocellulose membrane at 300 mA for 4 hours. The membrane was washed with PBS for 5 min, blocked with 5% milk, dissolved in PBS, for 1 h at 18-22°C and incubated in 2% milk dissolved in TBS-T containing 1:1000 dilution of anti-cMyc (Thermo Fisher Scientific, #MA1-980) or anti-PGK (Thermo Fisher Scientific, #PA5-28612) primary antibodies, at 4°C for 14 hours. The membrane was washed with PBS for 5 min three times and incubated with 2% milk dissolved in TBS-T containing fluorescent anti-mouse (LI-COR, 926-32210) or anti-rabbit (LI-COR, 926-32211) secondary antibodies for 1 h at 18-22°C in the dark. MNase-seq Preparation and analysis of mono-nucleosomal DNA was performed as described previously 60 , 88 with minor modifications and with two biological replicates. Haploid cells were grown in synthetic complete media with 2% raffinose or 2% galactose from OD 600 0.3 to OD 600 1.0, fixed in 1% paraformaldehyde, washed with 1 M sorbitol, treated with spheroplasting buffer (1M sorbitol, 1 mM β-mercaptoethanol, 10 mg/mL zymolyase 100T (US biological, Z1004.250)) and washed twice with 1 M sorbitol. Spheroplasted cells were treated with 0.01171875 or 0.1875 U micrococcal nuclease (Sigma-Aldrich, N5386-200UN) in digestion buffer (1 M sorbitol, 50 mM NaCl, 10 mM Tris pH 7.4, 5 mM MgCl 2 , 0.075% NP-40, 1 mM β-mercaptoethanol, 0.5 mM spermidine) at 37°C. After 45 min, reactions were terminated on ice with 25 mM EDTA and 0.5% SDS. Samples were treated with proteinase K for 1 h at 37°C and decrosslinked overnight at 65°C. Digested DNA was extracted with phenol/chloroform (PCI 15:14:1), precipitated with NH 4 -Ac, and treated with 0.1 mg/mL RNaseA/T1. The extent of digestion was checked on a 3% agarose gel. Sequencing libraries were prepared using the KAPA HTP Library Preparation Kit (07961901001, KAPA Biosystems) using 1 mg of input DNA, 5 mL of 10 mM adapter, double-sided size selection before and after amplification using 10 cycles. Adapters were created by ligation of the Universal adapter to individual sequencing adapters ( Table S5 ). Libraries were checked on Bioanalyzer High Sensitivity DNA kit (Agilent) and sequencing was performed on a NextSeq550.
Single-molecule tracking of Gal4
Cells were grown at 30°C for at least 14 h in synthetic complete media, supplemented with 2% raffinose and 2% galactose. At mid-log (optical density, OD 600 0.2–0.4), cells were treated with 5 pM (H3-HaloTag cells) or 500 pM (Gal4-HaloTag cells) of JFX650 dye 80 and incubated at 30°C for 15 minutes. The cells were washed with warm media and immobilized on a coverslip with an agarose pad consisting of synthetic complete media with 2% raffinose and 2% galactose. The cells were imaged on ELYRA.P1 (Zeiss) equipped with an incubator (Pecon) and Scanning Stage Piezo 130x100 (Zeiss). We used an alpha Plan-Apochromat 100x 1.57NA oil objective (Zeiss) and a filter set (Zeiss LBF 405/488/642). The cells were excited simultaneously with Highly Inclined Laminated Optical (HILO) sheet illumination mode with 488 nm and 640 nm using 1.6 W/cm 2 and 2 mW/cm 2 excitation intensities, respectively. Images were captured with 30 ms exposure at 200 ms interval for 1,000 time points. The emission was split in two channels (TV1 and TV2) using a duolink splitter (Zeiss) holding a filter set with a BS642 dichroic beamsplitter (Zeiss) and BP495–550 and LP655 emission filters (Semrock) onto two EM-CCD iXon DU 897 cameras (Andor). CRAC-seq For Pol II CRAC experiments, 2 L per condition of cells with endogenously HTP-tagged RBP1 and AID-tagged TOP1, TOP2 genes were grown to exponential phase in synthetic media lacking tryptophane at 30°C and harvested at OD600 = 0.6. Depletion of Top1-AID and Top2-AID was induced by treatment with 5 mM auxin for 1 hour before harvesting. Processing of the CRAC-seq data was performed as previously described in Candelli et al. 89 and Challal et al. 79 Quantification and statistical analysis Statistical details for individual experiments have been provided in the figure legends.
Analysis of live-cell transcription dynamics
For image analysis of transcription dynamics, the intensity calculation and tracking of the transcription sites was calculated as previously described in Donovan et al. 60 using a custom Python script ( https://doi.org/10.5281/zenodo.7820895 with dependencies from https://doi.org/10.5281/zenodo.7820931 ). The images were maximum intensity projected and then corrected for xy -drift in the stage using an affine transformation. Cells were segmented using Otsu thresholding and watershedding. The intensity of the TS was calculated for each color by fitting a 2D Gaussian mask after local background subtraction as described previously. 90 To detect the TSs, initial intensity thresholds of 9 and 7 standard deviations (SD) from the mean background was used for PP7 and MS2 signals, respectively. For frames where no TS was detected, a second fit was made in the vicinity of the initial detected spots using lower intensity thresholds of 6 and 4 SD from the mean background for PP7 and MS2 , respectively. If no TSs were detected in a frame after the second fit, the intensity was measured at the xy -coordinates of the previous frame. The tracking within each cell was inspected visually, and the endpoint of each trace was manually set at the last frame where a TS was visible. Dividing cells and cells in which TSs were not reliably detected were excluded from the analysis. Only the cells that exhibited both PP7 and MS2 signals were considered for analysis. Cells with only signal in one channel were inspected but exhibited insufficient coat protein levels in the other channel for reliable analysis. For each cell, the background was estimated by fitting a Lorentzian distribution to intensities measured at four points at a fixed distance from the TS in each frame in the same cell. The mean background was subtracted from the intensity trace to obtain background-subtracted intensity traces. Active fraction was computed by accounting for cells that exhibited both PP7 and MS2 signals for at least 600 seconds. Cells where we did not detect transcription sites above background were classified as inactive. To determine the on and off periods, the fluorescence signal was binarized by setting a threshold that was a specific standard deviation above the MS2 and PP7 background intensities. To determine a binarization threshold that captured the correct bursting kinetics, the sum of squared residuals between the ACFs of the binary signals (range 1.0-5.0, steps of 0.25) and the ACF of the analog fluorescence signal between 10s and 100s was calculated. The minimal residual was found at threshold values of 2.75 and 4.50 standard deviations above background, with residuals of 0.0025 and 0.0010 for MS2 and PP7 , respectively. The burst intensity was measured for frames where the binarized signal was on. The burst duration and burst frequency (defined as inverse of time between bursts) were calculated from the binarized data, and bursts with a duration of a single frame were considered as errors from the binarization and were excluded. Reported error bars and significance was calculated from bootstrapping with 1000 repetitions. ACF, CCF, and transcriptional overlap For each time trace, autocorrelation (ACF) and crosscorrelation functions (CCF) were computed as (Equation 1) G a b ( τ ) = ⟨ δ a ( t ) δ b ( t + τ ) ⟩ ⟨ a ( t ) ⟩ ⟨ b ( t ) ⟩ − 1 where denotes the time average, δa (t) = a(t) - ⟨ a(t) ⟩ and a(t) and b(t) can be combinations of the MS2 and PP7 time traces. 60 , 90 Correlation functions were computed using fast Fourier transforms and upon shifting the two signals, non-overlapping ends were trimmed. The functions were normalized for each trace individually. To correct for non-stationary effects (i.e. photobleaching, cell cycle, etc.), the global mean signal was used to calculate corrections, which were then subtracted. For single-trace correlation functions, each point was given a weight corresponding to the number of overlapping time intervals (τ) from the signals used in its computation. Correlation functions from single time traces were averaged together to reach statistical convergence. Bootstrapping was performed with 10,000 repetitions to obtain standard error of the mean correlation functions (SEM). We used the ACFs and CCFs to calculate the normalized transcriptional overlap (called fractional overlap by Rodriguez et al.), 38 which provides an estimate of the fraction of bursts of one gene, which co-occur with the bursts of another gene. We normalized the cross-correlation functions of the GAL1-GAL10 and GAL10-GAL7 genes by their respective ACFs: (Equation 2) G a b / a ( τ ) = G a b ( τ ) + 1 G a ( 0 ) + 1 where G ab ( τ ) represents the CCFs of GAL1-GAL10 or GAL10-GAL7 . G a (0) represents the ACF amplitude at τ = 0 of GAL10 in GAL1-GAL10 or GAL10-GAL7 pair. Each trace was normalized before the traces were averaged together. To estimate the amplitude of the CCF at τ = 0, we fit the CCF with a Gaussian. The measured ACF amplitude at τ = 0 is overestimated due to shot noise, so to estimate the representative amplitudes G a (0) and G b (0), we fit a line through the first 4 to 10 (omitting τ = 0) values of G a and G b . The fit with the best coefficient of determination was used to extrapolate the values of G a (0). Rodriguez et al. presented the transcriptional overlap calculation for a model with assumptions that the transcriptional events are square pulses of equal duration and height and are uniformly distributed over time. To confirm that this calculation can be applied for bursts with trapezoidal transcription events that are exponentially distributed, we simulated a 4-state model (ON-ON, ON-OFF, OFF-ON, OFF-OFF) for a gene pair where the promoter states are correlated, similar to GAL1-GAL10 . We find that at lower transcription rates, the calculated normalized transcriptional overlap deviates from the theoretical values. However, for highly correlated gene pairs, as observed in the real data, the calculated transcriptional overlap from Equation 2 matches the theoretical transcriptional overlap between the two genes. smFISH analysis For smFISH image analysis, a custom-written Python script was used to detect, localize, and classify the spots ( https://doi.org/10.5281/zenodo.7820986 with dependencies from https://doi.org/10.5281/zenodo.7820931 ). Cells and nuclei were segmented using Otsu thresholding and watershedding. Spots were localized by fitting a 3D Gaussian mask after local background subtraction. 90 Cells in which no spots were detected were excluded from further analysis since a visual inspection indicated that these cells were not properly segmented or were improperly permeabilized. For each cell, the TS was defined as the brightest nuclear spot and the number of RNAs at each TS was determined by normalizing the intensity of each TS with the median fluorescent intensity of the cytoplasmic RNAs detected in all cells. Cells were further subclassified based on their cell cycle stage using the integrated DAPI intensity of each cell calculated from the maximum intensity projection images. 91 A distribution of nuclear DAPI intensities was fit with a bimodal Gaussian model. The TS intensity was only analyzed in G1 cells, with nuclear intensities [1 SD, 0.75× SD] around the mean of the first peak. Cells with fewer than 5 RNAs at the TS were classified as inactive, and cells with 5 or more RNAs at the TS were classified as active cells. Subsequently, the fraction of active cells for each gene and the Pearson correlation coefficients of the active cells were determined for various conditions. For smFISH experiments with GAL10 , GAL1 , and GAL7 probes, spots were fit using 2D fitting, and the threshold to classify as an active cell was set to 2.5.
Western blot quantification
The fluorescence signal of Western blots was quantified using ImageJ. 81 A region of interest (ROI) was outlined around the largest sample and the same ROI was used for all samples on the membrane. The background was calculated by averaging the intensities of eight ROIs on the membrane where there was no signal present. The integrated intensities of the samples were background-subtracted and normalized to a no-OsTIR1 control strain to determine degradation upon OsTIR1 addition and auxin addition.
Quantification of eGFP-Topo I fluorescence
To quantify the Topo I-eGFP fluorescence, cells were segmented using Otsu thresholding and watershedding. The fluorescence of each pixel within the cell was integrated and subtracted by the mean background of the image. The background was defined as the pixels unoccupied by the cell masks. The background-subtracted intensities were normalized by the area of the cell.
MNase-seq analysis
MNase-seq was analyzed with a custom python script ( https://doi.org/10.5281/zenodo.7821005 ). Paired-end 2×75-bp reads were aligned to the reference genome SacCer3 using Bowtie 2. 82 Nucleosome dyads were found by taking the middle of each paired read of insert size between 95 and 225 bp and were smoothed with a 31-bp window. 88 The minimal read-length of 95 bp ensured inclusion of subnucleosomal particles (fragile nucleosomes) rather than regulatory factors, which is especially important when using low MNase digestion conditions. To determine the position of the +1 nucleosome for each gene, the coverage was determined in a 4000 bp window around the annotated TSS. For each gene, the coverage was summed and smoothed using a Gaussian filter with 40 bp window. The peaks were determined using a peak calling function. The +1 nucleosome was defined as the first peak after the minimum of the smoothed coverage. To compute the metagene plot, genes were aligned at the +1 nucleosome based on classifications in the unperturbed condition and the coverages were summed and normalized by the number of genes.
Analysis of Gal4 single-molecule tracking
Single-molecule tracking movies were analyzed using a custom MATLAB software based on MatTrack (version 6, https://doi.org/10.5281/zenodo.7821136 ). 60 , 83 Dividing cells were excluded from the analysis. To determine the region of interest for the analysis, the nucleus was labeled with PP7 coat protein, fused to GFPEnvy to aid segmentation. The Gal4-HaloTag labeling density is such that 1-2 molecule were labeled in each nucleus, making it unlikely to have multiple labeled molecules in one position. Only molecules that were tracked in more than 4 frames were considered to be bound. To determine whether a molecule was bound or diffusing, a threshold was used based on tracking of histone H3.
Tracking of histone
H3 showed that 99% of single molecules had a frame-to-frame displacement of < 0.35 μm at 200 ms interval. These maximum displacements were used to determine whether Gal4 particles are chromatin bound or diffusing. The cumulative distribution of dwell times of bound Gal4 molecules (survival probability plot) was corrected for bleaching based on the photobleaching kinetics of the bound histone population. 92 Briefly, the histone (H3-HaloTag) SMT data, acquired using the same conditions as Gal4-HaloTag SMT data, is fitted to a family of exponentials and the exponential distribution of the longer component is used to normalize the Gal4-HaloTag survival. The residence time distributions were computed from the photobleaching-corrected survival distributions and the average was calculated for bound tracks that were greater than 5 s in duration.
CRAC-seq analysis
Computational analyses of the CRAC-seq experiments were performed with ad hoc scripts in the R Studio environment. Differential gene expression analyses were carried out using the DESeq2 package. 84 The wildtype condition presented in Figure S7 was previously published in Aiello et al. 53
Materials availability
Plasmids and yeast strains generated in this study are available upon reasonable request from the lead contact with a completed Materials Transfer Agreement.
Experimental model and subject details
Yeast strains, plasmids, and oligos Haploid yeast cells ( Saccharomyces cerevisiae ) of BY4741 and BY4742 backgrounds were transformed and mated to obtain the BY4743 diploids listed in Table S1 . 12xMS2V6 loops were integrated at 5’ GAL1 with a PCR product containing loxP-kanMX-loxP and at 5’ GAL7 with loxP2272-kanMX-loxP2272, a loxP mutant to prevent recombination with WT loxP sequence. The kanMX was excised with inducible CRE recombinase. Plasmids containing the MS2 and PP7 coat proteins, fused to mScarlet and GFPEnvy, respectively (pTL174 and pTL333), were digested with PacI and integrated at the ura3 Δ 0 locus. Auxin-inducible degron tags at TOP1 and TOP2 were amplified from YTL738 or pTL398 and integrated at the endogenous loci. Plasmid containing OsTIR1 (pTL231) was digested with PacI and integrated at the his3 Δ 1 locus. Gal4UASscr, GAL7 truncation and spacer mutations were made using CRISPR/Cas9. 85 The spacer sequence included convergent ADH1t and CUT60t terminator sequences to prevent transcriptional interference. All integrations were checked with PCR and sequencing. Gyrase and Topo I were ectopically expressed from plasmids. smFISH experiments with gene-specific probes upon topoisomerase degradation and CRAC-seq experiments were performed in haploid cells with W303 background. Cells were grown at 30°C in synthetic media. Strains, plasmids and oligos used to construct the strains can be found in Tables S1 , S2 , and S3 , respectively.
Method details Live-cell imaging of transcription dynamics Live-cell imaging of transcription dynamics was performed as previously described in Donovan et al. 60 and Brouwer et al. 86 with minor modifications. Cells were grown at 30°C for at least 14 h in synthetic complete media supplemented with 2% raffinose. The cells were imaged after 30 min galactose induction at 30°C at mid-log (optical density, OD 600 0.2–0.4) on a coverslip with an agarose pad consisting of synthetic complete media and 2% galactose. For indole-3-acetic acid (IAA; auxin) treatment, cells were treated with galactose for 30 min and with 500 μM for 15 min before imaging. For auxinole treatment, cells were grown for at least 14 h in 500 μM auxinole and induced with galactose for 30 min before imaging. Imaging was performed on a setup consisting of an inverted microscope (Zeiss AxioObserver), an alpha Plan-Apochromat 100x 1.46NA oil objective, an sCMOS camera (Hamamatsu ORCA Flash 4v3) with a dual bandpass dichroic (Chroma 59012bs), a 570 nm longpass beamsplitter (Chroma T565lpxr-UF1), and 515/30 and 600/52 emission filters (Semrock FF01-515/30-25 and Semrock FF01-600/52-25), an UNO Top stage incubator and objective heater (OKOlab) at 30°C, LED excitation at 470/24 nm and 550/15 nm (SpectraX, Lumencor) at 0.20% and 0.40% power with an ND2 filter, resulting in a 62 mW/cm 2 and 413 mW/cm 2 excitation intensity. Wide-field images of GFPEnvy and mScarlet signals were acquired sequentially to prevent spectral crosstalk. Images were recorded at 10s interval for 30 min, with 9 z -stacks (Δz 0.5 μm) and 200 ms exposure using the Micro-Manager software, version 1.4. 87 For each condition, at least 3 replicate datasets were acquired with a total at least 100 cells. Single-molecule FISH Yeast cultures were grown to mid-log (OD 600 0.5) in 25 mL synthetic complete media with 2% raffinose and 2% galactose and smFISH was performed as previously described with minor modifications. 39 , 60 For auxinole treatment, cells were grown in synthetic complete media with 500 μM auxinole and 2% galactose. For the auxin timepoints, 100mL cultures were grown to OD 600 0.4 before being divided into 4×25 mL cultures and treated with 500 μM auxin for specified amount of time before fixation. If timepoint is not specified, cells were treated with auxin for 60 min. Cells were harvested at the same time after auxin addition to ensure the same OD. Cells were fixed with 5% paraformaldehyde (Electron Microscopy Sciences, 15714-S) for 20 min, washed three times with buffer B (1.2 M sorbitol and 100 mM potassium phosphate buffer pH 7.5) and then spheroplasted with 300 units of lyticase (Sigma-Aldrich, L2524-25KU). Cells were then immobilized on poly-L-lysine-coated coverslips (Neuvitro) and permeabilized with 70% ethanol. Coverslips were hybridized for 4 h at 37°C with hybridization buffer containing 10% dextran sulfate, 10% formamide, 2×SSC, and 5 pmol of fluorescent probes. For FISH targeting the PP7 and MS2 repeats, four PP7 probes labeled with Quasar570 and 48 MS2 probes labeled with Quasar670 dyes were used. For FISH targeting GAL1 , GAL10 or GAL7 , 48 probes labeled with Quasar570 ( GAL1 and GAL7 ) or Quasar670 ( GAL10 ) were used ( Table S4 ). Coverslips were washed 2× for 30 min with 10% formamide, 2×SSC at 37°C, then 1× with 2×SSC, and 1× for 5 min with PBS at room temperature. Coverslips were mounted on microscope slides using ProLong Gold mounting media with DAPI (Thermo Fisher, P36934 ). Imaging was performed on two similar microscopes consisting of an inverted microscope (Zeiss AxioObserver), a Plan-Apochromat 40x 1.4NA oil DIC UV objective, a 1.60x optovar, and an sCMOS camera (Hamamatsu ORCA Flash 4v3). For Quasar570, a 562 nm longpass dichroic (Chroma T562lpxr), 595/50 nm emission filter (Chroma ET595/50m) and 550/15 nm LED excitation at full power (Spectra X, Lumencor) were used. For Quasar670, a 660 nm longpass dichroic (Semrock FF660-Di02-25x36 or Chroma T660lpxrxt), 697/60 nm emission filter (Chroma ET697/60m) and 640/30 nm LED excitation at full power (Spectra X, Lumencor) were used. For DAPI, either a 410nm/490nm/570nm/660nm dichroic (Chroma vcgr-spx-p01-PC), a 430/35 nm, 512/45 nm, 593/40 nm, 665 nm longpass emission filter (Chroma vcgr-spx-p01-EM) or a 425 nm longpass dichroic (Chroma T425lpxr) and a 460/50 nm emission filter (Chroma ET460/50m) and LED excitation at 395/25 nm at 25% power (Spectra X, Lumencor) were used. For each sample and each channel, we utilized the Micro-Manager software, version 1.4 to acquire at least 50 fields-of-view, each consisting of a 21 z -stack (Δ z 0.3 μm) at 25 ms exposure for DAPI and 250 ms exposure for Quasar570 and Quasar670. For the smFISH experiments with the untagged topoisomerase-deficient haploids, all imaging settings were the same except a 1.25× optovar was used and each field-of-view consisted of 13 z -stack (Δ z 0.5 μm).
Western blot
Yeast cultures were grown to mid-log (OD 600nm 0.4) in 25 mL synthetic complete media with 2% raffinose and 2% galactose. For auxinole treatment, cells were grown in synthetic complete media with 500 μM auxinole and 2% galactose. The cells were treated with 500 μM auxin for 15, 30, or 60 min. Cells were harvested at the same time to ensure the same OD. Cells were washed with PBS twice and then incubated in 200 mM NaOH for 10 min. The cells were pelleted and resuspended in 2× SDS-PAGE solvent (4% SDS, 20% glycerol, 0.1 M DTT, 0.125 M Tris-HCl pH 7.5 and Roche EDTA-free protease inhibitor cocktail) and boiled at 95°C for 5min. The lysates were centrifuged, the supernatant was collected and snap-frozen in liquid nitrogen and stored at −80°C. To determine the loading volume, samples were first checked with a dot blot. The same WT control strain was used to ensure similar loading between experiments. For the western blot, samples were run on a 3-8% Tris-acetate gel (Thermo Fisher Scientific, EA0375PK2) at 100V for 2 hours and wet transferred (Bio-Rad, 1703930) on a nitrocellulose membrane at 300 mA for 4 hours. The membrane was washed with PBS for 5 min, blocked with 5% milk, dissolved in PBS, for 1 h at 18-22°C and incubated in 2% milk dissolved in TBS-T containing 1:1000 dilution of anti-cMyc (Thermo Fisher Scientific, #MA1-980) or anti-PGK (Thermo Fisher Scientific, #PA5-28612) primary antibodies, at 4°C for 14 hours. The membrane was washed with PBS for 5 min three times and incubated with 2% milk dissolved in TBS-T containing fluorescent anti-mouse (LI-COR, 926-32210) or anti-rabbit (LI-COR, 926-32211) secondary antibodies for 1 h at 18-22°C in the dark. MNase-seq Preparation and analysis of mono-nucleosomal DNA was performed as described previously 60 , 88 with minor modifications and with two biological replicates. Haploid cells were grown in synthetic complete media with 2% raffinose or 2% galactose from OD 600 0.3 to OD 600 1.0, fixed in 1% paraformaldehyde, washed with 1 M sorbitol, treated with spheroplasting buffer (1M sorbitol, 1 mM β-mercaptoethanol, 10 mg/mL zymolyase 100T (US biological, Z1004.250)) and washed twice with 1 M sorbitol. Spheroplasted cells were treated with 0.01171875 or 0.1875 U micrococcal nuclease (Sigma-Aldrich, N5386-200UN) in digestion buffer (1 M sorbitol, 50 mM NaCl, 10 mM Tris pH 7.4, 5 mM MgCl 2 , 0.075% NP-40, 1 mM β-mercaptoethanol, 0.5 mM spermidine) at 37°C. After 45 min, reactions were terminated on ice with 25 mM EDTA and 0.5% SDS. Samples were treated with proteinase K for 1 h at 37°C and decrosslinked overnight at 65°C. Digested DNA was extracted with phenol/chloroform (PCI 15:14:1), precipitated with NH 4 -Ac, and treated with 0.1 mg/mL RNaseA/T1. The extent of digestion was checked on a 3% agarose gel. Sequencing libraries were prepared using the KAPA HTP Library Preparation Kit (07961901001, KAPA Biosystems) using 1 mg of input DNA, 5 mL of 10 mM adapter, double-sided size selection before and after amplification using 10 cycles. Adapters were created by ligation of the Universal adapter to individual sequencing adapters ( Table S5 ). Libraries were checked on Bioanalyzer High Sensitivity DNA kit (Agilent) and sequencing was performed on a NextSeq550.
Single-molecule tracking of Gal4
Cells were grown at 30°C for at least 14 h in synthetic complete media, supplemented with 2% raffinose and 2% galactose. At mid-log (optical density, OD 600 0.2–0.4), cells were treated with 5 pM (H3-HaloTag cells) or 500 pM (Gal4-HaloTag cells) of JFX650 dye 80 and incubated at 30°C for 15 minutes. The cells were washed with warm media and immobilized on a coverslip with an agarose pad consisting of synthetic complete media with 2% raffinose and 2% galactose. The cells were imaged on ELYRA.P1 (Zeiss) equipped with an incubator (Pecon) and Scanning Stage Piezo 130x100 (Zeiss). We used an alpha Plan-Apochromat 100x 1.57NA oil objective (Zeiss) and a filter set (Zeiss LBF 405/488/642). The cells were excited simultaneously with Highly Inclined Laminated Optical (HILO) sheet illumination mode with 488 nm and 640 nm using 1.6 W/cm 2 and 2 mW/cm 2 excitation intensities, respectively. Images were captured with 30 ms exposure at 200 ms interval for 1,000 time points. The emission was split in two channels (TV1 and TV2) using a duolink splitter (Zeiss) holding a filter set with a BS642 dichroic beamsplitter (Zeiss) and BP495–550 and LP655 emission filters (Semrock) onto two EM-CCD iXon DU 897 cameras (Andor). CRAC-seq For Pol II CRAC experiments, 2 L per condition of cells with endogenously HTP-tagged RBP1 and AID-tagged TOP1, TOP2 genes were grown to exponential phase in synthetic media lacking tryptophane at 30°C and harvested at OD600 = 0.6. Depletion of Top1-AID and Top2-AID was induced by treatment with 5 mM auxin for 1 hour before harvesting. Processing of the CRAC-seq data was performed as previously described in Candelli et al. 89 and Challal et al. 79
Supplemental information Document S1. Figures S1–S7, Tables S2, S3, and S5, and supplemental references Table S1. Yeast strains used in this study, related to STAR Methods Table S4. smFISH probes used in this study, related to STAR Methods Document S2. Article plus supplemental information
📊 Figures
Figureu00a01
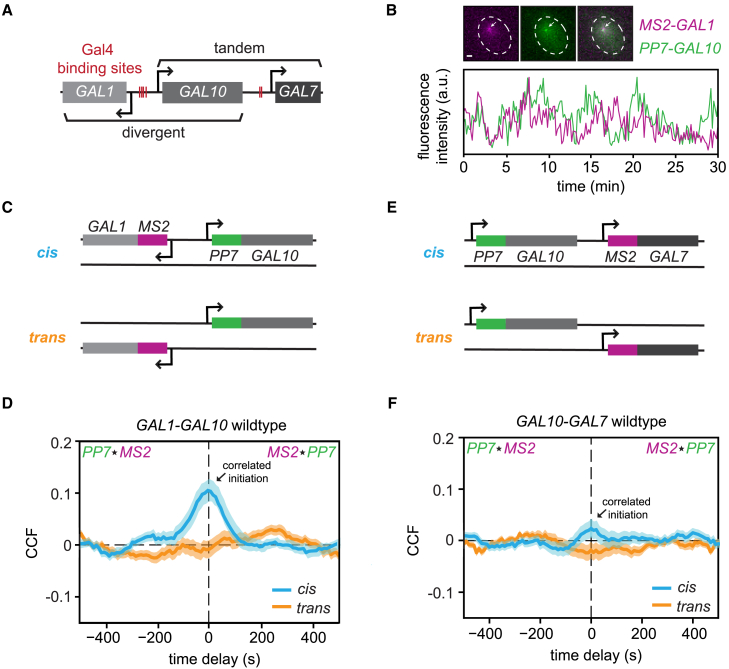
Transcriptional bursting of the divergent and tandem GAL genes is temporally coupled (A) Schematic of GAL gene cluster in yeast. Red lines indicate the binding sites of the transcription factor, Gal4....
Figureu00a02
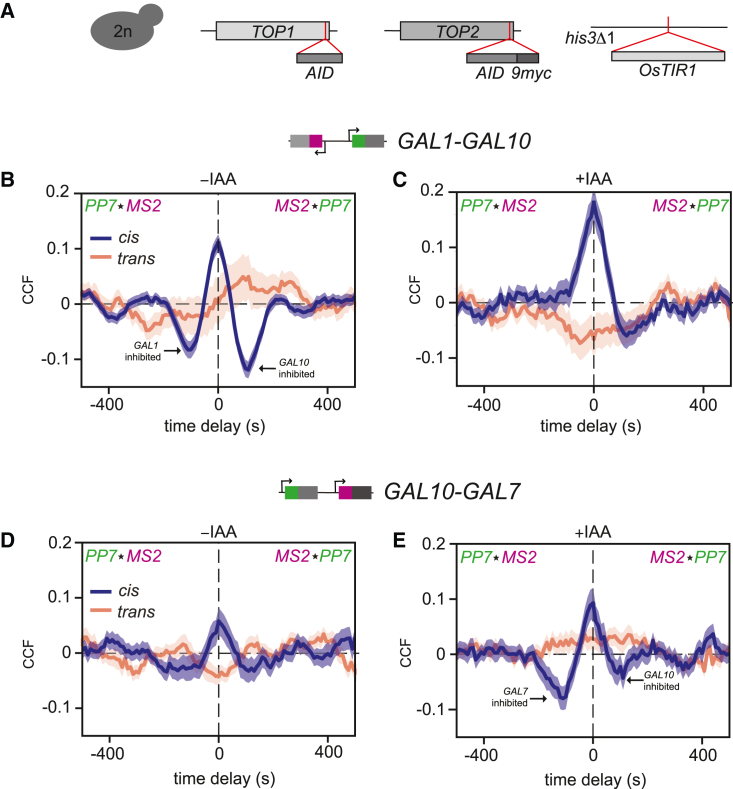
Degradation of topoisomerases results in refractory periods (A) Schematic depicting the homozygous tagging of diploid yeast (2n) of endogenous TOP1 and TOP2 with an auxin-inducible degron, and homozyg...
Figureu00a03
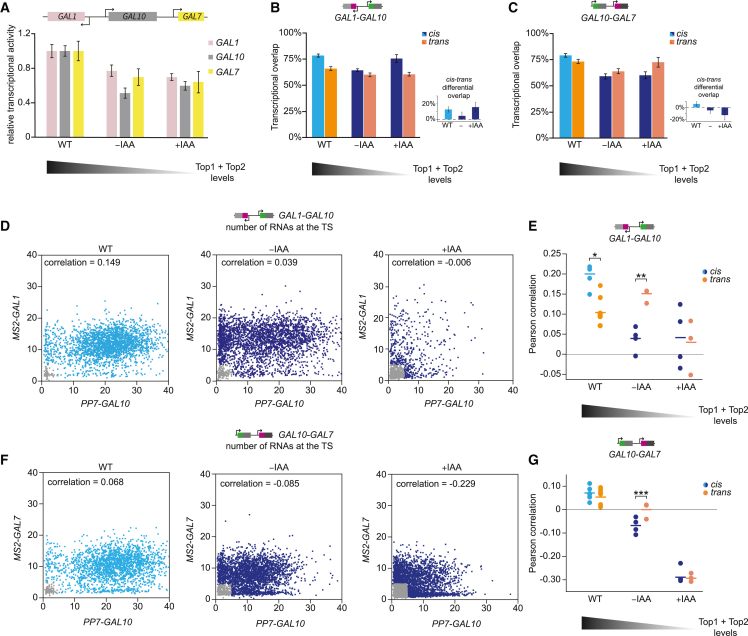
Degradation of topoisomerases reduces the simultaneous initiation of neighboring genes (A) Relative transcriptional activity of GAL1 , GAL10 , and GAL7 in WT and partial (u2212IAA) and full (+IAA) top...
Figureu00a04
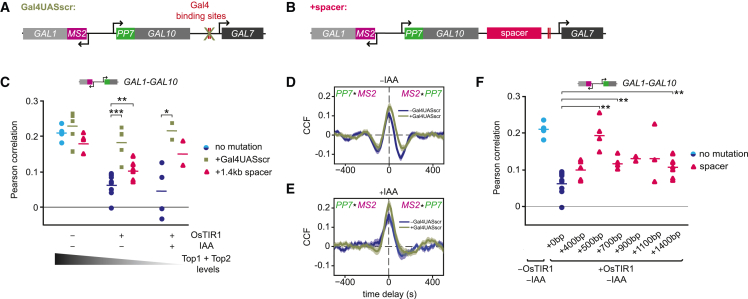
Transcription of GAL7 inhibits GAL10 transcription in partial topoisomerase degradation conditions (A and B) Schematic of the GAL1-GAL10 cis -labeled locus with: (A)u00a0scrambled Gal4UAS sites (Gal4U...
Figureu00a05
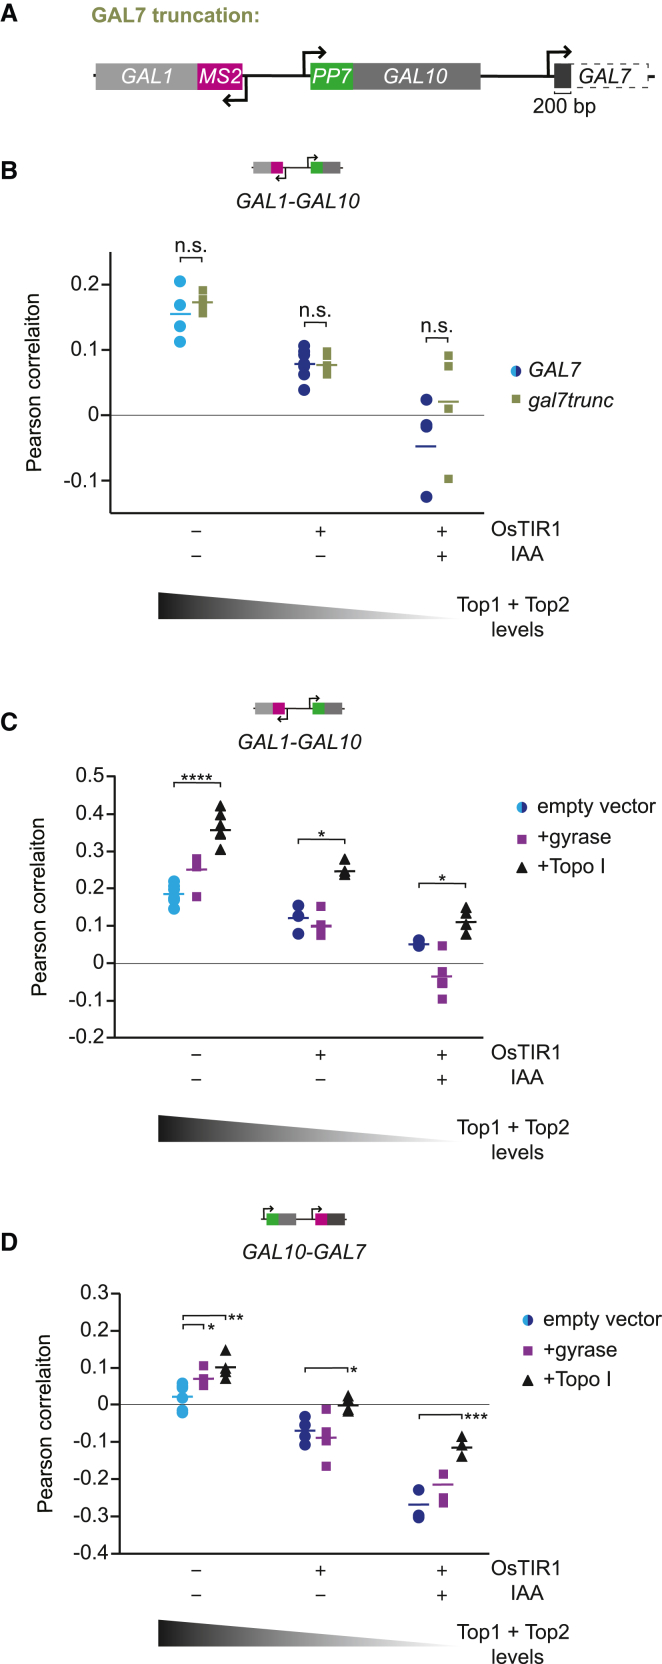
Transcription inhibition at the GAL locus is caused by both positive and negative supercoils (A) Schematic of the GAL1-GAL10 cis -labeled locus with a truncation of the GAL7 gene body from 1,100 to 20...
Figureu00a06
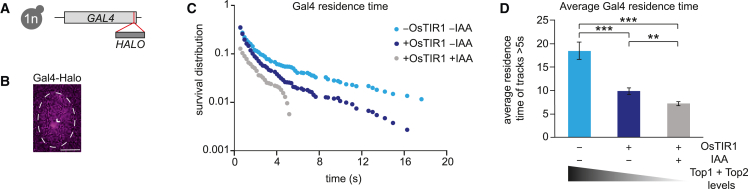
Supercoiling accumulation reduces the Gal4 residence time on DNA (A) Schematic of the C-terminal HaloTag at the endogenous GAL4 in haploid yeast (1n). (B) Representative image of a yeast cell showing ...
Figureu00a07
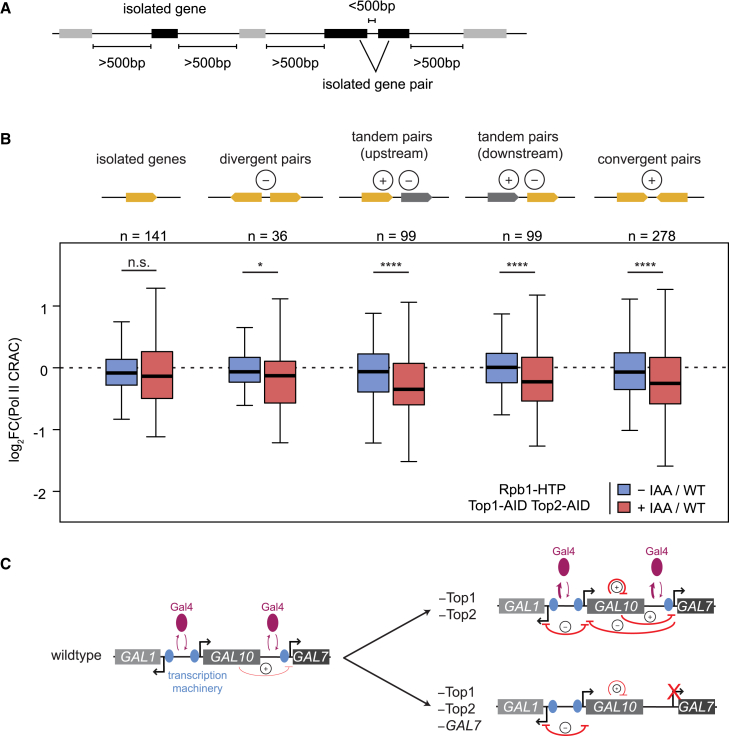
DNA supercoils inhibit neighboring genes genome-wide (A) Schematic of isolated genes and gene pairs without a neighbor within 500u00a0bp. (B) Log 2 fold change of Rpb1 CRAC signal in u2212IAA andu00a0...
Figure images are served from the NIH/NLM PubMed Central Open Access Subset or Europe PMC; copyright remains with the publishers and authors.
💬 Discussion
0 commentsNo comments yet. Be the first to start a discussion!
Leave a Comment