Abstract
The transporter associated with antigen processing (TAP) is an ATP-binding cassette (ABC) transporter essential to cellular immunity against viral infection. Some persistent viruses have evolved strategies to inhibit TAP so that they may go undetected by the immune system. The herpes simplex virus for example evades immune surveillance by blocking peptide transport with a small viral protein ICP47. In this study, we determined the structure of human TAP bound to ICP47 by electron cryo-microscopy (cryo-EM) to 4.0 Å. The structure shows that ICP47 traps TAP in an inactive conformation distinct from the normal transport cycle. The specificity and potency of ICP47 inhibition result from contacts between the tip of the helical hairpin and the apex of the transmembrane cavity. This work provides a clear molecular description of immune evasion by a persistent virus. It also establishes the molecular structure of TAP to facilitate mechanistic studies of the antigen presentation process.
🔬 Techniques
🔭 Microscopes
🧬 Organisms
💻 Software
🧪 Sample Preparation
🏭 Microscope Brands
🧪 Reagent Suppliers
💻 Software Details
📋 Protocols
💾 Data Repositories
🏛️ Research Organizations (ROR)
Affiliated research institutions:
📋 Methods
Expression of TAP and ICP47 and co-purification of the TAP/ICP47 complex Human TAP and HSV-1 ICP47 were expressed and purified as described in the earlier study ( Oldham et al., 2016 ). Briefly, ICP47 was expressed in E. coli and purified via a N-terminal glutathione S-transferase (GST) affinity tag. Pichia pastoris cells (strain SMD 1163 His+; Invitrogen) co-expressing TAP1 and TAP2 were lysed with a mixer miller (Retsch Mixer Mill 400) and incubated with purified ICP47 before solubilizing with n-Dodecyl β-D-maltoside (DDM; Anatrace). The TAP/ICP47 complex was purified on IgG Sepharose resin (GE Healthcare) via the Protein A tag at the C-terminus of TAP1. The Protein A tag was removed by PreScission protease and the complex was further purified using a Superose 6 column (GE Healthcare) in a buffer containing 20 mM Hepes, pH 7.4, 150 mM NaCl, 2 mM TCEP, 1 mM DDM, and 1 mM octaethylene glycol monododecyl ether (C12E8; Anatrace).
Electron microscopy sample preparation and microscope imaging
Cryo-EM grids were prepared as described ( Oldham et al., 2016 ). Briefly, 3 μl of purified TAP/ICP47 complex (2 mg/ml) was pipetted onto glow-discharged C-flat holey carbon CF-1.2/1.3–4C grids (Protochips). At 90% humidity, the grids were blotted for 4 s using a Vitrobot Mark IV (FEI) and frozen in liquid ethane. Imaging data were collected on a FEI Titan Krios electron microscope (acceleration voltage of 300 keV) with a K2 Summit direct electron detector (Gatan Inc.) running in super-resolution counting mode and using SerialEM ( Mastronarde, 2005 ). A Gatan Imaging filter with a slit width of 10 eV was used to remove inelastically scattered electrons. Movie frames were recorded on a single grid with a total exposure time of 10 s (200 ms per frame) using a dose rate of 8 electrons/pixel/s or 7.4 electrons/Å 2 /s.
Show full methods section
Expression of TAP and ICP47 and co-purification of the TAP/ICP47 complex Human TAP and HSV-1 ICP47 were expressed and purified as described in the earlier study ( Oldham et al., 2016 ). Briefly, ICP47 was expressed in E. coli and purified via a N-terminal glutathione S-transferase (GST) affinity tag. Pichia pastoris cells (strain SMD 1163 His+; Invitrogen) co-expressing TAP1 and TAP2 were lysed with a mixer miller (Retsch Mixer Mill 400) and incubated with purified ICP47 before solubilizing with n-Dodecyl β-D-maltoside (DDM; Anatrace). The TAP/ICP47 complex was purified on IgG Sepharose resin (GE Healthcare) via the Protein A tag at the C-terminus of TAP1. The Protein A tag was removed by PreScission protease and the complex was further purified using a Superose 6 column (GE Healthcare) in a buffer containing 20 mM Hepes, pH 7.4, 150 mM NaCl, 2 mM TCEP, 1 mM DDM, and 1 mM octaethylene glycol monododecyl ether (C12E8; Anatrace).
Electron microscopy sample preparation and microscope imaging
Cryo-EM grids were prepared as described ( Oldham et al., 2016 ). Briefly, 3 μl of purified TAP/ICP47 complex (2 mg/ml) was pipetted onto glow-discharged C-flat holey carbon CF-1.2/1.3–4C grids (Protochips). At 90% humidity, the grids were blotted for 4 s using a Vitrobot Mark IV (FEI) and frozen in liquid ethane. Imaging data were collected on a FEI Titan Krios electron microscope (acceleration voltage of 300 keV) with a K2 Summit direct electron detector (Gatan Inc.) running in super-resolution counting mode and using SerialEM ( Mastronarde, 2005 ). A Gatan Imaging filter with a slit width of 10 eV was used to remove inelastically scattered electrons. Movie frames were recorded on a single grid with a total exposure time of 10 s (200 ms per frame) using a dose rate of 8 electrons/pixel/s or 7.4 electrons/Å 2 /s.
Image processing
Movie frames were corrected using a gain reference and binned by a factor of 2, resulting in a pixel size of 1.04 Å. The effective contrast transfer function (CTF) was determined from the frame-summed micrographs using CTFFIND4 ( Rohou and Grigorieff, 2015 ). Manual picking and 2D classification was performed in Relion to produce template classes for autopicking ( Scheres, 2012 ). Particles automatically selected by Relion were inspected manually to remove false positives, resulting in a dataset of about 502,000 particles. For specimen movement correction, we compared the results from three different methods: whole frame alignment using Unblur ( Grant and Grigorieff, 2015 ), individual particle alignment using alignparts_lmbfgs ( Rubinstein and Brubaker, 2015 ), and by first aligning frames with Unblur then aligning individual particles in the Unblur-aligned movies using alignparts_Imbfgs. Using these three different procedures, the best resolution values obtained at the stage of AutoRefine3D in Relion were 7.5 Å, 7.4 Å, and 6.6 Å, respectively. Thus, the best results were obtained by combining whole frame alignment with subsequent individual particle tracking. Final reconstruction and refinements were carried out in Frealign ( Grigorieff, 2016 ) using particles aligned with Unblur and alignparts_Imbfgs. Global parameter search (mode 3) was performed at 8.0 Å resolution, followed by several iterations of local refinement with the alignment resolution limit gradually increasing from 8.0 to 6.0 Å (mode 1). The resolution of the final reconstruction was estimated at 4.0 Å using the Fourier shell correlation (FSC) of two reconstructions each containing half of the data and using 0.143 as the cut-off criterion ( Figure 1B ). Model building A model, consisting of residues 173–742 of TAP1, residues 130–681 of TAP2, and residues 1–55 of ICP47, was manually built in Coot ( Emsley et al., 2010 ). Several regions, including TAP1 residues 173–183, 215–222, 272–282, 322–325, 336–347, 431–443 and TAP2 residues 181–186 have poor density and were registered based on the homologous structure ABCB10 (PDBcode 4AYT) ( Shintre et al., 2013 ).
Refinement and validation
Model refinement was performed in both real and reciprocal space. Using the program Pdbset ( Winn et al., 2011 ), the TAP/ICP47 model was translated into a P1 crystallographic symmetry unit cell which was padded by 5 Å in each axis. The full map and the two half maps from Frealign were also translated into the unit cell using the program Maprot ( Stein et al., 1994 ). To generate a working half map for refinement, structure factors and phases were calculated from one of the translated half maps using the program Sfall ( Ten Eyck, 1977 ). The model was then refined against the working half map using PHENIX real space refine with secondary structure restraints imposed ( Adams et al., 2010 ). Subsequently, the structure was refined against the working half map in reciprocal space using Refmac ( Brown et al., 2015 ; Murshudov et al., 1997 ) with secondary structure restraints calculated from ProSMART ( Nicholls et al., 2014 ). We used the EMAN2 program suite ( Tang et al., 2007 ) to produce map from the atomic coordinates of the complex model. To access the degree of overfitting, we calculated FSC curves between the model and the half map used for refinement (work), the other half-map (free), and the full map ( Figure 1 ). The FSC curves were calculated using Spider ( Frank et al., 1996 ) by resampling the model map onto the same grid as the data maps using UCSF Chimera ( Pettersen et al., 2004 ) and calculating FSC curves between this converted map and the cryo-EM maps. The cryo-EM maps were masked using a generous mask with a smooth edge and a volume exceeding the estimated volume of the model by about 3.5 times. The FSC curves were then adjusted for the volume exceeding the volume of the model using the formula F S C c o r r e c t e d = f ∗ F S C / ( 1 + ( f − 1 ) ∗ F S C ) where f is the factor by which the mask exceeds the volume of the model ( Sindelar and Grigorieff, 2012 ). The FSC curve (green) between the model and the full map has a value of 0.5 at a resolution of 4.3 ( Figure 1E ).
Figure preparation
Figures were prepared using the programs PyMOL ( Schrödinger LLC, 2015 ) and UCSF Chimera ( Pettersen et al., 2004 ).
📊 Figures
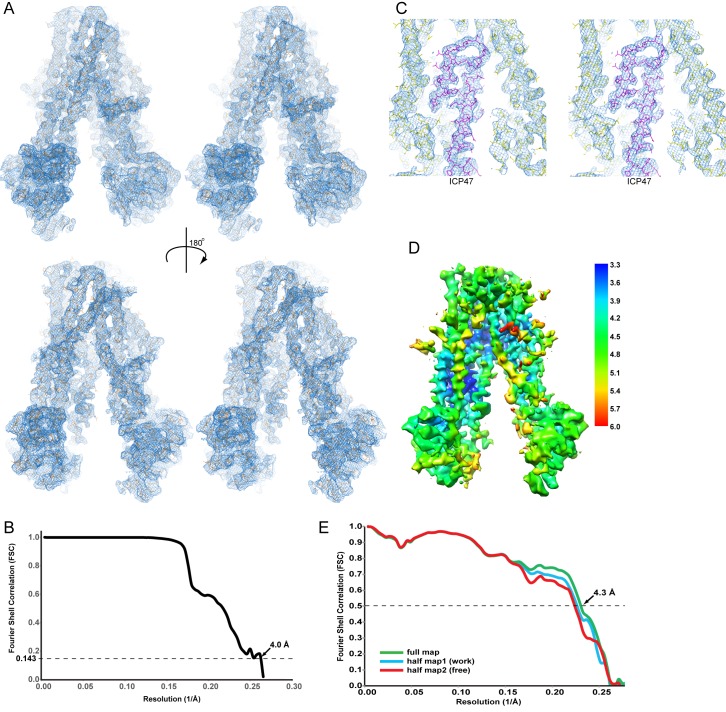
Figure 1.
Cryo-EM reconstruction of the TAP/ICP47 complex.
( A ) Stereo views of the overall density map (blue mesh), filtered to 4 u00c5 resolution and sharpened with a B-factor of u2212150 u00c5 2 , for two 180u00b0 related views. The TAP/ICP47 model is sho...
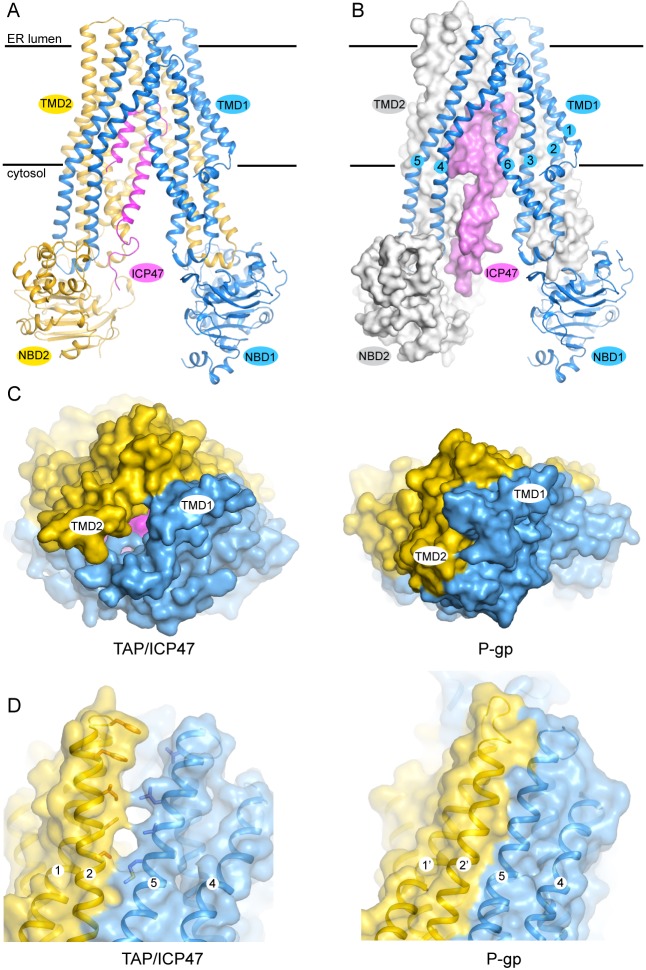
Figure 2.
The structure of TAP trapped by ICP47.
( A ) Ribbon representation of the TAP/ICP47 complex. Color code: TAP1 (blue), TAP2 (yellow), ICP47 (magenta) ( B ) The domain-swapped architecture: TAP1 is shown in ribbon representation, TAP2 and IC...
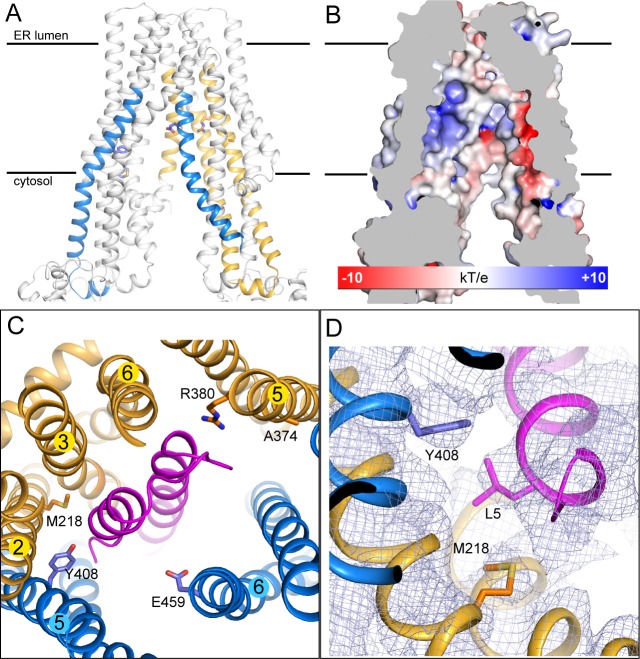
Figure 3.
The substrate-binding site.
( A ) Biochemically identified substrate-binding regions: TAP1 375u2013420 and 453u2013487 (blue), TAP2 301u2013389 and 414u2013433 (gold). The five residues previously suggested to interact with the ...
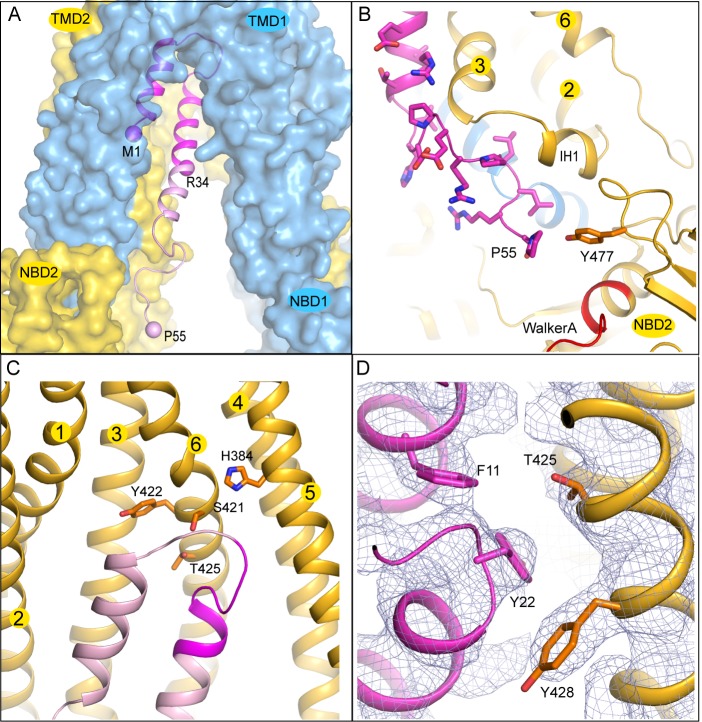
Figure 4.
The interface between TAP and ICP47.
( A ) The first 34 residues of ICP47, highlighted in darker magenta, insert into the transmembrane pathway. R34, and the first and last residues of ICP47 resolved in the structure (M1, P55) are labele...
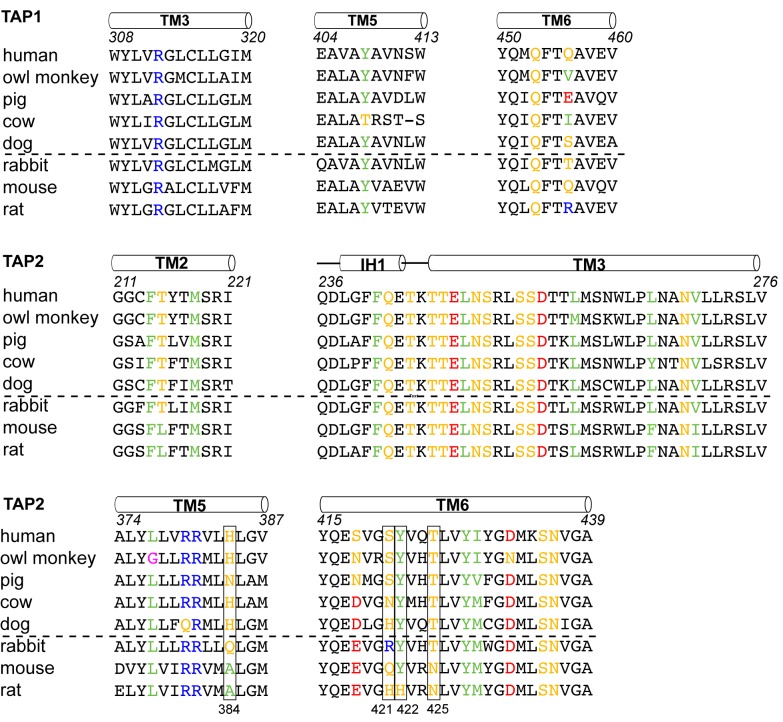
Figure 5.
Sequence alignment of the TAPu00a0residues that contact ICP47.
ICP47 inhibits TAP from human, owl monkey, pig, cow and dog (the top five sequences), but not that of rabbit, mouse and rat (the bottom three sequences). Residues contacting ICP47 are colored based on...
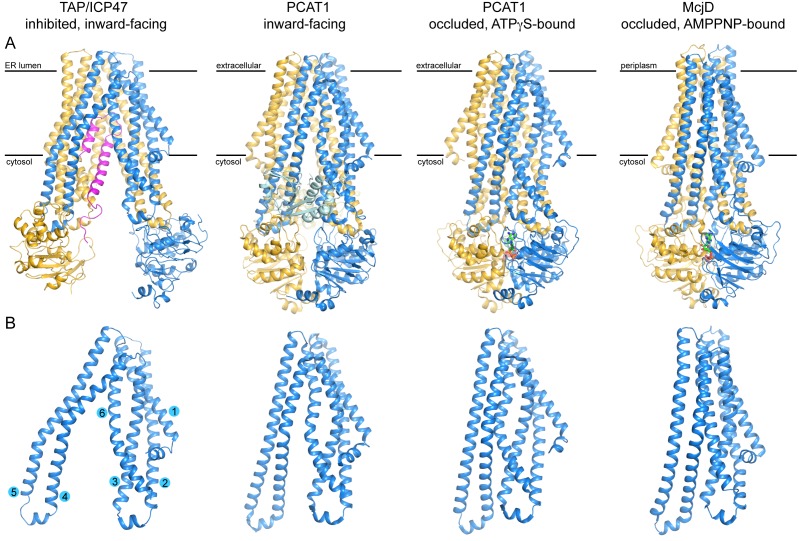
Figure 6.
Structures of three peptide transporters in the ABC family.
( A ) Ribbon representations. The two subunits are shown in blue and gold, respectively. ICP47 is colored in magenta. The peptidase domains of PCAT1 observed in the inward-facing conformation are colo...
Figure images are served from the NIH/NLM PubMed Central Open Access Subset or Europe PMC; copyright remains with the publishers and authors.
💬 Discussion
0 commentsNo comments yet. Be the first to start a discussion!
Leave a Comment