Abstract
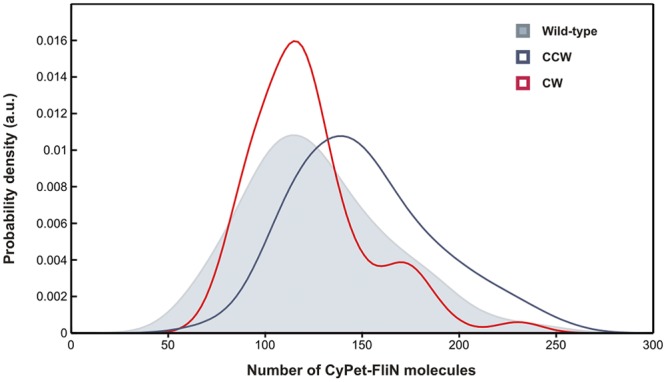
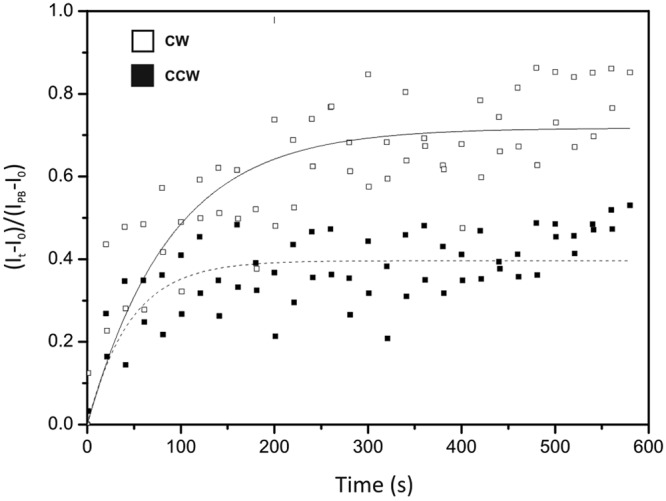
ABSTRACT Some proteins in biological complexes exchange with pools of free proteins while the complex is functioning. Evidence is emerging that protein exchange can be part of an adaptive mechanism. The bacterial flagellar motor is one of the most complex biological machines and is an ideal model system to study protein dynamics in large multimeric complexes. Recent studies showed that the copy number of FliM in the switch complex and the fraction of FliM that exchanges vary with the direction of flagellar rotation. Here, we investigated the stoichiometry and turnover of another switch complex component, FliN, labeled with the fluorescent protein CyPet, in Escherichia coli . Our results confirm that, in vivo , FliM and FliN form a complex with stoichiometry of 1:4 and function as a unit. We estimated that wild-type motors contained 120 ± 26 FliN molecules. Motors that rotated only clockwise (CW) or counterclockwise (CCW) contained 114 ± 17 and 144 ± 26 FliN molecules, respectively. The ratio of CCW-to-CW FliN copy numbers was 1.26, very close to that of 1.29 reported previously for FliM. We also measured the exchange of FliN molecules, which had a time scale and dependence upon rotation direction similar to those of FliM, consistent with an exchange of FliM-FliN as a unit. Our work confirms the highly dynamic nature of multimeric protein complexes and indicates that, under physiological conditions, these machines might not be the stable, complete structures suggested by averaged fixed methodologies but, rather, incomplete rings that can respond and adapt to changing environments. IMPORTANCE The flagellum is one of the most complex structures in a bacterial cell, with the core motor proteins conserved across species. Evidence is now emerging that turnover of some of these motor proteins depends on motor activity, suggesting that turnover is important for function. The switch complex transmits the chemosensory signal to the rotor, and we show, by using single-cell measurement, that both the copy number and the fraction of exchanging molecules vary with the rotational bias of the rotor. When the motor is locked in counterclockwise rotation, the copy number is similar to that determined by averaged, fixed methodologies, but when locked in a clockwise direction, the number is much lower, suggesting that that the switch complex ring is incomplete. Our results suggest that motor remodeling is an important component in tuning responses and adaptation at the motor.
🔬 Techniques
🧬 Organisms
✨ Fluorophores
🧪 Sample Preparation
🔬 Cell Lines
🏭 Microscope Brands
📷 Detectors
💻 Software Details
💾 Data Repositories
🏛️ Research Organizations (ROR)
Affiliated research institutions:
📋 Methods
Cell strains and preparation. Four experimental strains were used for this study ( Table 1 ). Cells were grown in 10 ml tryptone broth (TB) at 30°C to mid-log phase (optical density at 600 nm of 0.5). When needed, 100 µM of isopropyl-β- d -thiogalactopyranoside (IPTG) and 100 µl·ml −1 of ampicillin were added to the TB. Filaments were sheared by forcing 1 ml of the cell suspension 75 times between two syringes with 26-gauge needles connected by a piece of polyethylene tubing (12 cm long, 0.58-mm inner diameter) ( 12 ). The cell suspension was centrifuged 3 times at 6,000 × g for 3 min and resuspended in 75 µl motility buffer. The cells were flowed through a tunnel slide and left to incubate for 5 min. Motility buffer containing 50 µl·ml −1 of chloramphenicol was then flushed through the tunnel slide to remove unbound cells. TABLE 1 List of strains used in study Strain Description a Background JPA809 cyPet-fliN fliC (St) RP437 ( 24 ) b JPA810 cyPet-fliN fliC (St) Δ cheY RP5232 ( 24 ) JPA811 cyPet-fliN fliC (St) Δ cheY (pIND-cheY D13K/Y106W ) RP5232 JPA812 cyPet-fliN fliC (St) Δ cheY (pIND-cheY D57A ) RP437 JPA813 cyPet-motB fliC (St) RP437 a St, sticky phenotype. b Reference for background strains. Microscopy. We used a home-built inverted microscope with a 15-mW 440-nm laser (PPMT LD1650; Laser 2000, United Kingdom) and a 532-nm diode-pumped solid-state (DPSS) laser (Laser 2000), as described previously ( 6 ). Laser epifluorescence illumination was used for all fluorescence imaging of the motor spots for measurements of the copy number of CyPet-FliN molecules, and total internal reflection fluorescence (TIRF) mode for complementation experiments. The intensities were ~0.127 µW·µm −2 and ~2 µW·µm −2 for the 440-nm (CyPet-MotB and CyPet-FliN) and 532-nm (FliM-YPet) illumination, respectively. Photobleaching of the CyPet-FliN motors was achieved by a 420-ms exposure to a focused laser spot (~3 mW·µm −2 ) centered over the fluorescent spot at the center of rotation of the tethered cell. The total intensity integrated over the whole cell immediately after this photobleaching was 90% ± 4% of that before photobleaching. Fluorescence emissions from CyPet-FliN and YPet-FliM were imaged, as described previously ( 6 ), in frame transfer mode at 50 nm/pixel at 25 Hz using a 128- by 128-pixel, cooled, back-thinned electron-multiplying charge-coupled device camera (iXon DV860-BI; Andor Technology). Fifty frames were recorded for stoichiometry experiments, and the initial fluorescence intensity was extracted using the method described previously ( 6 , 10 ). For complementation experiments examining the effect of FliM and FliN on each other, a single frame was recorded for each motor. For FRAP experiments, two 140-ms epifluorescence exposures were taken every 20 s after photobleaching. CyPet-MotB motors were ~7 times less bright than CyPet-FliN motors and showed the expected linear relationship between exposure time and fluorescence intensity (see Fig. S1 in the supplemental material). Therefore, the exposure time was increased 7-fold for observations of CyPet-MotB spots. Image acquisition and analysis. The fluorescence intensity of each motor spot was determined manually using ImageJ for each frame. Average curves were generated for FRAP, and all intensity components were corrected for photobleaching during observation by multiplication with a cumulative factor, exp( t total / t 0 ), where t total is the total accumulated time under observation and t 0 is the appropriate bleach time constant measured over 35 cells under the conditions described above ( t 0 = 44.68 s). The prebleach fluorescence intensity ( I PB ) was determined by averaging over 10 frames before bleaching. Fluorescence recovery data were fitted using the BoxLucas1 fitting option in OriginPro 8.5.1 (OriginLab Corporation, USA). Estimating FliN stoichiometry. The fluorescence intensity of a single CyPet molecule was estimated using CyPet-MotB as follows. The initial intensities of 45 CyPet-MotB motor spots were measured, and the average spot intensity at a 40-ms exposure time (i.e., under imaging conditions identical to those used for CyPet-FliN) was found to be 745 ± 112 counts (see Fig. S1 in the supplemental material). Assuming an average of 22 MotB molecules per motor ( 5 ), we estimated that each CyPet-MotB molecule contributes 33 ± 8 counts to the intensity of a motor spot. The initial spot intensities for CyPet-FliN were divided by this number to estimate the number of fluorescent molecules per spot.
Show full methods section
Cell strains and preparation. Four experimental strains were used for this study ( Table 1 ). Cells were grown in 10 ml tryptone broth (TB) at 30°C to mid-log phase (optical density at 600 nm of 0.5). When needed, 100 µM of isopropyl-β- d -thiogalactopyranoside (IPTG) and 100 µl·ml −1 of ampicillin were added to the TB. Filaments were sheared by forcing 1 ml of the cell suspension 75 times between two syringes with 26-gauge needles connected by a piece of polyethylene tubing (12 cm long, 0.58-mm inner diameter) ( 12 ). The cell suspension was centrifuged 3 times at 6,000 × g for 3 min and resuspended in 75 µl motility buffer. The cells were flowed through a tunnel slide and left to incubate for 5 min. Motility buffer containing 50 µl·ml −1 of chloramphenicol was then flushed through the tunnel slide to remove unbound cells. TABLE 1 List of strains used in study Strain Description a Background JPA809 cyPet-fliN fliC (St) RP437 ( 24 ) b JPA810 cyPet-fliN fliC (St) Δ cheY RP5232 ( 24 ) JPA811 cyPet-fliN fliC (St) Δ cheY (pIND-cheY D13K/Y106W ) RP5232 JPA812 cyPet-fliN fliC (St) Δ cheY (pIND-cheY D57A ) RP437 JPA813 cyPet-motB fliC (St) RP437 a St, sticky phenotype. b Reference for background strains. Microscopy. We used a home-built inverted microscope with a 15-mW 440-nm laser (PPMT LD1650; Laser 2000, United Kingdom) and a 532-nm diode-pumped solid-state (DPSS) laser (Laser 2000), as described previously ( 6 ). Laser epifluorescence illumination was used for all fluorescence imaging of the motor spots for measurements of the copy number of CyPet-FliN molecules, and total internal reflection fluorescence (TIRF) mode for complementation experiments. The intensities were ~0.127 µW·µm −2 and ~2 µW·µm −2 for the 440-nm (CyPet-MotB and CyPet-FliN) and 532-nm (FliM-YPet) illumination, respectively. Photobleaching of the CyPet-FliN motors was achieved by a 420-ms exposure to a focused laser spot (~3 mW·µm −2 ) centered over the fluorescent spot at the center of rotation of the tethered cell. The total intensity integrated over the whole cell immediately after this photobleaching was 90% ± 4% of that before photobleaching. Fluorescence emissions from CyPet-FliN and YPet-FliM were imaged, as described previously ( 6 ), in frame transfer mode at 50 nm/pixel at 25 Hz using a 128- by 128-pixel, cooled, back-thinned electron-multiplying charge-coupled device camera (iXon DV860-BI; Andor Technology). Fifty frames were recorded for stoichiometry experiments, and the initial fluorescence intensity was extracted using the method described previously ( 6 , 10 ). For complementation experiments examining the effect of FliM and FliN on each other, a single frame was recorded for each motor. For FRAP experiments, two 140-ms epifluorescence exposures were taken every 20 s after photobleaching. CyPet-MotB motors were ~7 times less bright than CyPet-FliN motors and showed the expected linear relationship between exposure time and fluorescence intensity (see Fig. S1 in the supplemental material). Therefore, the exposure time was increased 7-fold for observations of CyPet-MotB spots. Image acquisition and analysis. The fluorescence intensity of each motor spot was determined manually using ImageJ for each frame. Average curves were generated for FRAP, and all intensity components were corrected for photobleaching during observation by multiplication with a cumulative factor, exp( t total / t 0 ), where t total is the total accumulated time under observation and t 0 is the appropriate bleach time constant measured over 35 cells under the conditions described above ( t 0 = 44.68 s). The prebleach fluorescence intensity ( I PB ) was determined by averaging over 10 frames before bleaching. Fluorescence recovery data were fitted using the BoxLucas1 fitting option in OriginPro 8.5.1 (OriginLab Corporation, USA). Estimating FliN stoichiometry. The fluorescence intensity of a single CyPet molecule was estimated using CyPet-MotB as follows. The initial intensities of 45 CyPet-MotB motor spots were measured, and the average spot intensity at a 40-ms exposure time (i.e., under imaging conditions identical to those used for CyPet-FliN) was found to be 745 ± 112 counts (see Fig. S1 in the supplemental material). Assuming an average of 22 MotB molecules per motor ( 5 ), we estimated that each CyPet-MotB molecule contributes 33 ± 8 counts to the intensity of a motor spot. The initial spot intensities for CyPet-FliN were divided by this number to estimate the number of fluorescent molecules per spot.
SUPPLEMENTAL MATERIAL Figure S1 CyPet-MotB stoichiometry and linear relationship between exposure time and fluorescence intensity. The Gaussian fit on the kernel density estimation peaks at 745 counts. The standard deviation is ± 112 counts. Inset shows linear relationship between intensities of CyPet-MotB motors and exposure times. The laser power was kept identical for each data point. Download Figure S1, PDF file, 0.3 MB Figure S2 CyPet-FliN distribution in cyPet-fliN /Δ cheY /CheY D57A strain (CCW motors). Gaussian kernel distribution estimation peaked at 143 ± 30 molecules. Download Figure S2, PDF file, 0.2 MB Video S1 Tethered JPA810 cells. A fluorescent spot is visible at the center of rotation. Exposure time, 40 ms; field of view, 6 by 6 µm. Download Video S1, AVI file, 4.2 MB Video S2 Moving CyPet-FliN spots in JPA811 cells. The cells are stuck to the coverslip. Exposure time, 40 ms; field of view, 6 by 6 µm. Download Video S2, AVI file, 3.7 MB Video S3 Moving CyPet-FliN spots in JPA810 cells. The cells are stuck to the coverslip. Exposure time, 40 ms; field of view, 6 by 6 µm. Download Video S3, AVI file, 3.7 MB
📊 Figures
FIGu00a01u00a0
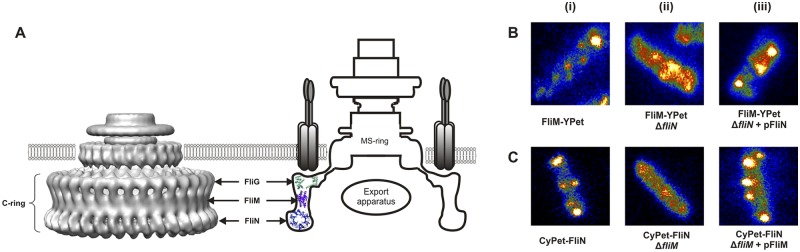
(A) Three-dimensional reconstructions from cryoelectron micrographs of the CW-locked rotor from Salmonella enterica serovar Typhimurium (PDB EMDB accession number 1887) (left) ( 19 ), and schematic of...
FIGu00a02u00a0
CyPet-FliN distribution in wild-type motors (shaded curve, 80 cells), CW motors (red solid line, 55 cells), and CCW motors (blue solid line, 64 cells). Gaussian kernel distribution estimations peaked ...
FIGu00a03u00a0
Average fluorescence recovery versus time for CyPet-FliN in CCW ( n = 8) and CW ( n = 17) motors. Values for k off were obtained from the following fits: 0.022 u00b1 0.005u00a0s u22121 for CCW and 0.0...
Figure images are served from the NIH/NLM PubMed Central Open Access Subset or Europe PMC; copyright remains with the publishers and authors.
💬 Discussion
0 commentsNo comments yet. Be the first to start a discussion!
Leave a Comment