Abstract
G-quadruplex structures can occur throughout the genome, including at telomeres. They are involved in cellular regulation and are potential drug targets. Human telomeric G-quadruplex structures can fold into a number of different conformations and show large conformational diversity. To elucidate the different G-quadruplex conformations and their dynamics, we investigated telomeric G-quadruplex folding using single molecule FRET microscopy in conditions where it was previously believed to yield low structural heterogeneity. We observed four FRET states in Na(+) buffers: an unfolded state and three G-quadruplex related states that can interconvert between each other. Several of these states were almost equally populated at low to medium salt concentrations. These observations appear surprising as previous studies reported primarily one G-quadruplex conformation in Na(+) buffers. Our results permit, through the analysis of the dynamics of the different observed states, the identification of a more stable G-quadruplex conformation and two transient G-quadruplex states. Importantly these results offer a unique view into G-quadruplex topological heterogeneity and conformational dynamics.
🔬 Techniques
✨ Fluorophores
🏭 Microscope Brands
🧪 Reagent Suppliers
📷 Detectors
🏛️ Research Organizations (ROR)
Affiliated research institutions:
📋 Methods
DNA sequence and sample preparation
DNA oligonucleotides were purchased from IBA (Germany). The G-quadruplex strand sequence with human telomere repeats is 5′- GCA GGC GTG GCA CCG GTA ATA GGA TTA GGG TT A GGG (TTA GGG ) 3 -Cy3, with the G-rich single stranded overhang marked in bold. The G-quadruplex strand includes the human telomeric repeat motif at the end of which Cy3 was attached via amidite coupling. The complementary stem oligo is AAC CCX AAT CCT ATT ACC GGT GCC ACG CCT GC-biotin where X denotes an amino-C6 dT base where Cy5 was attached via NHS coupling. It contained a biotin at the 3′-end for surface immobilization. Constructs were also designed with swapped positions of Cy3 and Cy5, i.e. Cy5 is placed at the end of the 3′ end of the G-quadruplex strand (both dyes via NHS coupling). For the mutant studies, (TTAGGG) 3 was replaced by ( C TAGGG) 3 , where the underlined base denotes the change from T to C. A second mutant was used where the last three Gs at the 3’end were replaced by Ts. This sequence cannot form a G-quadruplex but is expected to be able to form a G-triplex structure ( 25 ). Corresponding unlabeled DNA single stranded sequences of 22 nt were used for circular dichroism (CD) spectroscopy measurements. The stem and the G-quadruplex strands were annealed in a 1:1 mixture in annealing buffer (20 mM Tris–HCl buffer (pH 7.5) containing either 100 mM LiCl, NaCl or KCl) by heating the mixture to 95°C for 5 min and then cooling down to room temperature over a few hours. At this stage the concentration of the DNA product was 5 μM. Hybridization was performed in the same salt type as subsequently used in the FRET and CD measurements so that additional salt did not affect the measurements ( 26 ). smFRET experiments and data analysis DNA constructs (Figure 2A ) were immobilized via biotin-streptavidin interaction on a quartz coverglass for prism-based total internal reflection fluorescence microscopy. Fluorescence was measured using an inverted wide-field optical microscope and alternate laser excitation at 514 and 630 nm of the donor and acceptor fluorophores, respectively. The excitation powers were 0.34 kW/cm 2 and 0.11 kW/cm 2 for the green and red lasers, respectively. Fluorescence movies were recorded with an EMCCD camera (Andor, iXON 3) with a 150 ms integration time per image and a total length of 300 s. Figure 2.
Show full methods section
DNA sequence and sample preparation
DNA oligonucleotides were purchased from IBA (Germany). The G-quadruplex strand sequence with human telomere repeats is 5′- GCA GGC GTG GCA CCG GTA ATA GGA TTA GGG TT A GGG (TTA GGG ) 3 -Cy3, with the G-rich single stranded overhang marked in bold. The G-quadruplex strand includes the human telomeric repeat motif at the end of which Cy3 was attached via amidite coupling. The complementary stem oligo is AAC CCX AAT CCT ATT ACC GGT GCC ACG CCT GC-biotin where X denotes an amino-C6 dT base where Cy5 was attached via NHS coupling. It contained a biotin at the 3′-end for surface immobilization. Constructs were also designed with swapped positions of Cy3 and Cy5, i.e. Cy5 is placed at the end of the 3′ end of the G-quadruplex strand (both dyes via NHS coupling). For the mutant studies, (TTAGGG) 3 was replaced by ( C TAGGG) 3 , where the underlined base denotes the change from T to C. A second mutant was used where the last three Gs at the 3’end were replaced by Ts. This sequence cannot form a G-quadruplex but is expected to be able to form a G-triplex structure ( 25 ). Corresponding unlabeled DNA single stranded sequences of 22 nt were used for circular dichroism (CD) spectroscopy measurements. The stem and the G-quadruplex strands were annealed in a 1:1 mixture in annealing buffer (20 mM Tris–HCl buffer (pH 7.5) containing either 100 mM LiCl, NaCl or KCl) by heating the mixture to 95°C for 5 min and then cooling down to room temperature over a few hours. At this stage the concentration of the DNA product was 5 μM. Hybridization was performed in the same salt type as subsequently used in the FRET and CD measurements so that additional salt did not affect the measurements ( 26 ). smFRET experiments and data analysis DNA constructs (Figure 2A ) were immobilized via biotin-streptavidin interaction on a quartz coverglass for prism-based total internal reflection fluorescence microscopy. Fluorescence was measured using an inverted wide-field optical microscope and alternate laser excitation at 514 and 630 nm of the donor and acceptor fluorophores, respectively. The excitation powers were 0.34 kW/cm 2 and 0.11 kW/cm 2 for the green and red lasers, respectively. Fluorescence movies were recorded with an EMCCD camera (Andor, iXON 3) with a 150 ms integration time per image and a total length of 300 s. Figure 2.
DNA constructs forming
G-quadruplexes and FRET efficiency distributions ( A ) Schematic representation of the DNA sample containing a 32-bp long double stranded DNA stem with a 3′ overhang capable of forming a G-quadruplex structure. The attached biotin is shown in blue and Cy3 and Cy5 are shown in green and red respectively. ( B – E ) Single molecule FRET histograms, showing the FRET efficiency distribution for (B) TTAGGG in 100 mM LiCl, (C) TTAGGG in 100 mM KCl, (D) TTAGGG in 100 mM NaCl and (E) CTAGGG in 100 mM KCl. DNA samples were diluted in dilution buffers (20 mM Tris–HCl buffer (pH 7.5) containing either 100 mM LiCl, or 100, 200 or 400 mM NaCl, or 100 mM KCl) where the salt type and amount corresponded to those selected for imaging conditions. Sample chambers for smFRET measurements were coated with BSA-biotin and streptavidin and incubated with the DNA samples at a concentration of ∼20–30 pM for 5 min. The chamber was then washed with dilution buffer and afterwards flushed with an imaging buffer consisting of the dilution buffer supplemented with an oxygen scavenging system composed of 2 mM Trolox (Sigma Aldrich), glucose oxidase (Sigma Aldrich, 0.92 mg/ml), catalase (Sigma Aldrich, 0.04 mg/ml) and β-D-(+) glucose (Sigma Aldrich, 4.5mg/ml). Fresh imaging buffer was flushed into the chamber every 30 min. Detailed protocols for these single molecule FRET measurements can be found in Krüger et al . ( 27 ). Data analysis was performed with the home-made software package iSMS ( 28 ). Briefly, FRET-pairs were identified by automated image registration of the donor and acceptor emission channels and subsequently co-localization of the donor/acceptor fluorescence spots. The resulting fluorescence time traces of identified FRET-pairs were calculated by aperture photometry and only molecules ending with single-step donor and/or acceptor photobleaching, or showing clear dynamics with anti-correlated donor-acceptor fluorescence, were selected for further analysis as this indicated that the source of the signal was a single doubly labeled molecule. The FRET efficiencies were obtained from the donor and acceptor fluorescence intensities as: documentclass[12pt]{minimal} usepackage{amsmath} usepackage{wasysym} usepackage{amsfonts} usepackage{amssymb} usepackage{amsbsy} usepackage{upgreek} usepackage{mathrsfs} setlength{oddsidemargin}{-69pt} begin{document} }{}begin{equation*} E = frac{{F_A^D }}{{F_A^D + gamma ,F_D^D }} end{equation*}end{document} Here documentclass[12pt]{minimal} usepackage{amsmath} usepackage{wasysym} usepackage{amsfonts} usepackage{amssymb} usepackage{amsbsy} usepackage{upgreek} usepackage{mathrsfs} setlength{oddsidemargin}{-69pt} begin{document} }{}$F_D^D$end{document} and documentclass[12pt]{minimal} usepackage{amsmath} usepackage{wasysym} usepackage{amsfonts} usepackage{amssymb} usepackage{amsbsy} usepackage{upgreek} usepackage{mathrsfs} setlength{oddsidemargin}{-69pt} begin{document} }{}$F_A^D$end{document} denote donor and acceptor fluorescence intensities after donor excitations, respectively. The values were corrected for background signal, donor leakage and direct acceptor contributions. The factor γ corrects for differences in brightness and detection efficiency for the donor and acceptor fluorophores. Correction factors (γ, donor leakage and direct acceptor excitation) were determined for each buffer conditions (Supplementary Table T1) enabling comparing FRET efficiencies between different experimental conditions. FRET time series showing transitional dynamics were analyzed using hidden Markov modeling with the variational Bayesian expectation maximization technique ( 29 ). To extract dwell times for each FRET states, only FRET time traces showing four different states were used. This analysis procedure ensured a correct assignment of all four FRET states and especially of the two middle FRET states E ∼ 0.5 and E ∼ 0.6, which are otherwise difficult to distinguish due to the intrinsic low signal to noise ratio of smFRET and overlapping FRET distributions. An overview of the single molecule data in Na + buffers is given in the Supplementary information (Supplementary Table T2). Only data arising from doubly labeled molecules and having active fluorophores were included in single molecule FRET histograms, which thus directly reflect conformational distributions. All frames of each smFRET time trace prior the first fluorophore bleaching event were used to make single molecule FRET histogram plots. Each frame yields a count in the single molecule FRET histograms. To check that molecules with long time traces were not over contributing to the overall histogram, single molecule FRET histograms were also made using only the first 30 frames of each smFRET time trace (data not shown). These latter plots yielded very similar FRET histograms as when all frames were included.
SUPPLEMENTARY DATA Supplementary Data are available at NAR Online. SUPPLEMENTARY DATA
📊 Figures
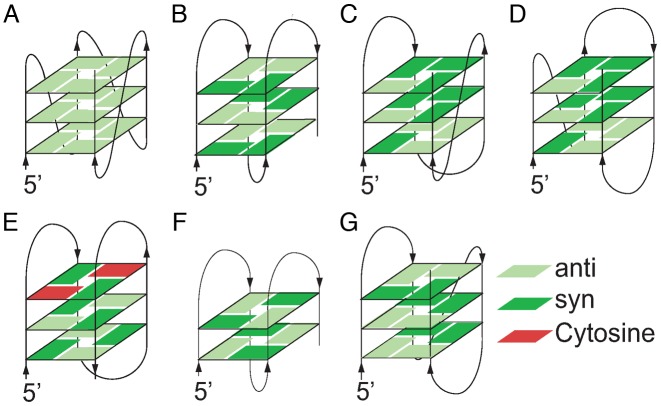
Figure 1.
Schematic view of different reported telomeric G-quadruplex conformations: ( A ) parallel conformation, ( B ) anti-parallel basket conformation, ( C ) (3 + 1) form 1, ( D ) (3 + 1) form 2, ( E ) chair...
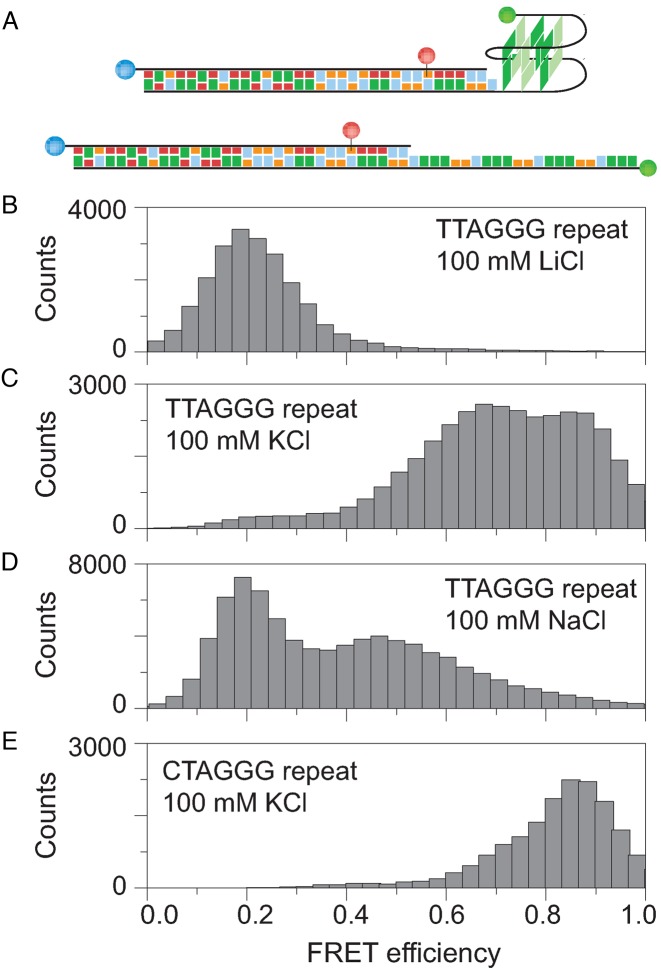
Figure 2.
DNA constructs forming G-quadruplexes and FRET efficiency distributions ( A ) Schematic representation of the DNA sample containing a 32-bp long double stranded DNA stem with a 3u2032 overhang capable...
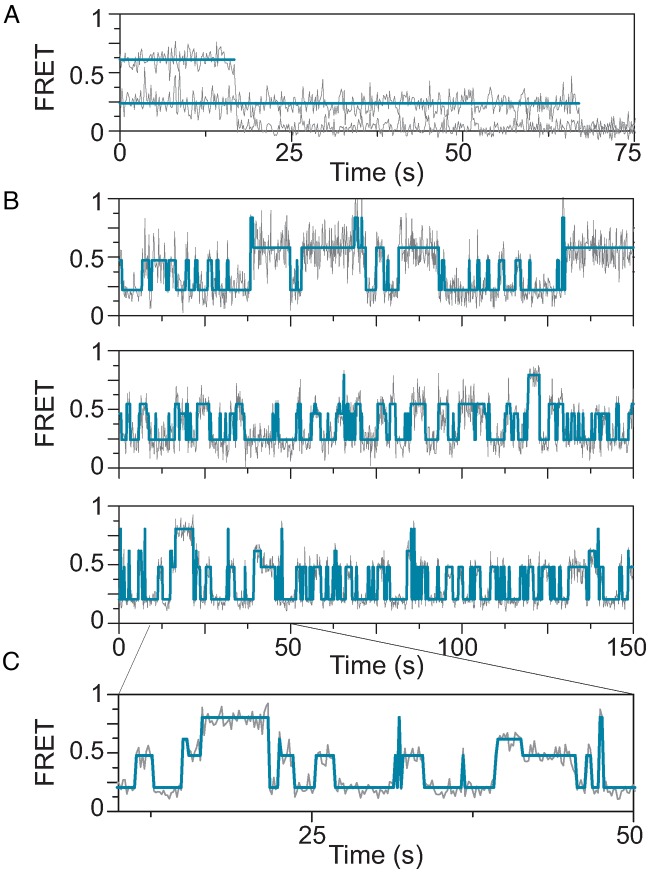
Figure 3.
Single molecules FRET time traces of G-quadruplexes with the human telomeric repeat TTAGGG in 100 mM NaCl: ( A ) example of two single molecule FRET time traces of molecules showing no dynamic behavio...
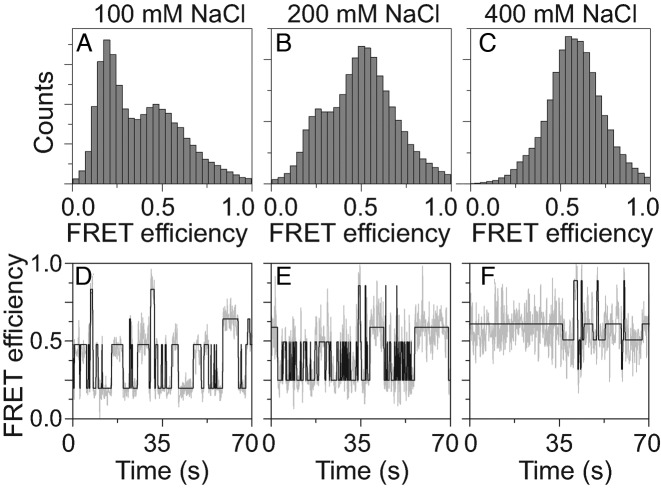
Figure 4.
Effect of increasing Na + ion concentration: top panel: single molecule histograms of G-quadruplexes with the human telomeric repeat TTAGGG as a function of Na + ion concentration for ( A ) 100 mM ( B...
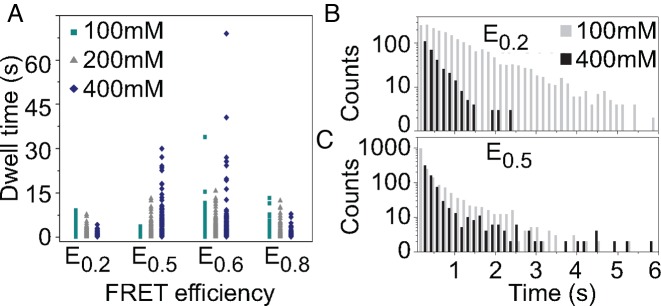
Figure 5.
Dwells times of the different FRET states ( A ) Dwell times as a function of FRET efficiency ( B ) Histograms of the dwell times for 100 mM, and 400 mM NaCl for the E 0.2 and the E 0.5 states. Data ar...
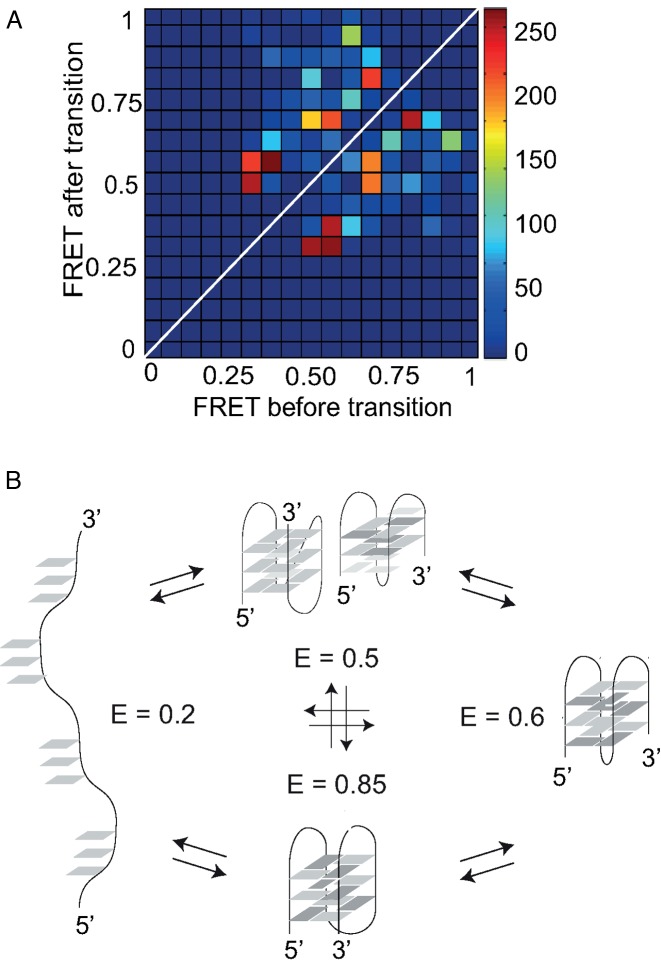
Figure 6.
G-quadruplex folding pathways ( A ) Transition density plot for 400 mM NaCl showing the number of transitions between different initial and final FRET states in all FRET time traces showing dynamics. ...
Figure images are served from the NIH/NLM PubMed Central Open Access Subset or Europe PMC; copyright remains with the publishers and authors.
💬 Discussion
0 commentsNo comments yet. Be the first to start a discussion!
Leave a Comment