Abstract
Food-borne methicillin-resistance Staphylococcus aureus (MRSA) has caused significant health threats and economic loss in livestock and poultry products. Garlic essential oil (GEO) is an effective antibacterial agent but presents strong instability and hydrophobicity. In this study, GEO in water nanoemulsion (GEON) with good stability was produced by emulsification technique of high-power ultrasound. Its antibacterial activity and underlying mechanism against MRSA isolated from retailed pork were investigated. Results showed that ultrasonic treatment significantly reduced the particle size of GENO from 820.3 to 215.0 nm as time increased from 0 to 10 min. Comparatively, GEON of 10 min ultrasound was more stable than other GEONs (0, 1, 5 min) during 30 d storage. It also displayed good thermal stability and relatively good ion stability (NaCl, MgCl2, and glucose). Antibacterial analysis showed that GEON (10 min) exhibited the best anti-MRSA activity among all GEONs, and the minimum inhibitory concentration of GEO in this nanoemulsion was 0.125 % (1.25 mg/mL). Treatment of GEON (10 min) significantly suppressed the cell proliferation of MRSA, which was mainly achieved by damaging the cell membrane as evidenced by membrane depolarization and considerable leakage of intracellular nucleic acids and protein. Laser scanning confocal microscope and scanning electron microscopy showed that treatment of GEON (10 min) significantly altered the membrane integrity and severely damaged the cellular membrane and structure. The present work illustrated that GEON produced by ultrasonic emulsification is a promising alternative to inhibit the contamination and spread of MRSA in livestock and poultry products.
🔬 Techniques
🔭 Microscopes
🧬 Organisms
✨ Fluorophores
🧪 Sample Preparation
🏭 Microscope Brands
🧪 Reagent Suppliers
💻 Software Details
🏛️ Research Organizations (ROR)
Affiliated research institutions:
📋 Methods
Preparation of GEON
GEO was purchased from Anhui Kaibo Biological Technology Co., ltd (China). It was extracted from the garlic bulb using the steam distillation method. For coarse emulsion preparation, GEO, surfactant (Tween 80) and distilled water (weight ratio of 10:1:89) were mixed and homogenized at 18000 rpm for 120 s using a high-speed homogenizer (FA25; Shanghai Fluke Fluid Machinery Manufacturing, China) [15] . As for GEON preparation, the resulting coarse emulsion was further emulsified using a 20 kHz ultrasonic facility (SCIENTZ-ⅡD, Ningbo Xinzhi Biotechnology, China) under different ultrasonic times (0, 1, 5, 10 min) and power input of 500 W. During sonication, a 6 mm diameter titanium probe with amplitude of 220 μm was inserted into the middle of liquid, and an ice bath was necessary to maintain low temperature during the whole ultrasonication process.
Characterization of GEON 2.2.1
Particle size, PdI and zeta potential analysis The particle size and PdI value of GEON were analyzed by Zetasizer Nano ZS laser diffractometer (Austria Anton Pa Co., ltd.) [20] . GEON was diluted to a ratio of 1:100 with deionized water before measurement to avoid multiple scattering influences. The zeta potential of GEON was also determined using the mentioned sample dilution ratio and apparatus. Duplicate samples were measured in triplicate to ensure the repeatability of the analysis.
Morphologic observation
The morphology of GEON was observed using the optical microscope and laser scanning confocal microscopy (LSCM) (LSM 800, Carl Zeiss, Germany), respectively. For optical microscope observation, 10 µL of prepared GEON was added on a clean glass slide, covered with a coverslip and then observed at a 100 × oil immersion lens. As for LSCM analysis, Nile red fluorescence dye was used to stain the oil phase of GEON. In brief, 0.1 % Nile red solution and GEON were mixed (1:25, v/v) and incubated at 4℃ for 20 min, shielding from light. Then 10 µL of stained GEON was placed on a glass slide, covered with a coverslip, and detected by LSCM at excitation/emission wavelengths of 543/598 nm.
Show full methods section
Preparation of GEON
GEO was purchased from Anhui Kaibo Biological Technology Co., ltd (China). It was extracted from the garlic bulb using the steam distillation method. For coarse emulsion preparation, GEO, surfactant (Tween 80) and distilled water (weight ratio of 10:1:89) were mixed and homogenized at 18000 rpm for 120 s using a high-speed homogenizer (FA25; Shanghai Fluke Fluid Machinery Manufacturing, China) [15] . As for GEON preparation, the resulting coarse emulsion was further emulsified using a 20 kHz ultrasonic facility (SCIENTZ-ⅡD, Ningbo Xinzhi Biotechnology, China) under different ultrasonic times (0, 1, 5, 10 min) and power input of 500 W. During sonication, a 6 mm diameter titanium probe with amplitude of 220 μm was inserted into the middle of liquid, and an ice bath was necessary to maintain low temperature during the whole ultrasonication process.
Characterization of GEON 2.2.1
Particle size, PdI and zeta potential analysis The particle size and PdI value of GEON were analyzed by Zetasizer Nano ZS laser diffractometer (Austria Anton Pa Co., ltd.) [20] . GEON was diluted to a ratio of 1:100 with deionized water before measurement to avoid multiple scattering influences. The zeta potential of GEON was also determined using the mentioned sample dilution ratio and apparatus. Duplicate samples were measured in triplicate to ensure the repeatability of the analysis.
Morphologic observation
The morphology of GEON was observed using the optical microscope and laser scanning confocal microscopy (LSCM) (LSM 800, Carl Zeiss, Germany), respectively. For optical microscope observation, 10 µL of prepared GEON was added on a clean glass slide, covered with a coverslip and then observed at a 100 × oil immersion lens. As for LSCM analysis, Nile red fluorescence dye was used to stain the oil phase of GEON. In brief, 0.1 % Nile red solution and GEON were mixed (1:25, v/v) and incubated at 4℃ for 20 min, shielding from light. Then 10 µL of stained GEON was placed on a glass slide, covered with a coverslip, and detected by LSCM at excitation/emission wavelengths of 543/598 nm.
Stability analysis of GEON 2.3.1
Storage stability All GEONs were added into tightly sealed glass tubes and stored for 30 d at 25 ± 4℃. The droplet size and visual observations were monitored at storage times of 0, 10, 20 and 30 d. Any oil layer at the bottom of the samples was considered physical instability.
Application stability
GEON with good storage stability was further analyzed for its application stability according to the method of Zhang et al. [21] with some modifications. GEON was treated under different temperatures (20, 40, 60, 80, 100℃), different ions (0–1.0 mol/L NaCl and 0–0.08 mol/L MgCl 2 ) and glucose (0–14 %, weight/volume) solutions, and then measured for the change of droplet size using Zetasizer Nano ZS laser diffractometer. 2.4 anti-MRSA activity analysis of GEON 2.4.1 Inhibition zone determination The antimicrobial activity of GEON against foodborne MRSA was firstly tested using the agar diffusion method. MRSA P -1 isolated from retailed pork was used as tested bacteria. As reported previously [22] , MRSA P -1 had strong resistance to β-lactams antibiotics, as the MICs of penicillin and ampicillin were 1024 and 128 μg/mL, respectively. It was also insensitive to erythrocin, terramycin, acheomycin and ciprofloxacin, and the MICs were 128, 128, 32, 8 μg/mL, respectively. The inhibition zone on the solid media was measured to evaluate the anti-MRSA activity of GEON. The circular filter paper at 6 mm in diameter was sterilized and placed on a tryptone soya agar (TSA) containing 50 µL MRSA P -1, whose cell concentration was approximately 10 8 CFU/mL (OD 600 nm = 0.5). Afterwards, 15 µL of GEONs and 1 % Tween 80 (negative control) were added scrupulously onto the filter paper. Meanwhile, 1.5 µL of pure GEO and 13.5 µL of sterilized water were added together as control, as the proportion of GEO in the GEON was 10 %. The inhibition zones of the above agents were measured after the plates were incubated at 37℃ for 24 h.
Minimum inhibitory concentration
(MIC) determination The MIC of GEON was investigated using the agar dilution assay. Briefly, melted TSA, GEON (or 1 % Tween solution) were aseptically transferred into 24 well plates and gently mixed. The final concentrations of GEON were 0, 3.725, 6.25 12.5, 25, 50, 100 mg/mL (0–10.0 %), namely, the final GEO concentrations were 0, 0.3725, 0.625 1.25, 2.5, 5, 10 mg/mL (0–1.0 %), respectively. When cooling, the medium was spotted with 3 μL (approximately 3 × 10 5 CFU) of logarithmic phase bacterium and then cultured in a bacteriological incubator (37℃, 24 h). The MIC was defined as the lowest GENO concentration that inhibited the visual growth of MRSA P -1.
Bactericidal ability analysis
The bactericidal assay was carried out to compare the anti-MRSA activity of four GEONs. MRSA P -1 at the logarithmic phase was adjusted at OD 600 nm = 0.5 (approximately 1 × 10 8 CFU/mL). GEONs were added into bacterium suspension to final concentrations of 1MIC and 2MIC. Then the viable cells were measured at 2 and 4 h using the colony counting method.
2.5 anti-MRSA mechanism of GEON 2.5.1 Growth curves analysis
Growth curves of MRSA P -1 under GEON treatment was analyzed based on the methodology of Liu et al. [22] with slight modification. GEON with good stability and effective anti-MRSA activity and 1 % Tween solution (negative control) were added to fresh tryptone soy broth (TSB) to final concentrations of 0-1MIC of GEON. Logarithmic phase MRSA P -1 was adjusted to OD 600 nm = 0.5 (10 8 CFU/mL) and then inoculated (3 % bacterial load) into the prepared TSB mentioned above. Then samples were cultured at 37℃ and monitored at 600 nm for 24 h by a UV spectrophotometer (UV-2600, Shimadzu, Japan). Membrane potential analysis DiBAC 4 (3) (Molecular Probes, Sigma), a membrane potential-sensitive fluorescent probe, was used for membrane potential determination [22] . MRSA P -1 cells were cultured to the logarithmic phase and harvested by centrifugation, and then the precipitates were washed and adjusted to OD 600 nm = 0.5. DiBAC 4 (3) solution was added to the cell suspensions and the final concentration was 0.1 µM. After 30 min incubation, the mixtures were added with GEON (final concentrations of 0, 1/2MIC, 1MIC, 2MIC, 4MIC) and placed at dark for 3 h. the fluorescence of each sample was determined using a fluorescence microplate reader (Thermo Scientific, Germany) at excitation/emission wavelengths of 492/515 nm.
Extracellular nucleic acids and protein determination
The nucleic acids and protein released from MRSA P -1 treated with GEON were analyzed according to Moghimi et al. [13] . Logarithmic P -1 cells were treated with different final concentrations of GEON (0, 1/2MIC, 1MIC, 2MIC, 4MIC) for 1 and 3 h. The mixture was centrifuged and the supernate was collected for analysis. The released nucleic acids and protein were determined at 260 and 280 nm, respectively, using a spectrophotometer. For protein determination, the amount of protein released from MRSA P -1 cells treated by GEON for 3 h was quantitatively analyzed using BCA protein quantitation kit (Sangon Biotech, Co., ltd.) [23] . Moreover, SDS-PAGE was performed to detect the residual soluble protein in P -1 cells. After being treated by GEON for 3 h, cells were centrifugally collected and resuspended with saline solution, followed by 5 min ultrasound pyrolysis in an ice water bath. The supernate containing the residual intracellular soluble protein was obtained through high-speed centrifugation. The concentration of stacking and separating gel used for SDS-PAGE were 12 % and 4 %, and the electrophoresis parameters were 80 V 40 min and 120 V 1 h, respectively.
Membrane integrity determination
Laser scanning confocal microscopy and fluorescent dyes of SYTO9 and propidium iodide (PI) (LIVE/DEAD @ BacLight™ Bacterial Viability Kit, Eugene, OR) were used to observe the bacterial membrane integrity alteration of P -1 after GEON treatment. SYTO9 can stain all bacteria cells and glows green fluorescent, while PI only can enter bacteria through destroyed membrane, and glows red fluorescent by binding to intracellular nucleic acid. Therefore, bacteria with intact or damaged membrane will be stained as green and red fluorescent, respectively. Logarithmic P -1 cells (OD 600 nm = 0.5) were incubated with GEON (0, 1MIC, 2MIC, 4MIC) for 3 h, and then harvested by centrifugation. Cells (100 µL) were mixed with working dye solution (100 µL) and observed by LSCM after 15 min incubation.
Scanning electron microscopy
(SEM) observation The morphology change of MRSA cells was detected by SEM (FEI Verios 460, FEI, USA). In brief, logarithmic P -1 cells (OD 600 nm = 0.5) were incubated with GEONs (0, 1MIC, 2MIC, 4MIC) for 3 h, and then centrifuged to obtain the cell pellet. After washing twice, the cell pellet was fixed with 2.5 % glutaraldehyde solution at 4℃ for 12 h. Then cells were centrifuged and dehydrated with serious water-alcohol solutions and isoamyl acetate. Afterwards, the treated cell samples were spotted onto tinfoil paper and pasted to the SEM support, sputter-coated with gold under vacuum for observing and photographing by SEM.
Statistical analyses
All results were conducted at least in triplicate and the differences of results were analyzed at p < 0.05 and p < 0.01 significance levels using SPSS 21.0 (SPSS Inc., Chicago, IL, USA).
📊 Figures
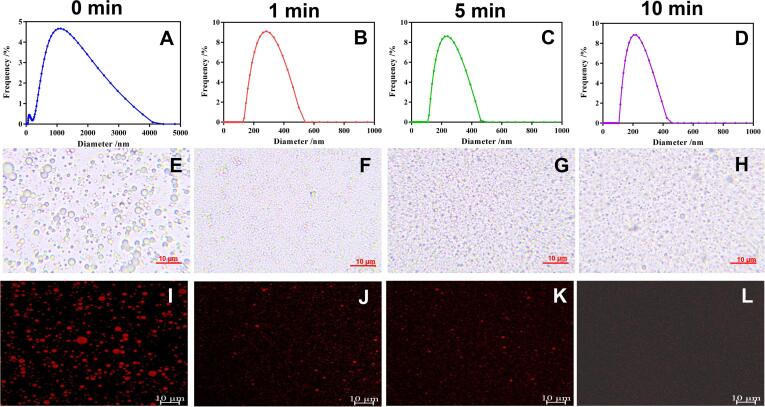
Fig. 1
Effect of ultrasonic time on the droplet size distribution and morphology of GEON. A-D, droplet distribution of crude emulsion (0u00a0min) and GEON prepared under different ultrasonic time (1, 5,10u00...
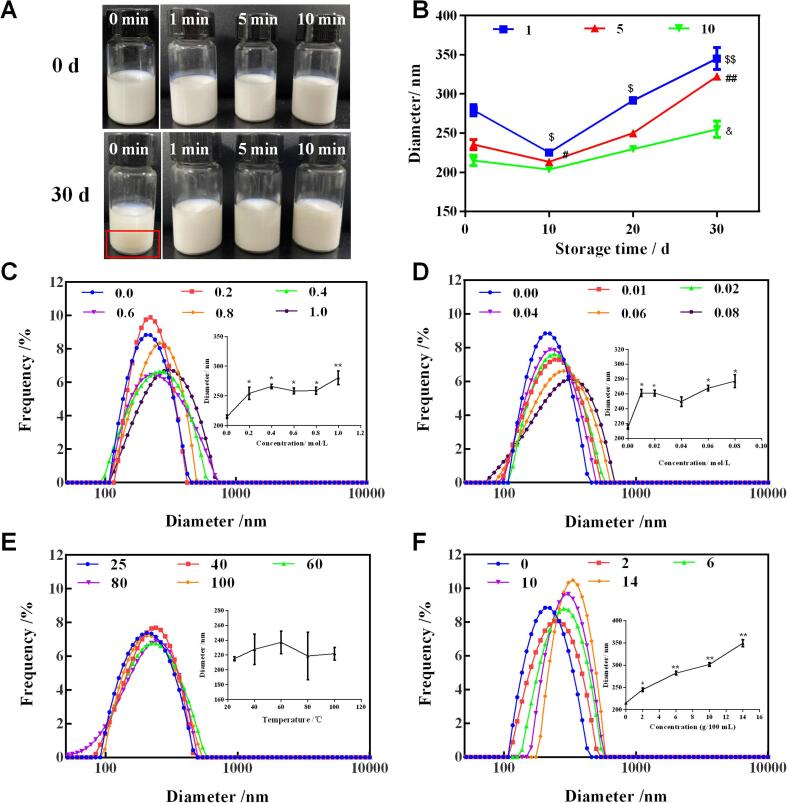
Fig. 2
Storage stability and environmental stability of GEON. A-B, storage stability. $, # and &, p <u00a00.05; $$ and ##, p <u00a00.01. C-F, effect of NaCl, MgCl 2 , temperature and glucose on GEON st...
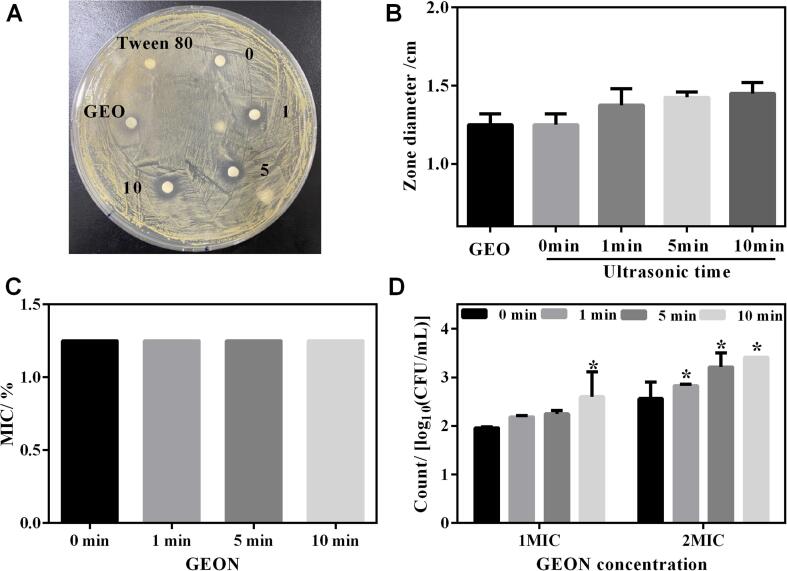
Fig. 3
anti-MRSA activity of GEON. A-B, inhibition zone of GEON against MRSA P -1; C, MIC of GEON against MRSA P -1; D, bactericidal ability of GEON at 4u00a0h. *, p <u00a00.05.
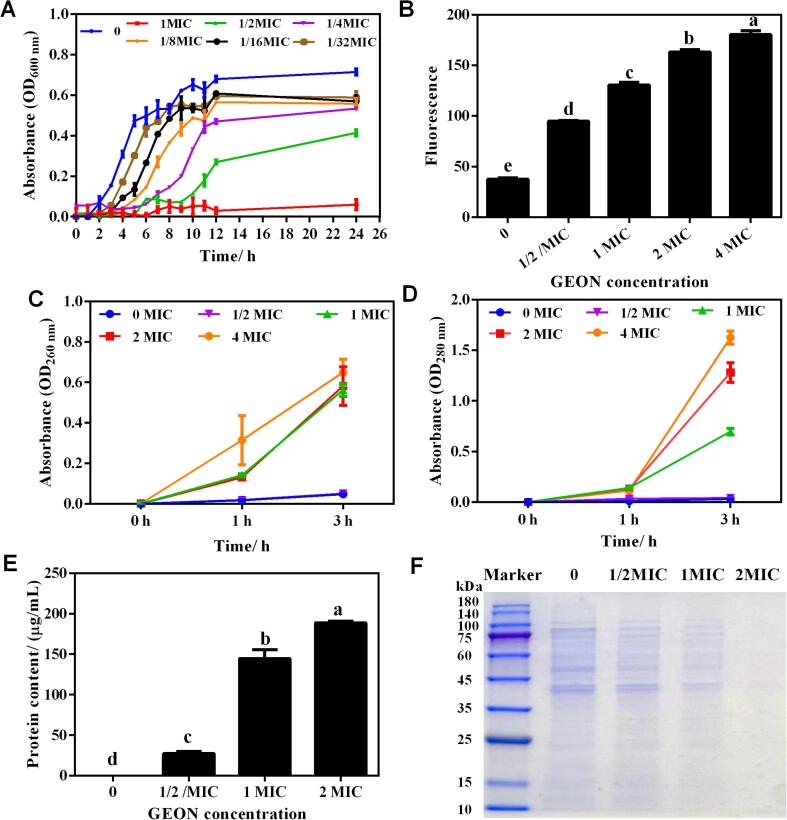
Fig. 4
Effect of GEON (10u00a0min) on MRSA P -1 growth and cellular components.A, growth curve of P -1 cultured in TSB with different concentration of GEON. B, cell membrane potential. C-D, extracellular DNA...
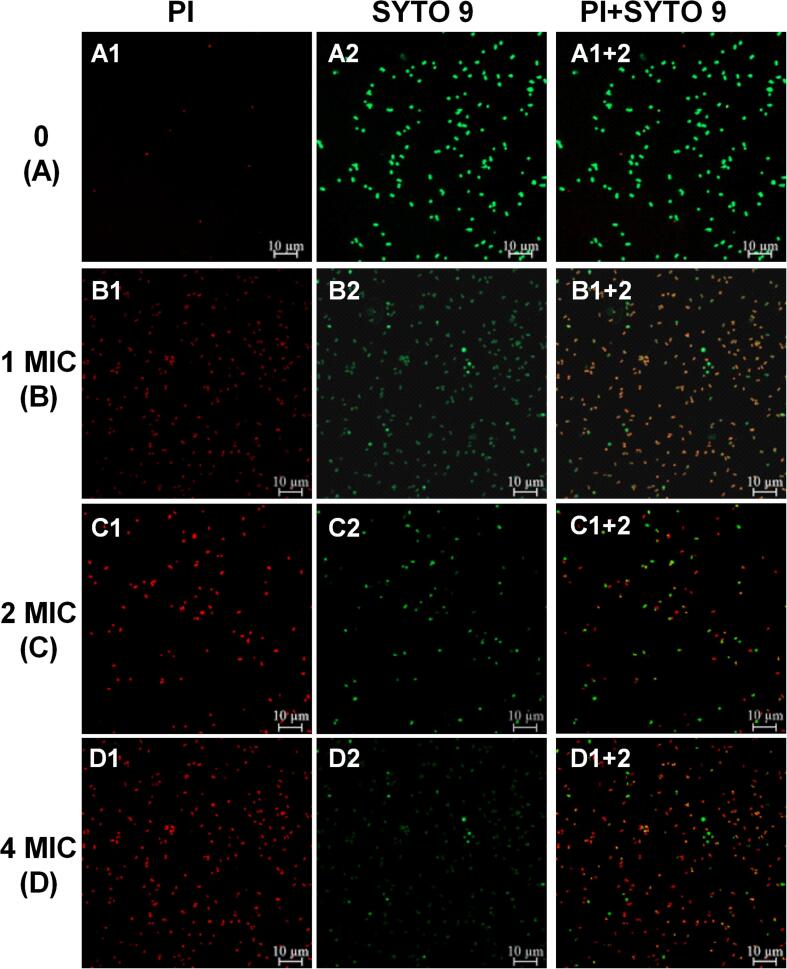
Fig. 5
LSCM photographs of MRSA P -1 cells.A, control. B-D, MRSA cells treated by 1 MIC, 2MIC and 4MIC GEON (10u00a0min), respectively.
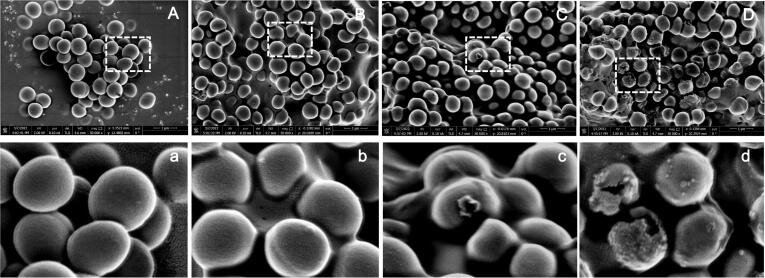
Fig. 6
SEM photographs of MRSA P -1 cells. A and a, control. B and b, C and c, D and d, MRSA cells treated by 1 MIC, 2MIC and 4MIC GEON (10u00a0min), respectively.
Figure images are served from the NIH/NLM PubMed Central Open Access Subset or Europe PMC; copyright remains with the publishers and authors.
💬 Discussion
0 commentsNo comments yet. Be the first to start a discussion!
Leave a Comment