Abstract
Using FM4-64 to label endosomes and Abp1p-GFP or Sac6p-GFP to label actin patches, we find that (1) endosomes colocalize with actin patches as they assemble at the bud cortex; (2) endosomes colocalize with actin patches as they undergo linear, retrograde movement from buds toward mother cells; and (3) actin patches interact with and disassemble at FM4-64-labeled internal compartments. We also show that retrograde flow of actin cables mediates retrograde actin patch movement. An Arp2/3 complex mutation decreases the frequency of cortical, nonlinear actin patch movements, but has no effect on the velocity of linear, retrograde actin patch movement. Rather, linear actin patch movement occurs at the same velocity and direction as the movement of actin cables. Moreover, actin patches require actin cables for retrograde movements and colocalize with actin cables as they undergo retrograde movement. Our studies support a mechanism whereby actin cables serve as "conveyor belts" for retrograde movement and delivery of actin patches/endosomes to FM4-64-labeled internal compartments.
🔬 Techniques
🧬 Organisms
💻 Software
✨ Fluorophores
🧪 Sample Preparation
🔬 Cell Lines
🏭 Microscope Brands
🧪 Reagent Suppliers
📷 Detectors
🔎 Objectives
💻 Software Details
💾 Data Repositories
🏛️ Research Organizations (ROR)
Affiliated research institutions:
📋 Methods
Yeast strains and fluorescent protein tagging
Yeast strains used in this work are listed in Table II Table II. Strains used in this work Strain Genotype Source BY4741 MAT a his3 Δ 1 leu2 Δ 0 met15 Δ 0 ura3 Δ 0 Research Genetics YCY027 MAT a his3 Δ 1 leu2 Δ 0 met15 Δ 0 ura3 Δ 0 ABP140:GFP:KanMX6 This work YCY031 MAT a his3 Δ 1 leu2 Δ 0 met15 Δ 0 ura3 Δ 0 ABP140:GFP:KanMX6 ABP1:HcRed:HIS3 This work Y4133 MATα his3 Δ 1 leu2 Δ 0 lys2 Δ 0 ura3 Δ 0 bni1-11::URA3 bnr1 Δ ::KanMX6 Evangelista et al., 2002 AGY001 MATα his3 Δ 1 leu2 Δ 0 lys2 Δ 0 ura3 Δ 0 bni1-11::URA3 bnr1 Δ ::KanMX6 ABP1:HcRed:HIS3 This work THY150 MAT a his3 Δ 1 leu2 Δ 0 met15 Δ 0 ura3 Δ 0 ABP1:HcRed:HIS3 This work THY157 MAT a his3 Δ 1 leu2 Δ 0 met15 Δ 0 ura3 Δ 0 ABP1:GFP:KanMX6 This work THY166 MAT a his3 Δ 1 leu2 Δ 0 met15 Δ 0 ura3 Δ 0 SAC6:GFP:HIS3 abp1 Δ ::KanMX6 This work THY168 MAT a his3 Δ 1 leu2 Δ 0 met15 Δ 0 ura3 Δ 0 SAC6:GFP:HIS3 This work THY169 MAT a his3 Δ 1 leu2 Δ 0 met15 Δ 0 ura3 Δ 0 ABP1:GFP:KanMX6 SAC6:HcRed:HIS3 This work YMW81 MAT a ade2-101 his3 Δ 200 leu2 Δ 1 lys2-801 trp1 Δ 63 ura3-52 arp2-1 Moreau et al., 1997 THY170 MAT a ade2-101 his3 Δ 200 leu2 Δ 1 lys2-801 trp1 Δ 63 ura3-52 arp2-1 ABP1:GFP:HIS3 This work . Yeast cell growth and manipulations were performed according to Sherman (2002) . To visualize actin cables in living cells, the COOH terminus of Abp140p was tagged with GFP(S65T) using PCR-based insertion of the GFP gene into the chromosomal copy of ABP140 as described previously ( Yang and Pon, 2002 ). To visualize actin patches in living cells, the COOH terminus of Abp1p was tagged with either GFP(S65T) or HcRed using PCR-based insertion of the gene into the chromosomal copy of ABP1 . For GFP and HcRed, the plasmids pFA6a-GFP(S65T)-kanMX6 ( Longtine et al., 1998 ) and pCY17, respectively, were amplified with the primers ABP1f1 (5′- AAAAGGTCTCTTCCCCAGCAATTATGTGTCTTTGGGCAAC CGGATCCCCGGGTTAAT-TAA-3′) and ABP1r1 (3′- ACGTAAGAATAATATAATAGCATGACGCTGACGTGTGATT GAATTCGAGCTCGTTTAAAC-3′), where the underlined sequences correspond to the sequences flanking the stop codon of ABP1 . Likewise, we tagged the chromosomal copy of SAC6 with GFP and HcRed in the same manner using the primers SAC6f1 (5′- AATTATTACTTTTATCGCTTCGTTAATGACTTTGAACAAA CGGATCCCCGGGTTAATTAA-3′) and SAC6r1 (5′- AAGCTGAGTAGAAAACAGGTTACGAAAGTTGTTTGTTGGC GAATTCGAGCTCGTTTAAAC-3′), where the underlined sequences correspond to the sequences flanking the stop codon of SAC6. To construct pCY17, the HcRed gene from pHcRed1 (CLONTECH Laboratories, Inc.) was amplified with primers containing the cut sites for PacI and AscI, digested, and ligated into the corresponding sites in pFA6a-GFP(S65T)-HIS3MX6, functionally replacing the GFP(S65T) gene with HcRed. Yeast cells were transformed with PCR products using the lithium acetate method ( Gietz et al., 1995 ). Transformants, which were positive for integration at the target locus, were validated by PCR, and the tagged constructs were visualized in cells by fluorescence microscopy (see below). The tags had no obvious effect on cell growth, actin organization, or function.
Show full methods section
Yeast strains and fluorescent protein tagging
Yeast strains used in this work are listed in Table II Table II. Strains used in this work Strain Genotype Source BY4741 MAT a his3 Δ 1 leu2 Δ 0 met15 Δ 0 ura3 Δ 0 Research Genetics YCY027 MAT a his3 Δ 1 leu2 Δ 0 met15 Δ 0 ura3 Δ 0 ABP140:GFP:KanMX6 This work YCY031 MAT a his3 Δ 1 leu2 Δ 0 met15 Δ 0 ura3 Δ 0 ABP140:GFP:KanMX6 ABP1:HcRed:HIS3 This work Y4133 MATα his3 Δ 1 leu2 Δ 0 lys2 Δ 0 ura3 Δ 0 bni1-11::URA3 bnr1 Δ ::KanMX6 Evangelista et al., 2002 AGY001 MATα his3 Δ 1 leu2 Δ 0 lys2 Δ 0 ura3 Δ 0 bni1-11::URA3 bnr1 Δ ::KanMX6 ABP1:HcRed:HIS3 This work THY150 MAT a his3 Δ 1 leu2 Δ 0 met15 Δ 0 ura3 Δ 0 ABP1:HcRed:HIS3 This work THY157 MAT a his3 Δ 1 leu2 Δ 0 met15 Δ 0 ura3 Δ 0 ABP1:GFP:KanMX6 This work THY166 MAT a his3 Δ 1 leu2 Δ 0 met15 Δ 0 ura3 Δ 0 SAC6:GFP:HIS3 abp1 Δ ::KanMX6 This work THY168 MAT a his3 Δ 1 leu2 Δ 0 met15 Δ 0 ura3 Δ 0 SAC6:GFP:HIS3 This work THY169 MAT a his3 Δ 1 leu2 Δ 0 met15 Δ 0 ura3 Δ 0 ABP1:GFP:KanMX6 SAC6:HcRed:HIS3 This work YMW81 MAT a ade2-101 his3 Δ 200 leu2 Δ 1 lys2-801 trp1 Δ 63 ura3-52 arp2-1 Moreau et al., 1997 THY170 MAT a ade2-101 his3 Δ 200 leu2 Δ 1 lys2-801 trp1 Δ 63 ura3-52 arp2-1 ABP1:GFP:HIS3 This work . Yeast cell growth and manipulations were performed according to Sherman (2002) . To visualize actin cables in living cells, the COOH terminus of Abp140p was tagged with GFP(S65T) using PCR-based insertion of the GFP gene into the chromosomal copy of ABP140 as described previously ( Yang and Pon, 2002 ). To visualize actin patches in living cells, the COOH terminus of Abp1p was tagged with either GFP(S65T) or HcRed using PCR-based insertion of the gene into the chromosomal copy of ABP1 . For GFP and HcRed, the plasmids pFA6a-GFP(S65T)-kanMX6 ( Longtine et al., 1998 ) and pCY17, respectively, were amplified with the primers ABP1f1 (5′- AAAAGGTCTCTTCCCCAGCAATTATGTGTCTTTGGGCAAC CGGATCCCCGGGTTAAT-TAA-3′) and ABP1r1 (3′- ACGTAAGAATAATATAATAGCATGACGCTGACGTGTGATT GAATTCGAGCTCGTTTAAAC-3′), where the underlined sequences correspond to the sequences flanking the stop codon of ABP1 . Likewise, we tagged the chromosomal copy of SAC6 with GFP and HcRed in the same manner using the primers SAC6f1 (5′- AATTATTACTTTTATCGCTTCGTTAATGACTTTGAACAAA CGGATCCCCGGGTTAATTAA-3′) and SAC6r1 (5′- AAGCTGAGTAGAAAACAGGTTACGAAAGTTGTTTGTTGGC GAATTCGAGCTCGTTTAAAC-3′), where the underlined sequences correspond to the sequences flanking the stop codon of SAC6. To construct pCY17, the HcRed gene from pHcRed1 (CLONTECH Laboratories, Inc.) was amplified with primers containing the cut sites for PacI and AscI, digested, and ligated into the corresponding sites in pFA6a-GFP(S65T)-HIS3MX6, functionally replacing the GFP(S65T) gene with HcRed. Yeast cells were transformed with PCR products using the lithium acetate method ( Gietz et al., 1995 ). Transformants, which were positive for integration at the target locus, were validated by PCR, and the tagged constructs were visualized in cells by fluorescence microscopy (see below). The tags had no obvious effect on cell growth, actin organization, or function.
Microscopy and image analysis
For time-lapse fluorescence imaging, cells were grown in lactate medium as described previously ( Yang and Pon, 2002 ) until mid-log phase at 25°C. For labeling of endocytic vesicles and endosomal compartments, FM4-64 (Molecular Probes, Inc.) was added to cell cultures at a final concentration of 10 μM for variable amounts of time as described in the figure legends; cells were then washed twice with lactate medium. 3 μl of cell suspension was applied to a microscope slide and covered with a coverslip. Images were acquired using a microscope (model E600; Nikon) equipped with a Plan-Apo 100×/1.4 NA objective, a cooled charge-coupled device camera (Orca-ER; Hamamatsu), and a Dual-View image splitter (Optical Insights) for simultaneous two-color imaging. The temperature of the objective lens was controlled by an objective heater (Bioptechs). To acquire 3D images over time, optical sections were obtained at 0.4-μm steps via a piezoelectric focus motor mounted on the objective lens (Polytech PI). Images were collected and analyzed using Openlab 3.1.5 software (Improvision) and ImageJ 1.30, respectively. QuickTime movies were made from time-lapse images using Volocity 2.6 (Improvision). For determination of the velocity of actin patches and elongating actin cables, the fluorescent movements of actin patches or fiduciary marks on elongating cables were measured as a function of time, as described previously ( Smith et al., 2001 ; Yang and Pon, 2002 ). Online supplemental material Wild-type haploid cells expressing Abp1p-HcRed and Abp140p-GFP from the chromosomal loci were grown to mid-log phase in lactate medium at RT. 3 μl of cell suspension was applied to a microscope slide and covered with a coverslip. Images were acquired using a microscope (model E600; Nikon) equipped with a Plan-Apo 100×/1.4 NA objective, a cooled charge-coupled device camera (Orca-ER; Hamamatsu), and a Dual-View image splitter (Optical Insights) for simultaneous two-color imaging. Images were collected and analyzed using Openlab 3.1.5 software (Improvision) and ImageJ 1.30, respectively. QuickTime movies were made from time-lapse images using Volocity 2.6 (Improvision). Online supplemental material available at http://www.jcb.org/cgi/content/full/jcb.200404173/DC1 .
Online supplemental material Wild-type haploid cells expressing Abp1p-HcRed and Abp140p-GFP from the chromosomal loci were grown to mid-log phase in lactate medium at RT. 3 μl of cell suspension was applied to a microscope slide and covered with a coverslip. Images were acquired using a microscope (model E600; Nikon) equipped with a Plan-Apo 100×/1.4 NA objective, a cooled charge-coupled device camera (Orca-ER; Hamamatsu), and a Dual-View image splitter (Optical Insights) for simultaneous two-color imaging. Images were collected and analyzed using Openlab 3.1.5 software (Improvision) and ImageJ 1.30, respectively. QuickTime movies were made from time-lapse images using Volocity 2.6 (Improvision). Online supplemental material available at http://www.jcb.org/cgi/content/full/jcb.200404173/DC1 .
📊 Figures
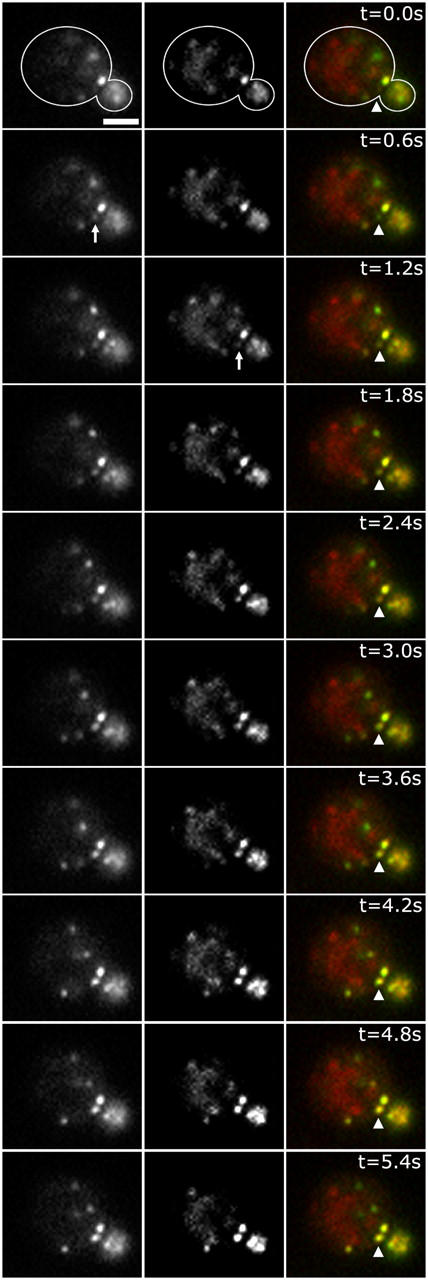
Figure 1.
FM4-64 and Abp1p-GFP assemble at the same punctate structures in living yeast. Mid-log phase wild-type haploid cells expressing Abp1p-GFP from the chromosomal locus were incubated with FM4-64 for 30 s...
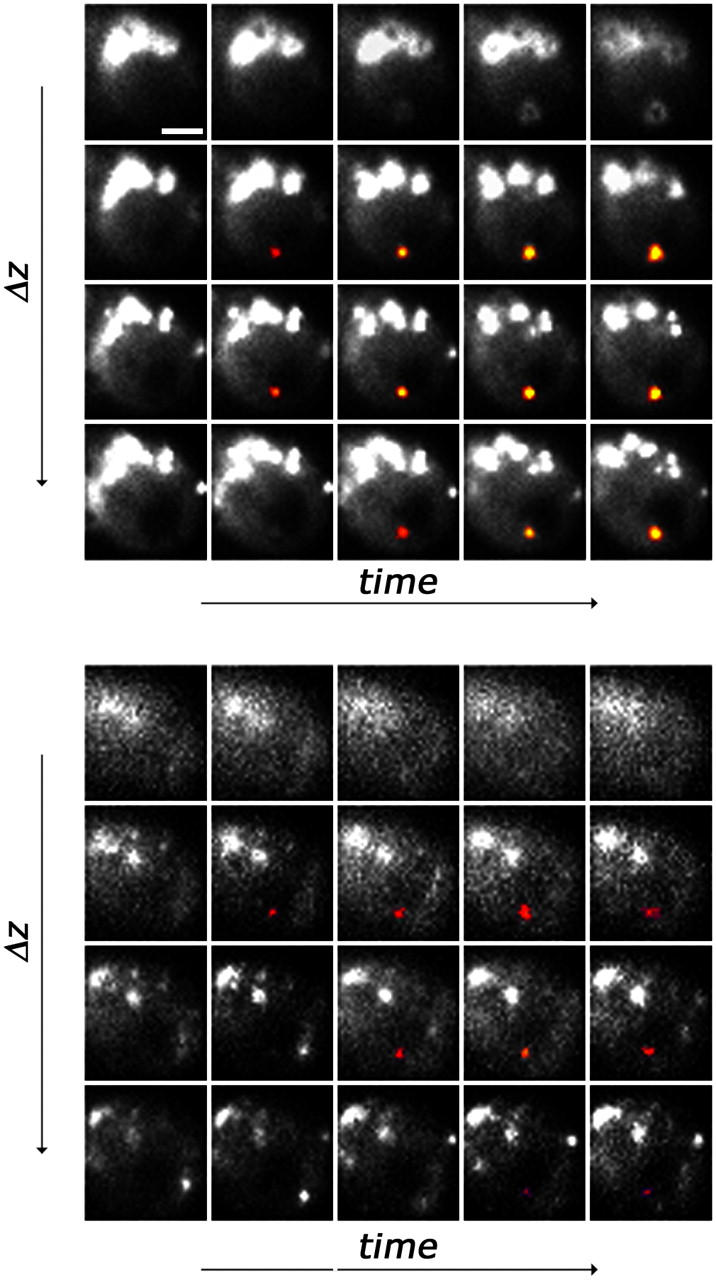
Figure 2.
Visualization of the assembly of FM4-64 and Abp1p-GFP by 3D reconstruction combined with time-lapse imaging. Mid-log phase wild-type haploid cells expressing Abp1p-GFP from their chromosomal locus wer...
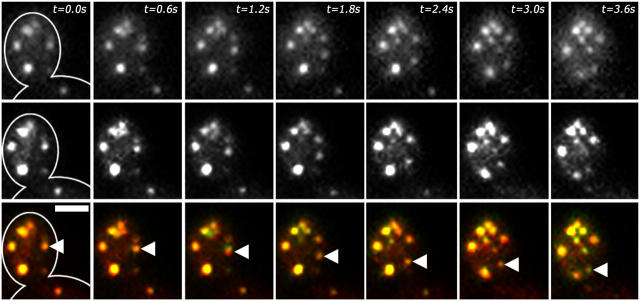
Figure 3.
Particles labeled with FM4-64 and Abp1p-GFP exhibit linear, retrograde movement. Mid-log phase wild-type haploid cells expressing Abp1p-GFP from the chromosomal locus were incubated with FM4-64 for 1 ...
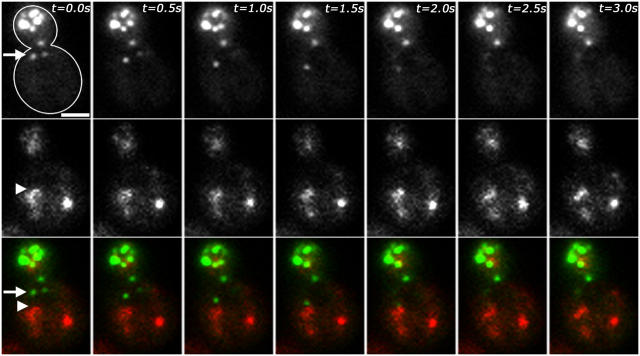
Figure 4.
Abp1p-GFP disassembles after actin patches interact with FM4-64u2013labeled internal compartments. Mid-log phase wild-type haploid cells expressing Abp1p-GFP from the chromosomal locus were stained wi...
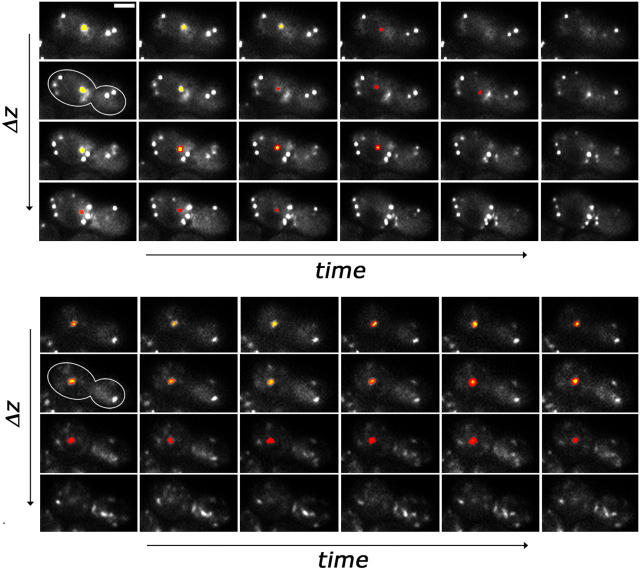
Figure 5.
Visualization of the disassembly of Abp1p-GFP at FM4-64u2013labeled internal compartments by 3D reconstruction combined with time-lapse imaging. Mid-log phase wild-type haploid cells expressing Abp1p-...
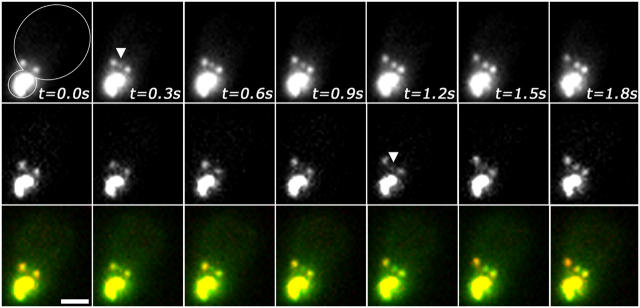
Figure 6.
Abp1p-GFP and Sac6p-HcRed assemble at the same punctate structures in living yeast. Wild-type haploid cells expressing Abp1p-GFP and Sac6p-HcRed from the chromosomal loci were grown to mid-log phase i...
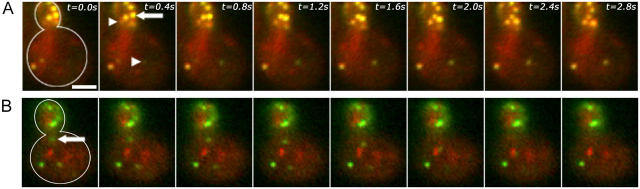
Figure 7.
Assembly, movement, and disassembly of Sac6p-GFP. Mid-log phase wild-type haploid cells expressing Sac6p-GFP from the chromosomal locus. FM4-64 staining to detect endosomes in A was performed as descr...
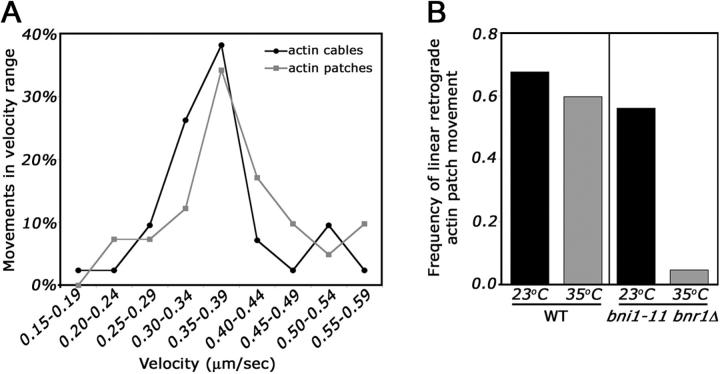
Figure 8.
Retrograde movement of actin patches occurs with the same velocity as retrograde actin cable movement and requires actin cables. (A) The velocity of actin cable and patch movement. Wild-type cells exp...
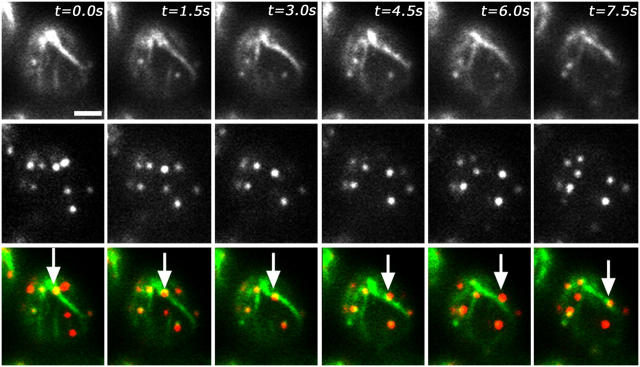
Figure 9.
Colocalization of actin patches and actin cables during retrograde movement. Wild-type haploid cells expressing Abp1p-HcRed and Abp140p-GFP from the chromosomal loci were grown to mid-log phase in lac...
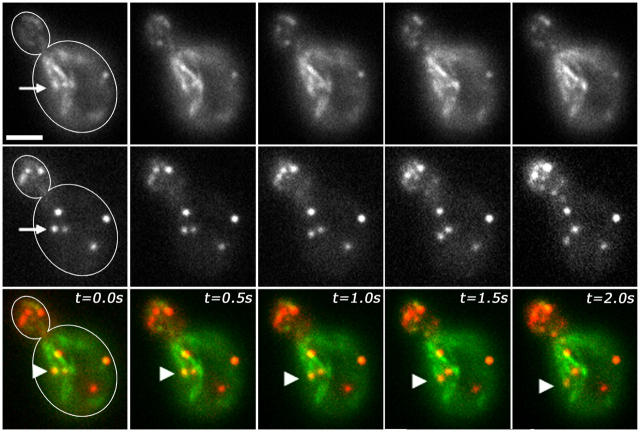
Figure 10.
An actin patch undergoing retrograde movement remains associated with an elongating actin cable at a fixed point. Mid-log phase yeast expressing Abp1p-HcRed and Abp140p-GFP were studied using simultan...
Figure images are served from the NIH/NLM PubMed Central Open Access Subset or Europe PMC; copyright remains with the publishers and authors.
💬 Discussion
0 commentsNo comments yet. Be the first to start a discussion!
Leave a Comment