Abstract
BACKGROUND: The aim of the study was to develop a virtual microscopy enabled method for assessment of Ki-67 expression and to study the prognostic value of the automated analysis in a comprehensive series of patients with breast cancer. METHODS: Using a previously reported virtual microscopy platform and an open source image processing tool, ImageJ, a method for assessment of immunohistochemically (IHC) stained area and intensity was created. A tissue microarray (TMA) series of breast cancer specimens from 1931 patients was immunostained for Ki-67, digitized with a whole slide scanner and uploaded to an image web server. The extent of Ki-67 staining in the tumour specimens was assessed both visually and with the image analysis algorithm. The prognostic value of the computer vision assessment of Ki-67 was evaluated by comparison of distant disease-free survival in patients with low, moderate or high expression of the protein. RESULTS: 1648 evaluable image files from 1334 patients were analysed in less than two hours. Visual and automated Ki-67 extent of staining assessments showed a percentage agreement of 87% and weighted kappa value of 0.57. The hazard ratio for distant recurrence for patients with a computer determined moderate Ki-67 extent of staining was 1.77 (95% CI 1.31-2.37) and for high extent 2.34 (95% CI 1.76-3.10), compared to patients with a low extent. In multivariate survival analyses, automated assessment of Ki-67 extent of staining was retained as a significant prognostic factor. CONCLUSIONS: Running high-throughput automated IHC algorithms on a virtual microscopy platform is feasible. Comparison of visual and automated assessments of Ki-67 expression shows moderate agreement. In multivariate survival analysis, the automated assessment of Ki-67 extent of staining is a significant and independent predictor of outcome in breast cancer.
🔬 Techniques
💻 Software
🧪 Sample Preparation
🏭 Microscope Brands
💻 Software Details
🏛️ Research Organizations (ROR)
Affiliated research institutions:
📋 Methods
Using a previously reported virtual microscopy platform and an open source image processing tool, ImageJ, a method for assessment of immunohistochemically (IHC) stained area and intensity was created. A tissue microarray (TMA) series of breast cancer specimens from 1931 patients was immunostained for Ki-67, digitized with a whole slide scanner and uploaded to an image web server. The extent of Ki-67 staining in the tumour specimens was assessed both visually and with the image analysis algorithm. The prognostic value of the computer vision assessment of Ki-67 was evaluated by comparison of distant disease-free survival in patients with low, moderate or high expression of the protein.
Methods Patients The FinProg series consist of 2842 breast cancer patients diagnosed during 1991 and 1992 within five geographical regions of Finland. The regions cover half of the population and the cases represent 53% of all breast cancers diagnosed in Finland during this period. Clinical data associated with subjects were extracted from the hospital case records, hospital registries, the Finnish Cancer Registry, and Statistics Finland. The data comprises more than 50 clinicopathological factors, including the histological type and grade of breast cancer, the number of metastatic and examined lymph nodes, primary tumour size, tumour ER and PR content evaluated by immunohistochemistry in the TMA samples, treatment details, and follow-up data. More than 50 pathologists performed histological typing and grading of cancer at the time of the diagnosis according to the World Health Organization guidelines. The median follow-up time of subjects included in the study was 9.5 years. Permission to use clinical data and formalin-fixed, paraffin-embedded tissues for research purposes was provided by the Ministry of Social Affairs and Health, Finland (permission 123/08/97). With reference to the large number of studied cases the authorities granted permission to use tissue samples without individual patient consent.
Show full methods section
Using a previously reported virtual microscopy platform and an open source image processing tool, ImageJ, a method for assessment of immunohistochemically (IHC) stained area and intensity was created. A tissue microarray (TMA) series of breast cancer specimens from 1931 patients was immunostained for Ki-67, digitized with a whole slide scanner and uploaded to an image web server. The extent of Ki-67 staining in the tumour specimens was assessed both visually and with the image analysis algorithm. The prognostic value of the computer vision assessment of Ki-67 was evaluated by comparison of distant disease-free survival in patients with low, moderate or high expression of the protein.
Methods Patients The FinProg series consist of 2842 breast cancer patients diagnosed during 1991 and 1992 within five geographical regions of Finland. The regions cover half of the population and the cases represent 53% of all breast cancers diagnosed in Finland during this period. Clinical data associated with subjects were extracted from the hospital case records, hospital registries, the Finnish Cancer Registry, and Statistics Finland. The data comprises more than 50 clinicopathological factors, including the histological type and grade of breast cancer, the number of metastatic and examined lymph nodes, primary tumour size, tumour ER and PR content evaluated by immunohistochemistry in the TMA samples, treatment details, and follow-up data. More than 50 pathologists performed histological typing and grading of cancer at the time of the diagnosis according to the World Health Organization guidelines. The median follow-up time of subjects included in the study was 9.5 years. Permission to use clinical data and formalin-fixed, paraffin-embedded tissues for research purposes was provided by the Ministry of Social Affairs and Health, Finland (permission 123/08/97). With reference to the large number of studied cases the authorities granted permission to use tissue samples without individual patient consent.
Exclusion criteria
Subjects diagnosed with ductal or lobular carcinoma in situ were excluded from the study before statistical analyses as well as those who had distant metastases at the time of the diagnosis, bilateral breast cancer, or other malignancy than breast cancer in history, except basal cell carcinoma or cervical carcinoma in situ. Since the risk of dying from these last mentioned two malignant diseases after diagnosis and proper treatment is exceedingly small, the possible confounding effect on the survival estimates was considered insignificant and not to require exclusion of the subjects. A subject was also excluded if no breast surgery was carried out. A single subject may have been excluded for one or more reasons. A consort diagram is provided in figure 1 . Figure 1 Consort diagram .
Preparation of tissue microarrays
Formalin-fixed, paraffin-embedded samples of the primary tumours (n = 1931) were collected and 1-4 tissue cores (core diameter 0.6 mm) from each patient assembled into tissue microarrays (TMAs, n = 23) as described elsewhere [ 24 ]. Sections of 5 μm were cut and processed for immunohistochemistry (IHC). Immunohistochemistry (IHC) Immunostaining for Ki-67 was done using a mouse monoclonal antibody MM-1 (Novocastra Laboratories; 1:1,000 dilution) as previously described [ 25 ]. An evaluable Ki-67 staining was available in 1334 (69,1%) of the 1931 eligible cases with tumour tissue available for analysis. The number of samples lost due to tissue processing or with non-representative tissue spots was 597. The extent of Ki-67 staining was assessed visually in 1292 of the cases by one of the researchers (HS) under supervision of a single pathologist (JI) as part of a previous study [ 25 ], counting the number of positive tumour cells and classified into negative, moderate and high expression with cut-off values at 0% and 20%. Immunostainings for ER, PR, HER1, HER2, TP53, cyclooxygenase-2, KIT, GATA-3 and CK 5/6 were also assessed as previously reported [ 25 ]. Molecular subtypes were defined as luminal A (ER+ and/or PR+, HER2-), luminal B (ER+ and/or PR+, HER2+), basal-like (ER-, PR-, HER2-, cytokeratin 5+, and/or HER1+), HER2+/ER- (ER-, PR-, and HER2+), and five-marker negative (negative for all markers) [ 25 ].
Sample digitization Twenty-three
TMA slides, with 2749 tissue spots including duplicates, triplicates and quadruplicates, were digitized with an automated whole-slide scanner (Mirax Scan, Zeiss, Göttingen, Germany), using a 20× objective and a DFW-X710 camera (Sony, Tokyo, Japan). The pixel resolution was 0.26 micrometers per pixel. The virtual slides were compressed to a wavelet file format (Enhanced Compressed Wavelet, ECW, ER Mapper, Erdas Inc, Atlanta, Georgia) with a conservative compression ratio of 1:5. Virtual microscopy platform The computer vision algorithm was integrated with a previously described virtual microscopy platform [ 23 , 26 ], which allows image analysis scripts to be run in a batch mode on the server hosting the virtual slides. The compressed virtual slides of the TMAs stained for Ki-67 analysis were uploaded to the web server equipped with 2 quad-core Intel Xeon processors and 16 GB of RAM. TMA spot locations on the virtual slides were defined by an annotation system in the virtual microscopy user interface and linked to the corresponding clinical data. Images of the TMA spots, 1634×1634 pixels in size, were extracted from the virtual slides as separate image files, exported into the computer vision algorithm, and stored on the server for later manual inspection and documentation purposes.
Computer vision algorithm
The computer vision algorithm (IhcJ) is depicted in figure 2 . It utilizes the macro language of an image processing and analysis software, ImageJ, which is open source and available free of charge for multiple operating systems at http://rsb.info.nih.gov/ij/ . The IhcJ algorithm first divides the acquired image of the IHC stained specimen in RGB colour space into separate colour channels by a colour deconvolution method [ 27 ]. The ImageJ plugin for colour deconvolution has a built in vector for separating haematoxylin (H) and diaminobenzidine (DAB) stainings. After colour deconvolution, H and DAB images are processed separately. By using five random test samples stained for Ki-67, suitable threshold levels for H and DAB were determined. These thresholds were used on both H and DAB images, respectively, and kept constant for the analysis of the main image dataset. Thresholding creates binary masks of H and DAB positive areas and the two areas may overlap. Binary masks were merged into a single result image. In the result image, the area of H-positive and DAB-negative pixels is pseudocoloured with green colour. The area of DAB-positive pixels regardless of H-status is pseudocoloured with red colour. The background, where both values are negative, is indicated with white colour. Figure 2 The IhcJ algorithm for automatic quantitative assessment of Ki-67 proliferation index . The extent of staining is calculated as the total number of DAB-positive pixels divided by the union of the total number of H-positive pixels and the total number of DAB-positive pixels. The intensity of staining is calculated from DAB-positive area, as a mean pixel value of original DAB image. The mean intensity value is scaled to range from 0 to 100 percent.
Statistical analysis
For statistical analyses, only the highest extent or intensity of Ki-67 staining was considered if multiple evaluable tissue cores were available for the same patient. Continuous Ki-67 extent and intensity values generated by the computer vision algorithm were grouped. There is no consensus for cut-off values in the literature, some studies use arbitrary values, some median and some divide data in tertiles [ 19 , 22 ]. In the current study we decided to split the patient series into three approximately equally sized groups according both to Ki-67 extent of staining tertiles and intensity tertiles. For evaluation of agreement between the visual and automated assessment of Ki-67 we also split the automated results into similar proportions of low, moderate and high expression as for the visual results. Frequency tables were analyzed using the chi-square test. The agreement between the visual and automated methods in the assessment of Ki-67 expression was estimated by percent-agreement and kappa-statistics. Since the categories of the variables are ordered as described before, a linearly weighted kappa value was used [ 28 ]. Life tables were calculated according to the Kaplan-Meier method. Distant disease-free survival was calculated from the date of the diagnosis to the date of detection of metastases outside of the locoregional area or to the date of death from breast cancer, if a patient died of breast cancer without distant metastases. Patients who died from an intercurrent disease were censored on the date of death. Survival curves were compared with the log-rank test. Multivariate survival analyses were done with the Cox proportional hazards model, entering the following covariates: automated assessment of Ki-67 extent of staining or visually assessed Ki-67 proliferation index, method of tumour detection, tumour size in centimetres, number of metastatic lymph nodes, histological grade, and age at diagnosis. The assumption of proportional hazards was ascertained by assessment of log minus log survival plots. All P values are two tailed.
📊 Figures
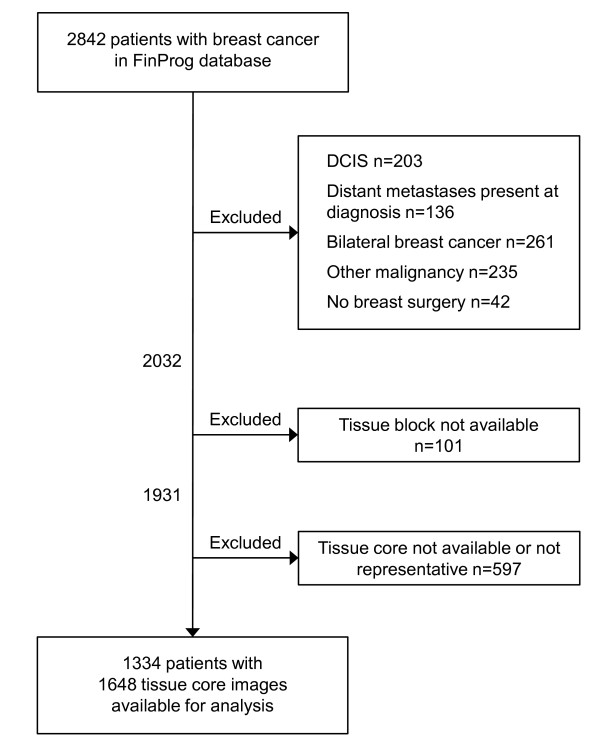
Figure 1
Consort diagram .
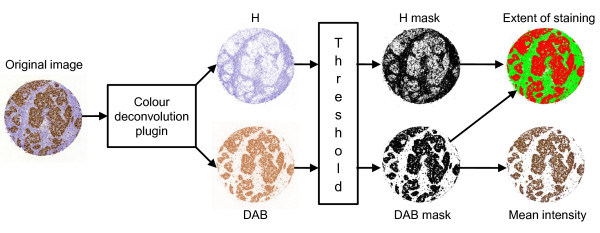
Figure 2
The IhcJ algorithm for automatic quantitative assessment of Ki-67 proliferation index .
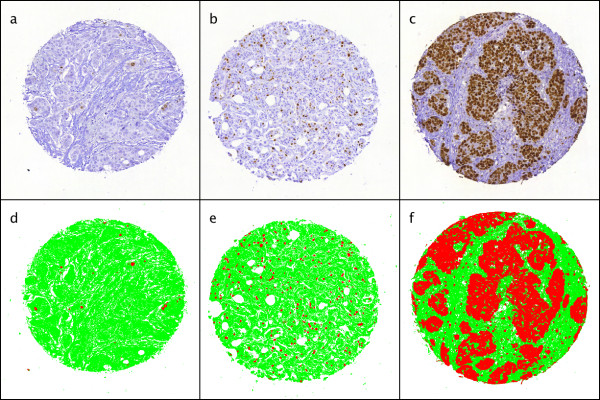
Figure 3
Sample images of variable area of Ki-67 staining in FinProg series . Low extent of staining (a), moderate extent of staining (b), high extent of staining (c), and corresponding result images from IhcJ...
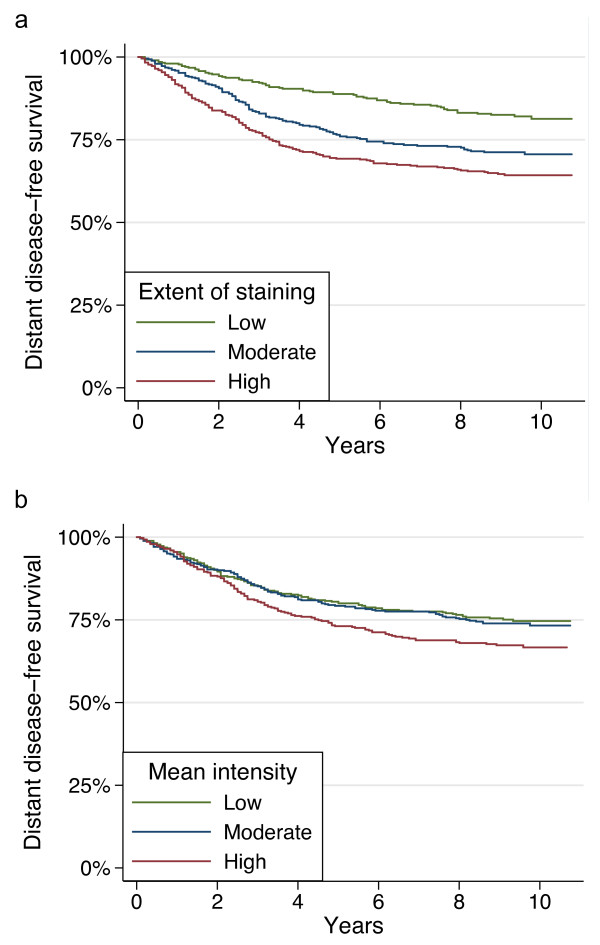
Figure 4
Distant disease-free survival (Kaplan-Meier curves, whole dataset) . by the grouped Ki-67 extent of stainings (a), and by the grouped Ki-67 staining intensities (b).
Figure images are served from the NIH/NLM PubMed Central Open Access Subset or Europe PMC; copyright remains with the publishers and authors.
💬 Discussion
0 commentsNo comments yet. Be the first to start a discussion!
Leave a Comment