Abstract
Formaldehyde (FA) is a major reactive carbonyl species (RCS) that is naturally produced in living systems through a diverse array of cellular pathways that span from epigenetic regulation to the metabolic processing of endogenous metabolites. At the same time, however, aberrant elevations in FA levels contribute to pathologies ranging from cancer and diabetes to heart, liver, and neurodegenerative diseases. Disentangling the complex interplay between FA physiology and pathology motivates the development of chemical tools that can enable the selective detection of this RCS in biological environments with spatial and temporal fidelity. We report the design, synthesis, and biological evaluation of ratiometric formaldehyde probe (RFAP) indicators for the excitation-ratiometric fluorescence imaging of formaldehyde production in living systems. RFAP-1 and RFAP-2 utilize FA-dependent aza-Cope reactivity to convert an alkylamine-functionalized coumarin platform into its aldehyde congener with a ca. 50 nm shift in the excitation wavelength. The probes exhibit visible excitation and emission profiles, and high selectivity for FA over a variety of RCS and related reactive biological analytes, including acetaldehyde, with up to a 6-fold change in the fluorescence ratio. The RFAP indicators can be used to monitor changes in FA levels in biological samples by live-cell imaging and/or flow cytometry. Moreover, RFAP-2 is capable of visualizing differences in the resting FA levels between wild-type cells and models with a gene knockout of ADH5, a major FA-metabolizing enzyme, establishing the utility of this ratiometric detection platform for identifying and probing sources of FA fluxes in biology.
🔬 Techniques
✨ Fluorophores
🧪 Sample Preparation
🔬 Cell Lines
🎨 Filters
🏛️ Research Organizations (ROR)
Affiliated research institutions:
📊 Figures

Scheme 1
Design of a ratiometric formaldehyde probe (RFAP) platform.
Scheme 2
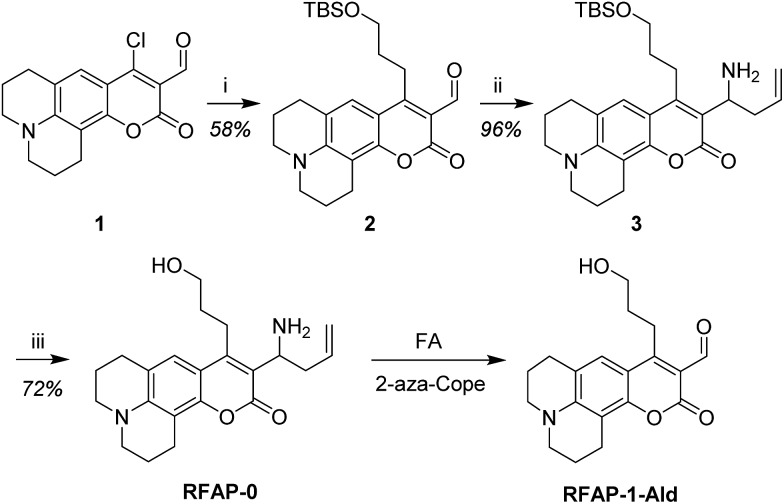
Synthesis of RFAP-0. Reagents and conditions: (i) lithium bis(3-(( tert -butyldimethylsilyl)oxy)propyl)copper, Et 2 O, THF, u201320 u00b0C, 3 h; (ii) NH 3 , MeOH, 0 u00b0C, then allylboronic acid pinacol ester, rt, 10 h; (iii) AcOH, H 2 O, rt, 14 h.
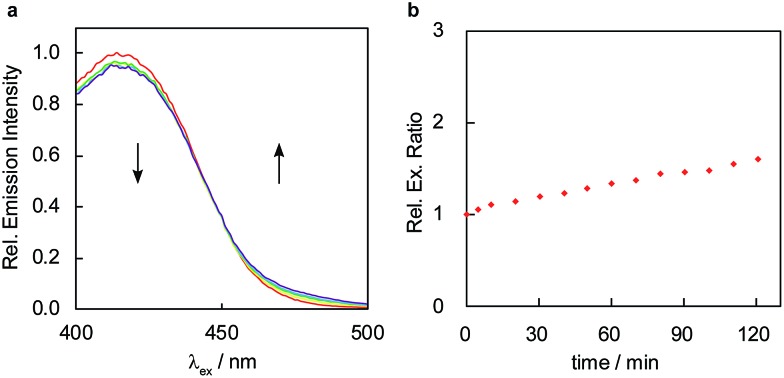
Fig. 1
FA response of RFAP-0. Data were acquired at 37 u00b0C in 20 mM PBS (pH 7.4). Excitation spectra were collected between 400 and 500 nm with emission monitored at u03bb em = 510 nm. (a) Excitation ratiometric response of 10 u03bcM RFAP-0 to 100 u03bcM FA. Excitation spectra are shown at 0, 30, 60, 90, and 120 min (red, yellow, green, blue, and purple traces, respectively) after the addition of FA. (b) Quantification of 470/420 nm excitation ratio over time.

Scheme 3
Installation of a geminal dimethyl group is designed to accelerate the 2-aza-Cope rearrangement and thermodynamically bias the reaction toward the desired product.
Scheme 4
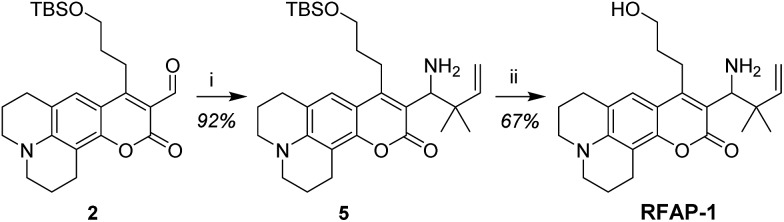
Synthesis of RFAP-1. Reagents and conditions: (i) NH 3 , MeOH, 0 u00b0C, then prenylboronic acid, rt, 10 h; (ii) AcOH, H 2 O, rt, 14 h.
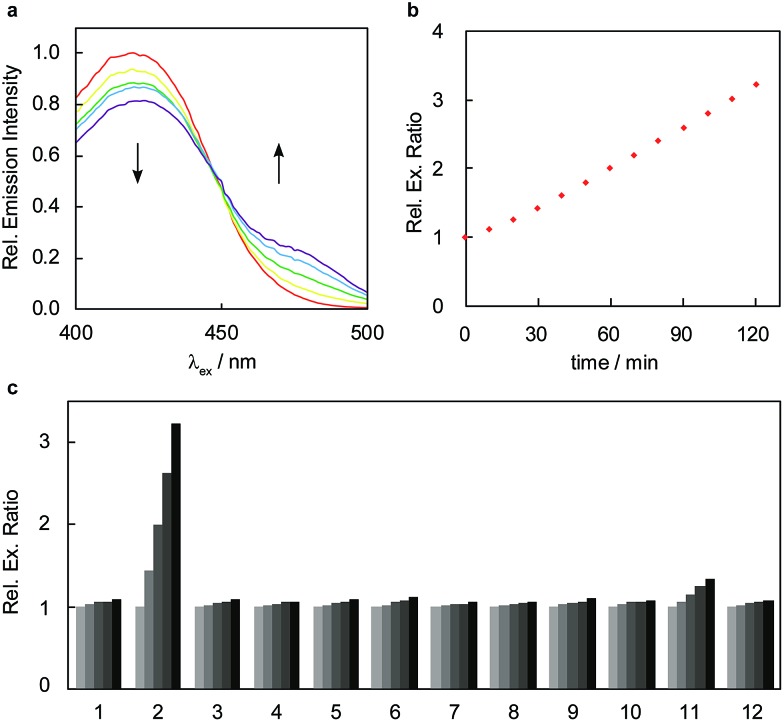
Fig. 2
FA response and selectivity of RFAP-1. Data were acquired at 37 u00b0C in 20 mM PBS (pH 7.4). Excitation spectra were collected between 400 and 500 nm with emission monitored at u03bb em = 510 nm. (a) Excitation ratiometric response of 10 u03bcM RFAP-1 to 100 u03bcM FA. Excitation spectra are shown at 0, 30, 60, 90, and 120 min (red, yellow, green, blue, and purple traces, respectively) after addition of FA. (b) Quantification of 470/420 nm excitation ratio over time. (c) Excitation ratiometric response of 10 u03bcM RFAP-1 to biologically relevant RCS and related molecules. Bars represent relative 470/420 nm excitation ratios at 0, 30, 60, 90, and 120 (black) min after the addition of a given analyte. The data shown are for a concentration of 100 u03bcM for all species unless otherwise denoted. Legend: (1) PBS; (2) FA; (3) acetaldehyde; (4) pyruvate; (5) glucose, 1 mM; (6) 4-HNE; (7) dehydroascorbate; (8) oxaloacetate; (9) glucosone; (10) acrolein; (11) methylglyoxal; (12) methylglyoxal, 10 u03bcM.
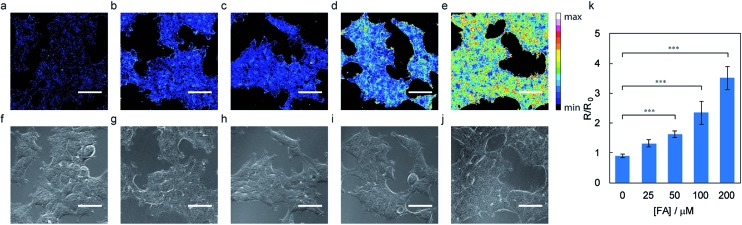
Fig. 3
Representative ratiometric confocal microscopy images of FA detection in live HEK293T cells loaded with 10 u03bcM RFAP-1. Images were taken 60 min after the addition of (a) vehicle, (b) 25 u03bcM FA, (c) 50 u03bcM FA, (d) 100 u03bcM FA, and (e) 200 u03bcM FA. (fu2013j) Bright-field images of the cells in (au2013e). Scale bar represents 40 u03bcm in all images. (k) Mean 488/405 excitation ratios of the HEK293T cells treated with varying concentrations of FA for 60 min relative to the mean 488/405 excitation ratios before FA addition; error bars denote SEM, n = 5. *** P < 0.001.
Scheme 5
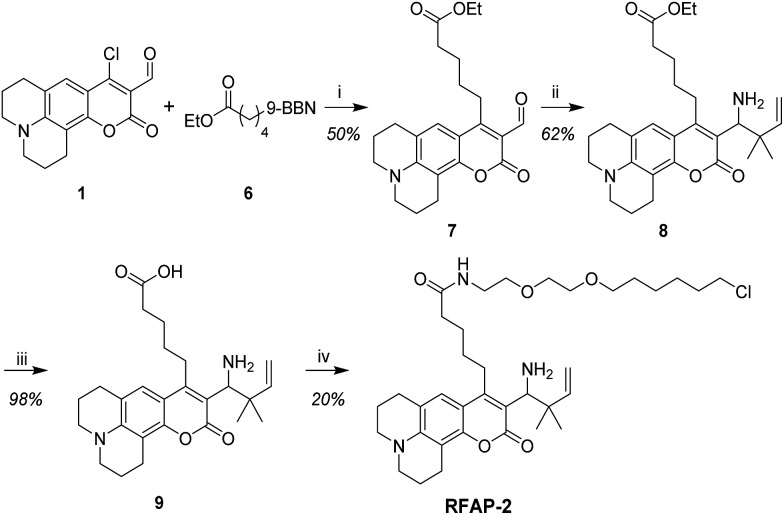
Synthesis of RFAP-2. Reagents and conditions: (i) Pd-PEPPSI-IPr, K 3 PO 4 u00b7H 2 O, THF, rt, 10 h; (ii) NH 3 , MeOH, 0 u00b0C, then prenylboronic acid, rt, 10 h; (iii) LiOH, THF/MeOH/H 2 O, rt, 6 h; (iv) 2-(2-((6-chlorohexyl)oxy)ethoxy)ethan-1-amine, HATU, DIPEA, DMF, rt, 12 h.
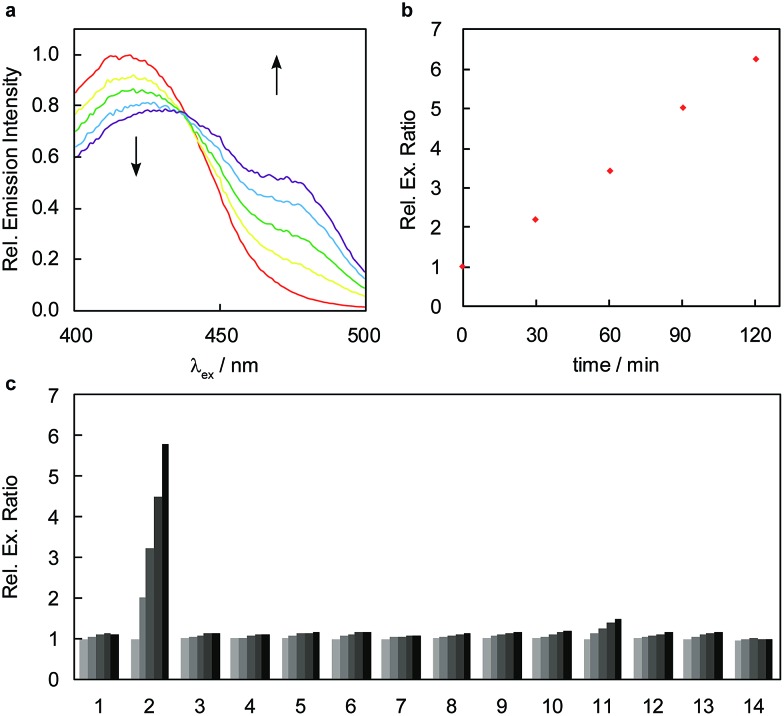
Fig. 4
FA response and selectivity of RFAP-2. Data were acquired at 37 u00b0C in 20 mM PBS (pH 7.4). Excitation spectra were collected between 400 and 500 nm with emission monitored at u03bb em = 510 nm. (a) Excitation ratiometric response of 10 u03bcM RFAP-2 to 100 u03bcM FA. Excitation spectra are shown at 0, 30, 60, 90, and 120 min (red, yellow, green, blue, and purple traces, respectively) after the addition of FA. (b) Quantification of 470/420 nm excitation ratio over time. (c) Excitation ratiometric response of 10 u03bcM RFAP-2 to biologically relevant RCS and related molecules. Bars represent relative 470/420 nm excitation ratio at 0, 30, 60, 90, and 120 (black) min after addition. Data shown are for a concentration of 100 u03bcM for all species unless otherwise denoted. Legend: (1) PBS; (2) FA; (3) acetaldehyde; (4) pyruvate; (5) 1 mM glucose; (6) 4-HNE; (7) dehydroascorbate; (8) oxaloacetate; (9) glucosone; (10) acrolein; (11) methylglyoxal; (12) 10 u03bcM methylglyoxal; (13) H 2 O 2 ; (14) 5 mM glutathione.
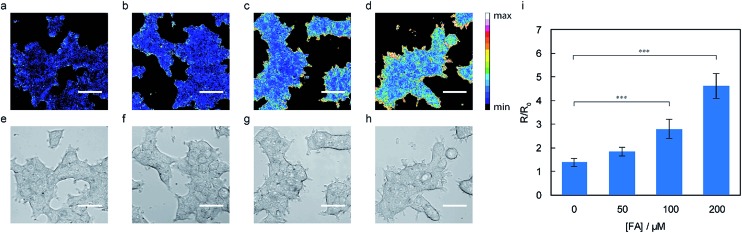
Fig. 5
Representative ratiometric confocal microscopy images of FA detection in live HEK293T loaded with 10 u03bcM RFAP-2. Images were taken 60 min after the addition of (a) vehicle, (b) 50 u03bcM FA, (c) 100 u03bcM, and (d) 200 u03bcM FA. (eu2013h) Bright-field images of the cells in (au2013d). Scale bar represents 40 u03bcm in all images. (k) Mean 488/405 excitation ratios of the HEK293T cells treated with varying concentrations of FA for 60 min relative to the mean 488/405 excitation ratios before FA addition; error bars denote SEM, n = 4. *** P < 0.001.
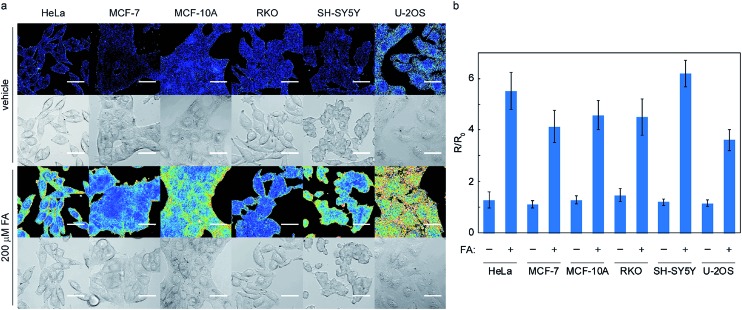
Fig. 6
Representative ratiometric confocal microscopy images of FA detection in various cell lines using RFAP-2. Images were taken 30 min after the addition of either vehicle or 200 u03bcM FA. Scale bar represents 40 u03bcm in all images. (a) Ratio and bright-field images; (b) the mean 488/405 excitation ratios of the cells treated with vehicle or 200 u03bcM FA for 30 min relative to the mean 488/405 excitation ratios before vehicle or FA addition; error bars denote SEM, n = 2 (3 fields per condition).
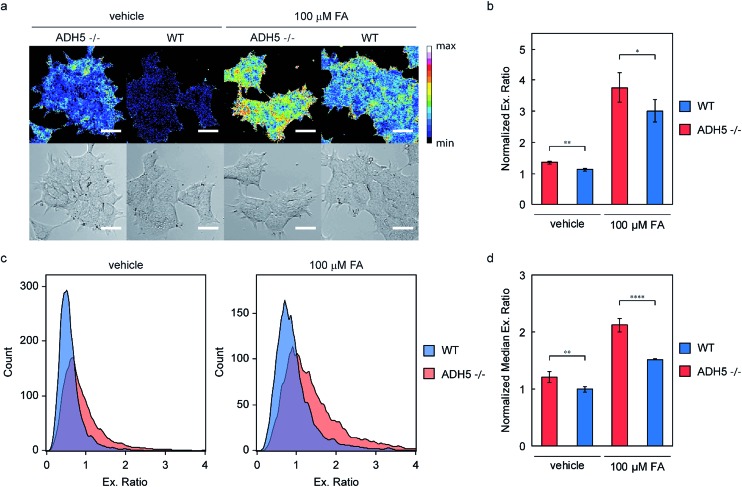
Fig. 7
FA detection in ADH5 u2013/u2013 vs. WT HAP1 cells with 500 nM RFAP-2. (a) Representative ratiometric confocal microscopy images taken 60 min after treatment with vehicle or 100 u03bcM FA. Scale bar represents 25 u03bcm in all images. (b) Normalized mean 488/405 excitation ratios of the ADH5 u2013/u2013 and WT HAP1 cells treated with vehicle or 100 u03bcM FA for 60 min by confocal microscopy; error bars denote SEM, n = 5. (c) Representative histograms obtained via flow cytometric analysis of the ADH5 u2013/u2013 and WT HAP1 cells treated with either vehicle or 100 u03bcM FA for 60 min. (d) Normalized median 488/405 excitation ratios of the ADH5 u2013/u2013 and WT HAP1 cells treated with vehicle or 100 u03bcM FA for 60 min by flow cytometry; error bars denote SEM, n = 5. * P < 0.05, ** P < 0.01, **** P < 0.0001.
Figure images are served from the NIH/NLM PubMed Central Open Access Subset or Europe PMC; copyright remains with the publishers and authors.
💬 Discussion
0 commentsNo comments yet. Be the first to start a discussion!
Leave a Comment