Abstract
BACKGROUND: Försters resonance energy transfer (FRET) microscopy is widely used for the analysis of protein interactions in intact cells. However, FRET microscopy is technically challenging and does not allow assessing interactions in large cell numbers. To overcome these limitations we developed a flow cytometry-based FRET assay and analysed interactions of human and simian immunodeficiency virus (HIV and SIV) Nef and Vpu proteins with cellular factors, as well as HIV Rev multimer-formation. RESULTS: Amongst others, we characterize the interaction of Vpu with CD317 (also termed Bst-2 or tetherin), a host restriction factor that inhibits HIV release from infected cells and demonstrate that the direct binding of both is mediated by the Vpu membrane-spanning region. Furthermore, we adapted our assay to allow the identification of novel protein interaction partners in a high-throughput format. CONCLUSION: The presented combination of FRET and FACS offers the precious possibility to discover and define protein interactions in living cells and is expected to contribute to the identification of novel therapeutic targets for treatment of human diseases.
🔬 Techniques
🔭 Microscopes
🧬 Organisms
💻 Software
✨ Fluorophores
🧪 Sample Preparation
🔬 Cell Lines
🏭 Microscope Brands
🧪 Reagent Suppliers
🎨 Filters
💻 Software Details
🏛️ Research Organizations (ROR)
Affiliated research institutions:
📋 Methods
Generation and Cloning of Expression Vectors
Our aim was to develop a cloning strategy that allows to generate any gene of interest (GOI) as an N- or C-terminal EYFP/ECFP-fusion without further modifications of the vectors ( Fig. S1 ). Therefore, we used the widely distributed Clontech vectors pEYFP-C1/N1 and pECFP-C1/N1 (kind gifts from Dr. Klaudia Giehl, University of Ulm). In C1- and N1-vector derivatives C-terminal tagged fusions can be generated by using the single cutter restriction sites NheI and AgeI . Target sequence amplification is done with 5′-p NheI -GCG GCTAGC -(target sequence) and 3′-p AgeI - TCG ACCGGT GCACCTGCTCC -(target sequence) which eliminates the stop codon and introduces the linker AA sequence GAGAPVAT. Similarly, N-terminal tagged fusions in C1-vector derivatives can be generated by using the unique XhoI and EcoRI sites and amplification of the target with 5′p XhoI - CG CTCGAG CT -(target sequence) and 3′- EcoRI -CT GAATTC -(target sequence) resulting in the linker SGLRSRA. In N1-vector derivatives N-terminal tagged fusions are generated via the BsrGI and NotI sites and the primer 5′p BsrG1 - GC TGTACA AGGGAGCAGGTGCAGGAGCA -(target sequence) and 3′p NotI - GTC GCGGCCGC T -(target sequence) resulting in the linker LYKGAGAGA. An overview of the vectors and restriction sites used, as well as the linker sites is depicted in Figure S1 . The membrane expressed pECFP-MEM (Clontech) control was a kind gift of Dr. Klaudia Giehl (University of Ulm). As FRET-positive control we generated the pEYFP-ECFP construct expressing EYFP and ECFP as a fusion. Cellular factors (MHC-I, MHC-II, CD3ζ-chain, CD4, CD317, MurrI and p53) were PCR amplified from a human PCR-ready PBMC cDNA (Spring Bioscience) and ligated into pECFP-C1 using standard cloning procedures. All factors were generated as C-terminal tagged ECFP fusions except CD317, which was tagged at the N-terminus. HIV-1 NL4-3 vpu, tat and NA7 nef as well as SIVmac 239 nef were PCR amplified from proviral DNA and ligated into pEYFP-N1 or pEYFP-C1 as C-terminal tagged fusions. CD317 was PCR amplified and inserted into pFLAG-CMV2 (Sigma) that directs the expression of CD317 N-terminally tagged with a FLAG epitope. HIV-1 C-terminal tagged Rev-fusion constructs were amplified by PCR from HIV-1 pcRevWT and pcRevSLT40 [16] and ligated into pEYFP-N1 or pECFP-N1. For demonstration of HTS, we PCR amplified the pEYFP- vpu fusion and inserted it into the pCGCG-vector [18] instead of the IRES-GFP cassette. All PCR derived inserts were sequenced to verify the absence of undesired nucleotide changes. Cell Culture and Transfections 293T or Hela cells were maintained in Dulbecco modified Eagle medium (DMEM) supplemented with 10% FCS. 293T cells were transfected by the calcium phosphate method as described previously [18] . Briefly, 400,000 cells/well were seeded in 6-well plates one day prior to transfection. Then we transfected 2.5 µg DNA per donor and acceptor construct and FRET measurements were performed 24–36 h post transfection. For the Rev multimerization experiments 293T cells were transiently transfected with 0.5 µg Gag expression vector GPV-RRE [19] (provided by M.H. Malim; King's College London, UK), 0.125 µg pBC12/CMV/SEAP (transfection-efficiency control) and 0.25 µg of acceptor and donor construct by using TurboFect reagent (Fermentas) according to the manufactor's protocol. Additionally to FRET measurements supernatants were analysed for particle production by p24 antigen ELISA and SEAP-activity 30 h post transfection. In some experiments, we added coverslips to the wells to analyse subcellular localization or FRET signals via confocal microscopy.
Show full methods section
Generation and Cloning of Expression Vectors
Our aim was to develop a cloning strategy that allows to generate any gene of interest (GOI) as an N- or C-terminal EYFP/ECFP-fusion without further modifications of the vectors ( Fig. S1 ). Therefore, we used the widely distributed Clontech vectors pEYFP-C1/N1 and pECFP-C1/N1 (kind gifts from Dr. Klaudia Giehl, University of Ulm). In C1- and N1-vector derivatives C-terminal tagged fusions can be generated by using the single cutter restriction sites NheI and AgeI . Target sequence amplification is done with 5′-p NheI -GCG GCTAGC -(target sequence) and 3′-p AgeI - TCG ACCGGT GCACCTGCTCC -(target sequence) which eliminates the stop codon and introduces the linker AA sequence GAGAPVAT. Similarly, N-terminal tagged fusions in C1-vector derivatives can be generated by using the unique XhoI and EcoRI sites and amplification of the target with 5′p XhoI - CG CTCGAG CT -(target sequence) and 3′- EcoRI -CT GAATTC -(target sequence) resulting in the linker SGLRSRA. In N1-vector derivatives N-terminal tagged fusions are generated via the BsrGI and NotI sites and the primer 5′p BsrG1 - GC TGTACA AGGGAGCAGGTGCAGGAGCA -(target sequence) and 3′p NotI - GTC GCGGCCGC T -(target sequence) resulting in the linker LYKGAGAGA. An overview of the vectors and restriction sites used, as well as the linker sites is depicted in Figure S1 . The membrane expressed pECFP-MEM (Clontech) control was a kind gift of Dr. Klaudia Giehl (University of Ulm). As FRET-positive control we generated the pEYFP-ECFP construct expressing EYFP and ECFP as a fusion. Cellular factors (MHC-I, MHC-II, CD3ζ-chain, CD4, CD317, MurrI and p53) were PCR amplified from a human PCR-ready PBMC cDNA (Spring Bioscience) and ligated into pECFP-C1 using standard cloning procedures. All factors were generated as C-terminal tagged ECFP fusions except CD317, which was tagged at the N-terminus. HIV-1 NL4-3 vpu, tat and NA7 nef as well as SIVmac 239 nef were PCR amplified from proviral DNA and ligated into pEYFP-N1 or pEYFP-C1 as C-terminal tagged fusions. CD317 was PCR amplified and inserted into pFLAG-CMV2 (Sigma) that directs the expression of CD317 N-terminally tagged with a FLAG epitope. HIV-1 C-terminal tagged Rev-fusion constructs were amplified by PCR from HIV-1 pcRevWT and pcRevSLT40 [16] and ligated into pEYFP-N1 or pECFP-N1. For demonstration of HTS, we PCR amplified the pEYFP- vpu fusion and inserted it into the pCGCG-vector [18] instead of the IRES-GFP cassette. All PCR derived inserts were sequenced to verify the absence of undesired nucleotide changes. Cell Culture and Transfections 293T or Hela cells were maintained in Dulbecco modified Eagle medium (DMEM) supplemented with 10% FCS. 293T cells were transfected by the calcium phosphate method as described previously [18] . Briefly, 400,000 cells/well were seeded in 6-well plates one day prior to transfection. Then we transfected 2.5 µg DNA per donor and acceptor construct and FRET measurements were performed 24–36 h post transfection. For the Rev multimerization experiments 293T cells were transiently transfected with 0.5 µg Gag expression vector GPV-RRE [19] (provided by M.H. Malim; King's College London, UK), 0.125 µg pBC12/CMV/SEAP (transfection-efficiency control) and 0.25 µg of acceptor and donor construct by using TurboFect reagent (Fermentas) according to the manufactor's protocol. Additionally to FRET measurements supernatants were analysed for particle production by p24 antigen ELISA and SEAP-activity 30 h post transfection. In some experiments, we added coverslips to the wells to analyse subcellular localization or FRET signals via confocal microscopy.
FACS-FRET and Confocal Microscopy
FACS-FRET measurements were performed using a FACSAria (BD Bioscience) equipped with 405 nm, 488 nm and 633 nm lasers. To measure ECFP and FRET cells were excited with the 405 nm laser and fluorescence was collected in the ECFP channel with a standard 450/40 filter, while the FRET-signal was measured with a 529/24 filter (Semrock). To measure EYFP, cells were excited with the 488 nm laser while emission was also taken with a 529/24 filter (Semrock). For each sample, we evaluated a minimum of one thousand CFP/YFP positive cells that fell within the background adjusted gate ( Fig. 1a, panel 2 ). To analyse subcellular localization or FRET via confocal microscopy, transfected cells grown on coverslips were mounted on microscope slides using mowiol mounting solution (2.4 g polyvinylalcohol, 6 g Glycerin, 18 ml PBS) and imaged with a Zeiss LSM510 Meta. Confocal FRET analysis were performed as described in the “FRET and colocalization analyzer – Users guide” [7] . 10.1371/journal.pone.0009344.g001 Figure 1 Setup of FRET-measurements by flow cytometry and microscopy. (a) The experimental setup and gating strategy to measure FRET by FACS. Living 293T cells transfected with the controls CFPonly, YFPonly, CFP and YFP as well as the CFP-YFP fusion proteins were analysed on a FACS Aria flow cytometer. Double positive cells were gated (panel 1) and false positive FRET signals resulting from YFP excitation by the 405 nm laser were excluded (panel 2). The remaining cells were evaluated for FRET by adjusting a gate defining to cells which are cotransfected with CFP and YFP only and should thus be FRET-negative (panel 3). (b) Living 293T cells and cells from the same transfections were treated with 2% PFA and analysed for FRET as depicted in (a). Shown are mean values +/− standard deviation from seven independent transfections. (c) 293T cells were grown on cover slips and cotransfected with CFP and YFP or the CFP-YFP fusion protein and mounted on microscope slides. Confocal images were taken and analysed for FRET using the “FRET and colocalization analyzer” ImageJ plug-in (7). “FRET”-images give the calculated amount of FRET for each pixel in the merged images. The ImageJ plug-in colour codes the relative FRET efficiency which is indicated by the displayed colour bar. Furthermore the “coloc/FRET”-plots display pixel colocalization as well as colour coded FRET efficiency in a 2D plot. CFP is shown in red and YFP in green. FACS-Analysis of Cell Surface Receptor Modulation Jurkat cells were maintained in RPMI with standard supplements and electroporated using the Microporator-MP100 (PeqLab) device as recommended by the manufacturer. Briefly, 2×10 6 cells per electroporation were washed twice with PBS and resuspended in 100 µl R-buffer containing 5 µg Plasmid-DNA. Microporator parameters were set to pulse voltage 1300, pulse width 20 ms and number of pulses 2. Electroporated cells were cultivated in 2 ml RPMI with standard supplements. 24 h later cells were analysed via FACS for expression of CD4, MHCI and CD3 as described previously [18] . Vpu-CD317 Co-Immunoprecipitation Experiments For co-immunoprecipitation, 9×10 5 293T cells were transfected with pCMV-FLAG-CD317 (0.1 µg) and pEYFP-vpu (1 µg) or pCG-vpu (1 µg) expression plasmids as indicated. Cells were lysed by digitonin lysis buffer (140 mM NaCl, 10 mM Tris/HCl, pH 7.4, 1 mM EDTA, protease inhibitor mixture (Roche), 1% (w/v) digitonin (Calbiochem) in order to solubilize transmembrane proteins. Cleared lysates were incubated with anti-Vpu serum [20] for 90 min on ice. Immune complexes were recovered on protein G-Sepharose for 60 min, washed four times in wash buffer (lysis buffer with 0.1% digitonin), separated in 15% SDS-PAA gel, and probed in Western blot with M2-anti-FLAG-HRP antibodies (Sigma). Library Screening for Potential Interaction Partners 293T or Hela cells were transfected as described above or electroporated using the Microporator MP100 device (PeqLab) as recommended by the manufacturer. For electroporation, 1 µg total DNA (0.3 µg YFP construct and 0.7 µg CFP construct) was mixed with 500,000 cells. Electroporations were carried out in 100 µl tips using the following conditions: 1200 V, 20 ms, 2 pulses for 293T cells and 985 V, 35 ms, 2 pulses for Hela cells. One day post transfection/electroporation FRET-positive cells were sorted in PBS +1% FCS and pelleted. Plasmids were isolated via the QIAamp DNA Micro Kit using the protocol for cultured cells as provided by the manufacturer or the QIAprep Spin plasmid kit (Qiagen) following the protocol “Isolation of plasmid DNA from mammalian cells with QIAprep”, which had better yields. Total recovered DNA was transformed into One Shot TOP10 cells (Invitrogen) and plated on a kanamycin containing agar plate. Colonies were picked and plasmids isolated by standard miniprep following restriction analysis of the insert.
Statistical Analyses
Statistical analyses were performed using the Graph Pad Prism Version 5.0 software package. For all calculations we used the two-tailed unpaired Students-t-test and the Mann-Whitney test, which yielded the same results.
Supporting Information Figure S1 Expression vectors for the generation of fusion proteins. Unmodified pEYFP- or pECFP-C1/N1 (Clontech) vectors were chosen for the generation of fusion proteins. C-terminal with chromophore tagged fusions can be generated in either the C1 or the N1 vector backbone by using single NheI and AgeI restriction sites. The gene of interest (GOI) is cloned in frame with the chromophore post elimination of the stop codon and introduction of the linker sequence GAGAPVAT by PCR. N-terminal with chromophore tagged fusions can be generated in the C1-backbone by XhoI and EcoRI sites or in the N1-backbone using BsrGI and NotI together with the linkers indicated. (0.27 MB TIF) Click here for additional data file. Figure S2 Analyses of cell surface receptor modulation by Nef and Vpu fusion proteins. Jurkat cells were electroporated with pEYFP-only, pEYFP-MEM, pEYFP HIV-1 NA7 Nef, pEYFP-SIV mac239 Nef or pEYFP-NL4-3 Vpu and down-modulation of CD4, CD3 and MHC-I by the different viral proteins was measured by flow cytometry as described in the methods section. Receptor cell surface expression of pEYFP-only electroporated cells was set as 100%. Presented are means and standard deviations of two independent experiments. (0.23 MB TIF) Click here for additional data file. Figure S3 Colocalization and subcellular localization of viral and cellular fusion-proteins. Confocal images of 293T cells that were cotransfected with the indicated YFP- and CFP-fusion proteins. The top panel shows three different cells that were transfected with the indicated YFP-fusion proteins only. The left panel shows individual cells that were transfected with the indicated CFP-fusion proteins only. YFP is shown in green and CFP is shown in red. (2.36 MB TIF) Click here for additional data file. Figure S4 Untagged NL4-3 Vpu protein immunoprecipitates CD317. 293T cells were transfected with the pCG-NL4-3 Vpu and a FLAG-tagged CD317. Vpu complexes from cellular lysates were immunoprecipitated with a rabbit anti-Vpu serum (43) and blotted for the presence of CD317 with anti-FLAG. (0.23 MB TIF) Click here for additional data file. Figure S5 Biological activity of HIV-1 Rev CFP/YFP fusion proteins. 293T cells were transfected with the indicated CFP/YFP fusion proteins and co-transfected with the Gag expression vector GPV-RRE (36) and a CMV-SEAP reporter construct. Released p24 was measured by ELISA and normalized to transfection efficiency by determining the levels of SEAP (secreted alkaline phosphatase). Error bars represent the SD of triplicates from one representative out of two independent experiments. (0.19 MB TIF) Click here for additional data file.
📊 Figures
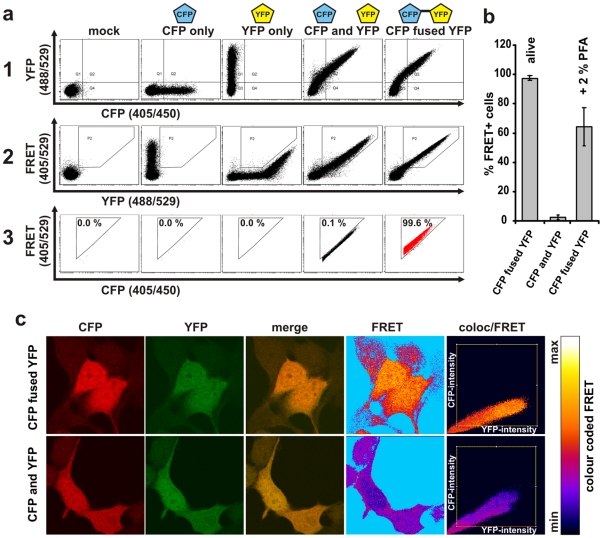
Figure 1
Setup of FRET-measurements by flow cytometry and microscopy.
(a) The experimental setup and gating strategy to measure FRET by FACS. Living 293T cells transfected with the controls CFPonly, YFPonly, CFP and YFP as well as the CFP-YFP fusion proteins were analys...
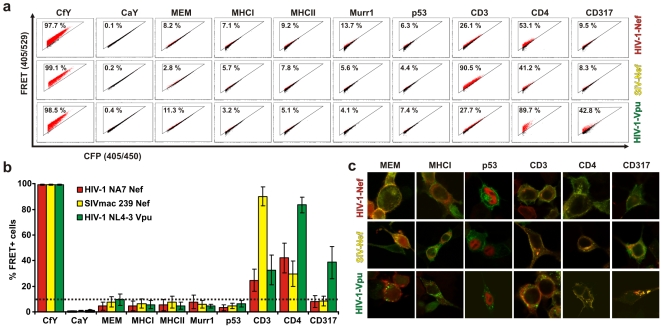
Figure 2
Analyses of protein interactions by FRET.
(a) Representative primary FACS-plots showing the amount of FRET+ cells in living 293T cells cotransfected with the indicated CFP and YFP fusion proteins. Numbers give total percentages of cells withi...
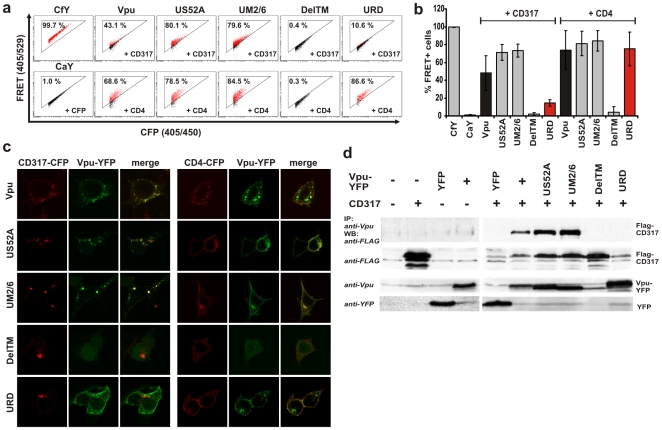
Figure 3
Vpu interacts with CD317 via its transmembrane region.
(a) Representative primary FACS-plots showing the amount of FRET+ cells in living 293T cells cotransfected with the indicated CD4 or CD317-CFP and Vpu-YFP fusion proteins. (b) Mean values and standard...
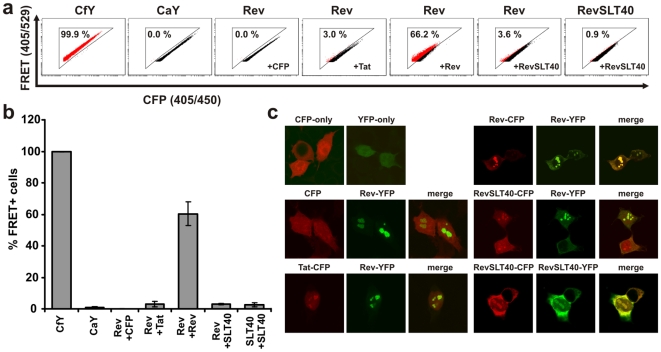
Figure 4
Measurement of HIV-1 Rev multimerization by FACS-FRET.
(a) Representative primary FACS-plots showing the amount of FRET+ cells in living 293T cells cotransfected with the indicated CFP and YFP fusion proteins. (b) Mean values and standard deviations (SD) ...
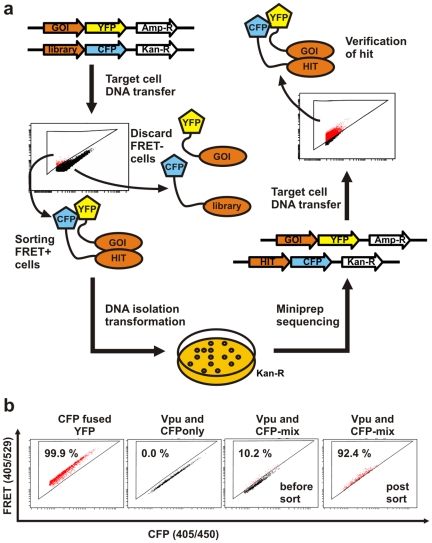
Figure 5
High-throughput-screening for unknown protein interactions by FACS-FRET.
(a) Experimental setup to screen for unknown protein interaction with flow cytometry based FRET in high-throughput. (b) Living 293T cells were transfected with the Vpu-YFP fusion as a bait and a mixtu...
Figure images are served from the NIH/NLM PubMed Central Open Access Subset or Europe PMC; copyright remains with the publishers and authors.
💬 Discussion
0 commentsNo comments yet. Be the first to start a discussion!
Leave a Comment