Abstract
Glioblastoma multiforme (GBM) is the most common primary brain cancer in adults and there are few effective treatments. GBMs contain cells with molecular and cellular characteristics of neural stem cells that drive tumour growth. Here we compare responses of human glioblastoma-derived neural stem (GNS) cells and genetically normal neural stem (NS) cells to a panel of 160 small molecule kinase inhibitors. We used live-cell imaging and high content image analysis tools and identified JNJ-10198409 (J101) as an agent that induces mitotic arrest at prometaphase in GNS cells but not NS cells. Antibody microarrays and kinase profiling suggested that J101 responses are triggered by suppression of the active phosphorylated form of polo-like kinase 1 (Plk1) (phospho T210), with resultant spindle defects and arrest at prometaphase. We found that potent and specific Plk1 inhibitors already in clinical development (BI 2536, BI 6727 and GSK 461364) phenocopied J101 and were selective against GNS cells. Using a porcine brain endothelial cell blood-brain barrier model we also observed that these compounds exhibited greater blood-brain barrier permeability in vitro than J101. Our analysis of mouse mutant NS cells (INK4a/ARF(-/-), or p53(-/-)), as well as the acute genetic deletion of p53 from a conditional p53 floxed NS cell line, suggests that the sensitivity of GNS cells to BI 2536 or J101 may be explained by the lack of a p53-mediated compensatory pathway. Together these data indicate that GBM stem cells are acutely susceptible to proliferative disruption by Plk1 inhibitors and that such agents may have immediate therapeutic value.
🔬 Techniques
💻 Software
✨ Fluorophores
🧪 Sample Preparation
🔬 Cell Lines
🏭 Microscope Brands
🧪 Reagent Suppliers
💻 Software Details
🏛️ Research Organizations (ROR)
Affiliated research institutions:
📋 Methods
Ethics Statement
Human primary cell lines used in this study were obtained according to UK regulations and following approval from the local ethical review board (Lothian Regulatory Ethics Committee; Ref LREC/2002/6/15). Tissue was donated using written informed consent from patients or next of kin for tumour biopsies and foetal tissue, respectively.
Cell culture of NS and GNS Human
GNS and NS cell lines were derived from glioblastoma biopsies or foetal brain tissues using described protocols [21] , [22] , [24] . Foetal forebrain tissue from Carnegie stage 23 embryos (∼56 days) was used to establish NS cell cultures. Cells were cultured in serum-free complete medium (CM), N2 and B27 supplemented with Laminin at 1 µg/ml (Sigma) and EGF/FGF-2 (Peprotech, 10 ng/ml) and split typically once per week after dissociation with Accutase solution (Sigma) and centrifugation. Chromosomal spreads were performed as described [25] . Cells were incubated with demecolcine (0.1 µg/ml, Sigma) overnight and subsequently dissociated, harvested by centrifugation and re-suspended in 5 ml 0.075M buffered KCl and incubated at 37°C for 30 min. Following centrifugation, the pellets were carefully re-suspended in 10 ml of ice-cold fixative (methanol: glacial acetic acid; 3∶1 v/v), incubated at room temperature for 30 minutes, harvested by centrifugation, re-suspended in 1 ml fixative and examined on glass slides. IENS cells were kindly provided by Prof M. van Lohuizen [41] . P53 −/− mouse forebrain NS cultures were a gift from Dr P. Dirks.
Gene expression analysis
The expression of glioblastoma subtype signature genes in GNS cells was examined using published Affymetrix HG-U133 Plus 2 microarray data [22] . Affymetrix HT HG-U133A microarray data for 171 previously used for subtype discovery was obtained from The Cancer Genome Atlas ( http://cancergenome.nih.gov/ ) and used for comparison. Only probesets present on both array types were used for analysis. The two data sets were individually background corrected and normalized with the RMA method in the Bioconductor package affy [26] . Gene expression values were computed by averaging normalized intensites of corresponding probesets, using mappings of probesets to genes from Ensembl 67 [27] , and centered on the mean across samples. To visualize subtype signatures for glioblastoma samples, expression values were scaled by SD across samples, averaged by subtype, and scaled to units of SD across subtypes.
Show full methods section
Ethics Statement
Human primary cell lines used in this study were obtained according to UK regulations and following approval from the local ethical review board (Lothian Regulatory Ethics Committee; Ref LREC/2002/6/15). Tissue was donated using written informed consent from patients or next of kin for tumour biopsies and foetal tissue, respectively.
Cell culture of NS and GNS Human
GNS and NS cell lines were derived from glioblastoma biopsies or foetal brain tissues using described protocols [21] , [22] , [24] . Foetal forebrain tissue from Carnegie stage 23 embryos (∼56 days) was used to establish NS cell cultures. Cells were cultured in serum-free complete medium (CM), N2 and B27 supplemented with Laminin at 1 µg/ml (Sigma) and EGF/FGF-2 (Peprotech, 10 ng/ml) and split typically once per week after dissociation with Accutase solution (Sigma) and centrifugation. Chromosomal spreads were performed as described [25] . Cells were incubated with demecolcine (0.1 µg/ml, Sigma) overnight and subsequently dissociated, harvested by centrifugation and re-suspended in 5 ml 0.075M buffered KCl and incubated at 37°C for 30 min. Following centrifugation, the pellets were carefully re-suspended in 10 ml of ice-cold fixative (methanol: glacial acetic acid; 3∶1 v/v), incubated at room temperature for 30 minutes, harvested by centrifugation, re-suspended in 1 ml fixative and examined on glass slides. IENS cells were kindly provided by Prof M. van Lohuizen [41] . P53 −/− mouse forebrain NS cultures were a gift from Dr P. Dirks.
Gene expression analysis
The expression of glioblastoma subtype signature genes in GNS cells was examined using published Affymetrix HG-U133 Plus 2 microarray data [22] . Affymetrix HT HG-U133A microarray data for 171 previously used for subtype discovery was obtained from The Cancer Genome Atlas ( http://cancergenome.nih.gov/ ) and used for comparison. Only probesets present on both array types were used for analysis. The two data sets were individually background corrected and normalized with the RMA method in the Bioconductor package affy [26] . Gene expression values were computed by averaging normalized intensites of corresponding probesets, using mappings of probesets to genes from Ensembl 67 [27] , and centered on the mean across samples. To visualize subtype signatures for glioblastoma samples, expression values were scaled by SD across samples, averaged by subtype, and scaled to units of SD across subtypes.
Proteomic screening Cell lines
G144 and G166 treated with J101 (100 nM for 1, 2 or 4 h, or DMSO control) were lysed in buffer provided by the manufacturer and tested on a panel of 812 antibodies, 550 pan-specific and 262 phospho-specific (Kinex antibody microarray platform, Kinexus Bioinformatics Corporation). Results from this dataset were filtered using the heuristic z -score threshold of ±1.1 on the comparison of treated versus untreated to identify pronounced effects. To study the known interactions between modulated proteins/phospho-proteins, pathway analysis was carried out with Ingenuity software (IPA, Ingenuity Systems). This approach enabled identification of networks significantly enriched for the proteins of interest.
Chemical screening
Chemical screening was carried out essentially as described in detail elsewhere [28] . Cells were seeded in 96-well plates (3000 cells per well) and left to settle and attach for 3 days. Images were collected at hourly intervals over 3–6 days and included image acquisition prior to addition of the compounds as the time point 0 h. Each inhibitor was added at a final concentration of 100 nM. A benchtop 96-well format liquid handling device (CyBi-Selma, CyBio) was used to plate cells and dispense chemicals. Images were acquired using the Incucyte HD or Incucyte FLR live-cell imaging system (Essen Biosciences). Initial confluence values typically clustered around 20–30% and final confluence values of DMSO controls around approximately 60–70%.
Image processing
Incucyte experiments were archived separately. Acquired images were exported as TIF files in the Metamorph ND format with standardised identifiers from which to extract metadata. The CellProfiler image analysis pipeline included loading of images, identification of primary objects, measurement of the imaging area and object size and shape. Data analysis was carried out in R using our in-house developed package ‘ Cellprofile-R ’ ( http://code.google.com/p/cellprofile-r/ ). Example time-lapse sequences were assembled in lossless format using Avid Media Composer. Global brightness and contrast adjustments were applied in Adobe After Effects and video files were rendered in H.264/MPEG-4 from Adobe Media Encoder. A similar pipeline in CellProfiler was used to quantify DAPI and pHH3 positive nuclei in fixed immunohistochemistry. To characterise the degree of mitotic arrest images of phospho-histone H3-positive cells ( n ≤100) were exported to a thumbnail gallery and classified based on the appearance of the spindle as ‘No spindle’, ‘Unipolar’, ‘Bipolar’ or ‘Multipolar’. InhibitorSelect 96-Well Protein Kinase Inhibitor Library I and II (EMD, Cat No. 539744) and II (EMD, Cat No. 539745) consists of 160 well-characterised, cell-permeable, potent and reversible protein kinase inhibitors, the majority of which are ATP-competitive. J101 was obtained from Sigma for validation experiments. BI2536, BI6727 and GSK 461364 were obtained from Selleck Chemicals and Imatinib from EMD Merck.
Quantitative RT-PCR Total
RNA was collected from human and mouse cell samples using QIAGEN RNeasy Mini kit (Qiagen) and cDNA was synthesized with Superscript III (Invitrogen). Quantitative real-time PCR was performed using the LightCycler system (Roche) and data were analysed with the Bioconductor package HTqPCR [29] . Samples were normalised to GAPDH or 18S ribosomal RNA for human and mouse samples, respectively. Averages of technical duplicates were used in each experiment. For human samples experimental data were calculated relative to CB660 NS cell expression levels, whereas for mouse samples experimental data were calculated relative to ANS4 cells. PCR primers and associated Universal ProbeLibrary (Roche) sequences are provided in supporting methods.
Immunocytochemistry and immunoblotting
For immunocytochemistry analysis, medium was carefully removed to avoid cell detachment and cells were fixed with paraformaldehyde 4% for 10 min. After washing with PBS supplemented with 0.1% Triton X-100 (PBS-T), blocking solution with PBS-T+1% BSA+3% goat serum (Sigma) was added for 30 min. Primary antibodies were added to the blocking solution and incubated overnight at 4°C. Primary antibodies used were: goat polyclonal Lamin B (Santa Cruz, sc-6216), rat or rabbit anti-pHH3 (Sigma), mouse alpha-tubulin (Sigma). Appropriate goal secondary antibodies conjugated with Alexa Fluor dyes (Life Technologies) were used throughout.
Immunoblotting
Cells were lysed in 150 mM NaCl, 20 mM Tris-HCl pH 7.5, 0.5% NP-40, 2 mM EDTA, 1 mM NaF and protease inhibitors. Protein sample buffer was added to lysates and proteins were analyzed by SDS-PAGE followed by wet blotting. The following antibodies were used: anti-α Tubulin (rat monoclonal hybridoma supernatant, kind gift of Dr. A. Hergovich, UCL, London), anti-Plk1 (rabbit polyclonal, Cell Signaling, #4535), anti-Phospho-Plk1 (rabbit polyclonal, Cell Signaling, #5472), anti-Plk2 (rabbit polyclonal, kind gift of Dr. I. Hoffmann, DKFZ, Heidelberg), anti-Sox2 (mouse monoclonal, R&D ab2017), anti-Sox9 (ab3697, rabbit polyclonal, Abcam), anti-GFAP (mouse, monoclonal, Sigma G3893), secondary antibodies ECL anti-rat, anti-mouse and anti-rabbit HRP linked whole antibody (Thermo Fisher).
Flow cytometry Unlabelled
ANS4 and GFP-labelled 223.2 (p53 −/− ) cell lines were analysed by flow cytometry. In 6-well plates, 50,000 cells of ANS4, 223.2 or a 1∶1 mixture of both cell lines were seeded in duplicate wells. Cells were treated with DMSO, J101 (100 nM) or BI 2536 (100 nM) and at day 3 inhibitors were withdrawn by media replacement. Percentages of GFP-positive cells were determined at days 0, 2, 4, and 6 on the CyAn flow analyser (Beckman Coulter, USA). Data analysis was performed with Kaluza Flow Cytometry software version 1.1 (Beckman Coulter, USA). In vitro blood-brain barrier assay Porcine brain endothelial cells (PBECs) were isolated and cultured as described [30] , [31] . Inserts with confluent PBECs were co-cultured with GNS cells and compounds applied to determine their capacity to cross the endothelial barrier to the GNS cells below. After 24 h the cell culture inserts containing PBECs were removed and GNS cells were cultured for a further 24 h, fixed, and then analysed by immunocytochemistry. Sodium fluorescein (Sigma) was used as a control to determine levels of paracellular permeability and therefore integrity of the barrier function of PBECs (applied at 7.5 µg/ml in the top insert). Samples of culture media below the insert were collected and fluorescence was measured at an excitation wavelength of 485 nm and an emission wavelength of 530 nm.
Supporting Information Figure S1 Principal component analysis
(PCA) for a set of morphological parameters obtained from the kinase inhibitor screen. None of the agents in the library, including several PDGFR inhibitors, were able to induce similar mitotic phenotypes. J101 (red dots) was identified in GNS cells but not NS cells as imposing a distinct cellular morphology that was subsequently validated as mitotic arrest. The morphological features of J101-treated cells are distinct from the similar rounded morphology resulting from cell death in response to staurosporine (yellow dots). (TIF) Click here for additional data file. Figure S2 Tracking of individual cells confirms J101 treatment imposes mitotic delays that can lead to mitosis. Images were obtained at hourly intervals and manually analysed to track individual cells following treatment with DMSO or J101 (100 nM). For NS cells (top), although J101-treated cells were stalled during mitosis, this was resolved after several hours. By contrast, GNS cells (bottom panels) typically arrested at mitosis and eventually underwent apoptosis (see red arrow, frame 14). (TIF) Click here for additional data file. Figure S3 Removal of J101 from GNS cells does not enable progression through mitosis.
GNS cells
(G7) were treated with J101 (100 nM) for 24 h. Inhibitor was then removed 0, 2, or 4 h later and cells fixed and stained for the mitotic marker PHH3. Mitotically arrested cells did not immediately proceed through mitosis following drug removal and the majority underwent apoptosis by 24 h. (TIF) Click here for additional data file. Figure S4 mRNA expression levels of FoxM1 downstream targets and related genes in CB660 foetal NS cells (black) and G7 GNS cells (red) as determined by qRT-PCR. mRNA was harvested after cells were treated with DMSO, BI 2536 (100 nM) and J101 (100 nM) for 5 or 24 h. Data are expressed as fold change relative to CB660 (DMSO). Values are normalised to GAPDH expression. There is no downregulation of FOXM1 transcriptional targets, suggesting the inhibitor lies downstream of FOXM1 activity. (TIF) Click here for additional data file. Figure S5 Transient knockdown of Plk1 mRNA using RNAi. (A) Four different shRNAs were tested and relative cell numbers were scored. We tested G166 and G7 as these exhibited the least and greatest response to J101 treatment, respectively. For both lines we observed a greater suppression of proliferation in GNS cells (G166 or G7) than normal NS cells. (B) qRT-PCR for Plk1 confirms Plk1 knockdown using these shRNAs. (TIF) Click here for additional data file. Figure S6 Metaphase spreads of mouse mutant NS cell lines. (A) p53 fl/fl cells. (B) p53 fl/fl cells transduced with CRE recombinase. (C) p53 −/− cells. (D) IENS cells (INK4A/ARF −/− plus EGFRvIII over-expressing NS cells) also display greater sensitivity to Plk1 inhibitors.
Genetically normal mouse NS cells
(ANS4) were less sensitive than the mouse glioma NS cell (IENS) to both J101 and BI 2536 treated (100 nM each). Cells were treated for 24 h and fixed and immunostained for pHH3. DAPI nuclear counterstain (blue). Sensitivity to Plk1 inhibitors is associated with loss of p53 signalling and occurs in the absence of aneuploidy. (TIF) Click here for additional data file. Table S1 Spreadsheet containing the full data extracted from the inhibitor screen. Compounds are ranked based on z -score. (XLSX) Click here for additional data file. Table S2 234 kinases were assessed for their activity following binding with J101. Significant off-target effects were observed against Plk1, Aurora-A and Aurora-B (highlighted in yellow). (XLSX) Click here for additional data file. Movie S1 High-content image analysis using CellProfiler and CellProfiler Analyst enables identification and scoring of mitotic cells and total cell numbers. Example time-lapse movie reconstructed with images processed by CellProfiler Analyst to identify objects as either mitotic (red dots), interphase viable cells (blue dots) or cellular debris/processes (green dots). (MOV) Click here for additional data file.
Movie S2 Cellular responses of NS cells
(CB660) to DMSO and J101, respectively. (MOV) Click here for additional data file.
Movie S3 Cellular responses of NS cells
(CB660) to DMSO and J101, respectively. (MOV) Click here for additional data file.
Movie S4 Cellular responses of GNS cells
(G7) to DMSO and J101, respectively. (MOV) Click here for additional data file.
Movie S5 Cellular responses of GNS cells
(G7) to DMSO and J101, respectively. (MOV) Click here for additional data file.
📊 Figures
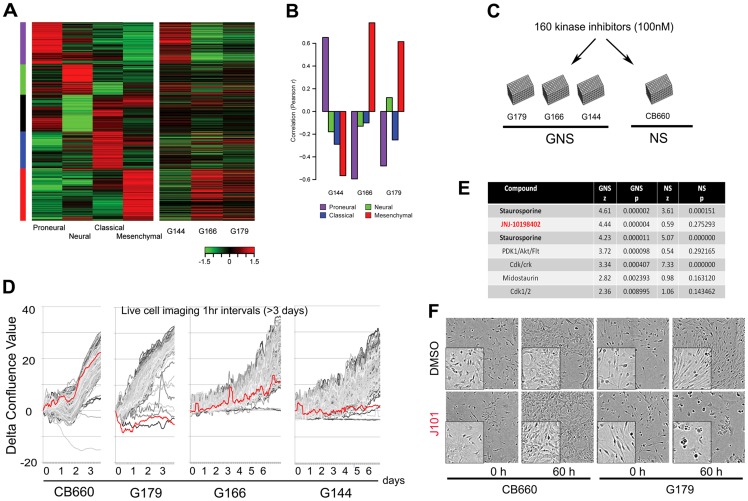
Figure 1
Live-cell imaging screen to determine responses of 160 kinase inhibitors against normal and glioblastoma-derived neural stem cells.
(A) Glioblastoma subtype gene expression signatures established Verhaak et al. [7] (left panel) were assessed in a set of GNS cell lines (right panel). (B) Correlations between subtype centroid values...
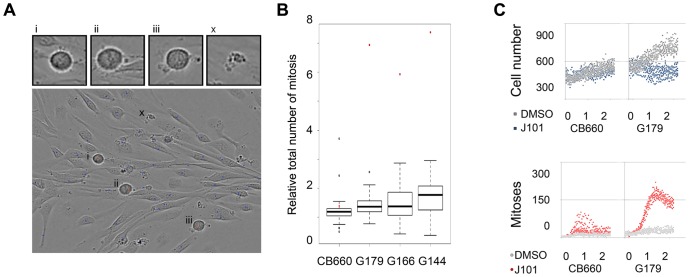
Figure 2
JNJ-10198402 induces mitotic arrest in GNS cells but not in normal NS cells.
(A) Segmentation of phase contrast images with high-content analysis software (CellProfiler & CellProfiler Analyst). Objects were assigned into different classes/bins. Interphase cells (blue) and mito...
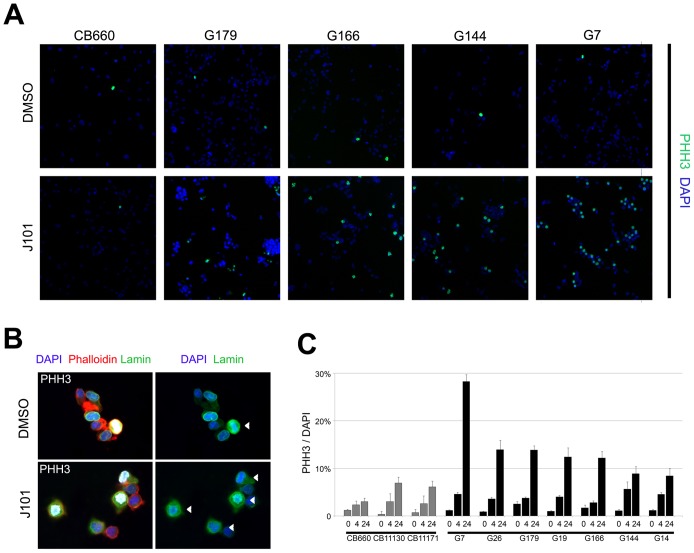
Figure 3
Immunocytochemistry confirms arrest at prometaphase in response to J101.
(A) Phospho-histone H3 (pHH3) staining (green) for CB660, G179, G166, G144 and G7 after following treatment with DMSO or J101 (100 nM) for 24 h with nuclear counterstaining using DAPI (blue). (B) Mito...
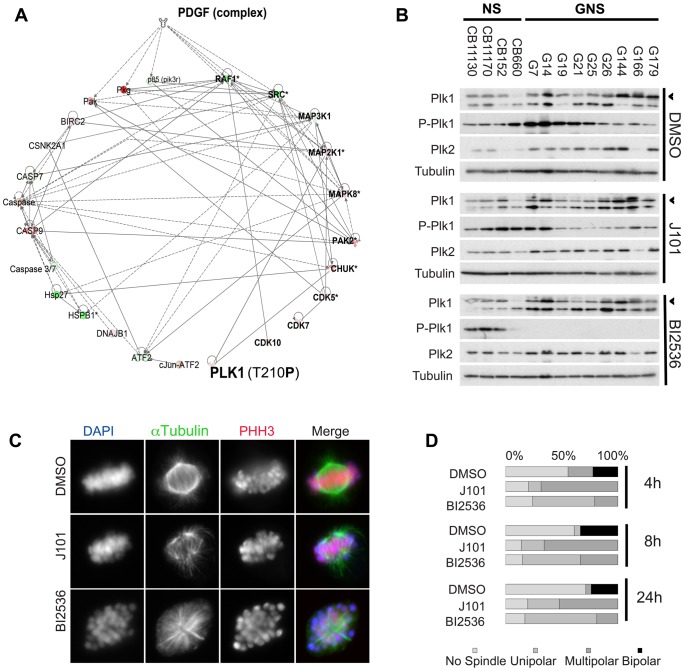
Figure 4
GNS cells arrest at prometaphase due to loss of Plk1 activity and failure of spindle assembly.
(A) 812 (550 pan- and 262 phospho-specific) proteins were assessed before and after drug treatment by antibody microarrays. Significant hits are shown and their suggested interactions presented follow...
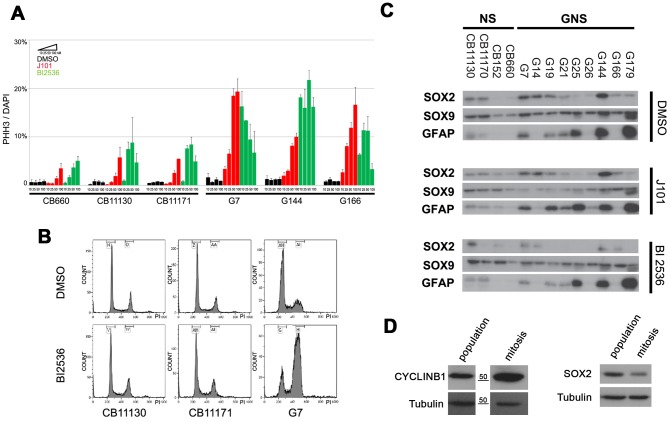
Figure 5
BI 2536, a potent and selective PLK1 inhibitor, disrupts GNS cell proliferation but does not trigger astrocyte differentiation.
(A)Dose responses to J101 and BI2536 for three different NS and GNS cell lines, assayed using pHH3 immunocytochemistry 24 h after treatment. (B) Cell cycle profiles of BI 2536-treated NS and GNS cells...
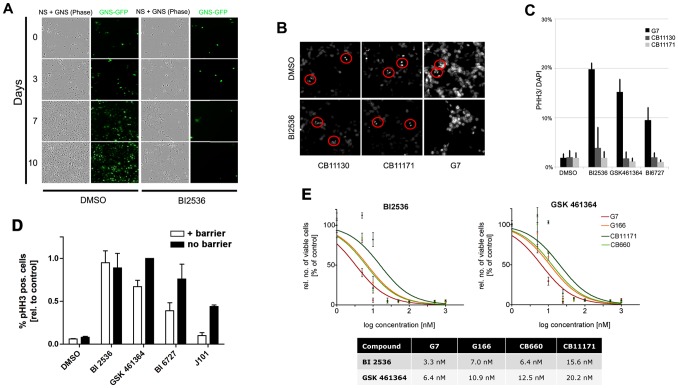
Figure 6
Alternative Plk1 inhibitors in clinical development compare favourably with BI 2536 in selectivity against GNS cells and blood-brain barrier permeability.
(A) Co-culture of equal numbers of GFP-transfected G144 cell lines together with wild-type CB660 cells. In the presence of BI2536 GNS cells are selectively lost in the culture, while normal NS cells c...
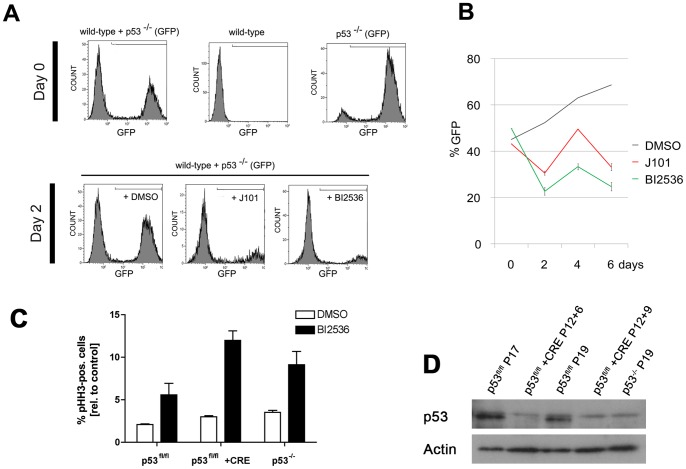
Figure 7
p53 null mouse NS cells display increased sensitivity to Plk1 inhibitors.
(A) Wild-type and GFP positive p53 u2212/u2212 mouse NS cells were co-cultured in equal numbers. Both J101 and BI2536 preferentially affect GFP-positive p53 mutant cells. (B) Quantification of flow cy...
Figure images are served from the NIH/NLM PubMed Central Open Access Subset or Europe PMC; copyright remains with the publishers and authors.
💬 Discussion
0 commentsNo comments yet. Be the first to start a discussion!
Leave a Comment