Abstract
The epidermal growth factor receptor (EGFR) is a receptor tyrosine kinase that couples the binding of extracellular ligands, such as EGF and transforming growth factor-α (TGF-α), to the initiation of intracellular signaling pathways. EGFR binds to EGF and TGF-α with similar affinity, but generates different signals from these ligands. To address the mechanistic basis of this phenomenon, we have carried out cryo-EM analyses of human EGFR bound to EGF and TGF-α. We show that the extracellular module adopts an ensemble of dimeric conformations when bound to either EGF or TGF-α. The two extreme states of this ensemble represent distinct ligand-bound quaternary structures in which the membrane-proximal tips of the extracellular module are either juxtaposed or separated. EGF and TGF-α differ in their ability to maintain the conformation with the membrane-proximal tips of the extracellular module separated, and this conformation is stabilized preferentially by an oncogenic EGFR mutation. Close proximity of the transmembrane helices at the junction with the extracellular module has been associated previously with increased EGFR activity. Our results show how EGFR can couple the binding of different ligands to differential modulation of this proximity, thereby suggesting a molecular mechanism for the generation of ligand-sensitive differential outputs in this receptor family.
🔬 Techniques
🧬 Organisms
💻 Software
✨ Fluorophores
🧪 Sample Preparation
🔬 Cell Lines
🏭 Microscope Brands
🧪 Reagent Suppliers
📷 Detectors
💻 Software Details
💾 Data Repositories
🏛️ Research Organizations (ROR)
Affiliated research institutions:
📋 Methods
Cell culture Insect cells Spodoptera frugiperda
Sf9 cells were maintained as suspension cultures at 27 °C in ESF-921 Insect Cell Culture Medium (Expression Systems).
Isolation of bacmid
DNA, transfection of Sf9 cells, and amplification of baculovirus were performed following the protocols detailed in the Bac-to-Bac Baculovirus Expression System (ThermoFisher Scientific). Mammalian cells Human HEK293S GnTI - cells were cultured as suspension at 37 °C in FreeStyle293 expression medium (Invitrogen) supplemented with 2 % (vol/vol) FBS, in the presence of 8 % CO 2 . The HEK293S GnTI - suspension cells were maintained between 0.2 and 3 × 10 6 cells/ml. HEK293T and HEK293FT cells were cultured at 37 °C in complete Dulbecco’s modified Eagle’s medium (DMEM) supplemented with GlutaMAX (ThermoFisher) and 10 % (vol/vol) FBS, in the presence of 5 % CO 2 . Cell line sources Human HEK293T (ATCC CRL-3216), Human HEK293S GnTI- (ATCC CRL-3022), Spodoptera frugiperda Sf9 (ATCC CRL-1711). All the cell lines are authenticated and tested by manufacturer for mycoplasma contamination. No additional test was performed by the authors of this study. No commonly misidentified lines were used. Full-length EGFR protein expression and purification for Cryo-EM studies Protein expression A cDNA fragment encoding full-length human EGFR (UniProt accession no. P00533 ) was cloned into the pEG_BacMam vector ( Goehring et al., 2014 ). To facilitate affinity purification, a FLAG-tag (with sequence DYKDDDDK) was inserted after the signal sequence of EGFR. To monitor protein expression and to reduce non-specific degradation of the C-terminal tail of EGFR, EGFP was fused after the C-terminus of EGFR. An oncogenic EGFR variant (L834R) was generated by site-directed mutagenesis. Plasmid DNA carrying the EGFR sequence was transformed into DH10Bac competent cells (ThermoFisher Scientific) to produce the bacmid DNA, following the protocol detailed in the Bac-to-Bac Baculovirus Expression System. To produce the recombinant baculovirus, purified bacmid DNA was transfected into Sf9 cells using Cellfectin II (ThermoFisher Scientific). After two rounds of amplification, the recombinant baculovirus was used to infect HEK293S GnTI - cells at a 1:20 (vol/vol) ratio. After 24 hr, the infected HEK293S GnTI - suspension culture was supplemented with 2 μM of Erlotinib, an EGFR inhibitor, and 8 mM sodium butyrate, for optimal protein expression and stability. Cells were harvested by centrifugation 72 hr after the infection.
Show full methods section
Cell culture Insect cells Spodoptera frugiperda
Sf9 cells were maintained as suspension cultures at 27 °C in ESF-921 Insect Cell Culture Medium (Expression Systems).
Isolation of bacmid
DNA, transfection of Sf9 cells, and amplification of baculovirus were performed following the protocols detailed in the Bac-to-Bac Baculovirus Expression System (ThermoFisher Scientific). Mammalian cells Human HEK293S GnTI - cells were cultured as suspension at 37 °C in FreeStyle293 expression medium (Invitrogen) supplemented with 2 % (vol/vol) FBS, in the presence of 8 % CO 2 . The HEK293S GnTI - suspension cells were maintained between 0.2 and 3 × 10 6 cells/ml. HEK293T and HEK293FT cells were cultured at 37 °C in complete Dulbecco’s modified Eagle’s medium (DMEM) supplemented with GlutaMAX (ThermoFisher) and 10 % (vol/vol) FBS, in the presence of 5 % CO 2 . Cell line sources Human HEK293T (ATCC CRL-3216), Human HEK293S GnTI- (ATCC CRL-3022), Spodoptera frugiperda Sf9 (ATCC CRL-1711). All the cell lines are authenticated and tested by manufacturer for mycoplasma contamination. No additional test was performed by the authors of this study. No commonly misidentified lines were used. Full-length EGFR protein expression and purification for Cryo-EM studies Protein expression A cDNA fragment encoding full-length human EGFR (UniProt accession no. P00533 ) was cloned into the pEG_BacMam vector ( Goehring et al., 2014 ). To facilitate affinity purification, a FLAG-tag (with sequence DYKDDDDK) was inserted after the signal sequence of EGFR. To monitor protein expression and to reduce non-specific degradation of the C-terminal tail of EGFR, EGFP was fused after the C-terminus of EGFR. An oncogenic EGFR variant (L834R) was generated by site-directed mutagenesis. Plasmid DNA carrying the EGFR sequence was transformed into DH10Bac competent cells (ThermoFisher Scientific) to produce the bacmid DNA, following the protocol detailed in the Bac-to-Bac Baculovirus Expression System. To produce the recombinant baculovirus, purified bacmid DNA was transfected into Sf9 cells using Cellfectin II (ThermoFisher Scientific). After two rounds of amplification, the recombinant baculovirus was used to infect HEK293S GnTI - cells at a 1:20 (vol/vol) ratio. After 24 hr, the infected HEK293S GnTI - suspension culture was supplemented with 2 μM of Erlotinib, an EGFR inhibitor, and 8 mM sodium butyrate, for optimal protein expression and stability. Cells were harvested by centrifugation 72 hr after the infection.
Protein purification
Harvested cells were resuspended in lysis buffer (25 mM Tris pH 8.0, 150 mM NaCl, 2 μM Erlotinib and cOmplete Protease Inhibitor Cocktail (Roche)) and were lysed by sonication in pulse mode for 10 min, with 2 s intervals between each 1 s pulse. Large debris and unbroken cells were removed from the crude lysate by centrifugation for 12 min at 19,000 g. The membrane fraction was pelleted by ultra-centrifugation at 190,000 g for 1 hr and resuspended in lysis buffer. To extract EGFR from the membrane, 1 % DDM (Dodecyl-β-D-Maltoside, Anatrace) and 0.1 % CHS (Cholesteryl Hemisuccinate, Anatrace) were added to the suspended membrane fraction. After mixing for 2 hr at 4 °C, detergent solubilized proteins were collected by ultra-centrifugation at 190,000 g for 30 min. The supernatant was incubated with Anti-FLAG M2 Affinity agarose gel (Sigma-Aldrich) for 4 hr at 4 °C. The gel was washed with lysis buffer supplemented with 0.05 % DDM and 0.005 % CHS. EGFR was eluted from the gel by lysis buffer containing 0.16 mg/ml FLAG peptide, 0.05 % DDM and 0.005 % CHS. Affinity-purified full-length EGFR was concentrated to 50 μM and treated with 100 μM human EGF (Novoprotein) or TGF-α (Sino Biological) for at least 5 min on ice, before further fractionation by size-exclusion chromatography using a Superose 6 Increase 10/300 GL column (GE Healthcare), with buffer containing 25 mM Tris pH 8.0, 150 mM NaCl, 2 μM Erlotinib, 0.02 % DDM and 0.002 % (CHS). The peak fractions containing ligand-bound dimeric EGFR were collected and immediately used for reconstitution and the reconstituted receptor was applied to EM grids. The fractions were also flash-frozen in liquid nitrogen and used for reconstitution at later times. Freezing and thawing the fractions more than once leads to deterioration in cryo-EM sample quality. Reconstitution of ligand-bound full-length EGFR complex Reconstitution into lipid nanodiscs Purified protein complexes of EGFR bound to EGF or TGF-α were reconstituted into lipid nanodiscs as previously described, with modifications ( Ritchie et al., 2009 ). Briefly, membrane scaffold proteins MSP1D1 and MSP1E3D1 were expressed and purified from Escherichia coli . 10 mg soybean PC (L-α-phosphatidylcholine (soy), Avanti) dissolved in chloroform was dried using nitrogen stream and residual chloroform was further removed by desiccation under vacuum overnight. Rehydration buffer containing 25 mM Tris pH 8.0, 150 mM NaCl, 0.2 mM DTT, 1 % DDM and 1 % sodium cholate was added to the dried lipid and vortexed briefly, resulting in a semi-clear solution at 10 mM lipid concentration. After three cycles of freezing (in liquid nitrogen)-and-thawing (warm water bath), the lipid solution was bath sonicated for 1 hr. The resulting clear lipid stock (10 mM) was immediately used for lipid nanodiscs assembly or stored at –80 °C in small aliquots. Purified complexes of EGFR bound to EGF or TGF-α (~10 μM, solubilized in 0.02 % DDM and 0.002 % CHS) was supplemented with 20 μM extra EGF or TGF-α to keep the ligand-binding site on the receptor saturated, before it was mixed with the soybean PC stock and membrane scaffold proteins at molar ratios of 1:6:240 (EGFR monomer:MSP1D1:soy PC) and 1:6:600 (EGFR monomer:MSP1E3D1:soy PC). The reaction mixture (~500 μl) was incubated on ice for 30 mins, before 20 mg Bio-beads SM2 absorbent (Bio-Rad) were added to initiate the removal of detergents from the mixture and to start the nanodiscs assembly process. The mixture was incubated at 4 °C by continuous rotation. After 1 hr, a second batch of Bio-beads (20 mg) was added to the mixture to replace the first batch, and the sample was incubated for overnight at 4 °C. A third and final batch of Bio-beads (20 mg) was added to replace the second batch, 2 hrs before the reconstitution mixture was cleared by removing the Bio-beads through centrifugation. After another centrifugation at 14,000 rpm for 10 min, the reconstitution mixture was fractionated by size-exclusion chromatograph using Superose 6 Increase 10/300 GL column (GE Healthcare) in detergent-free buffer containing 25 mM Tris pH 8.0, 150 mM NaCl and 5 μM Erlotinib. The peak fraction corresponding to dimeric EGFR:ligands complexes reconstituted in lipid nanodisc was collected and analyzed by SDS-PAGE, before being applied to negative-stain and cryo-EM grids. Reconstitution into amphipols Samples containing purified complexes of EGFR bound to EGF or TGF-α (~10 μM, solubilized in 0.02 % DDM and 0.002 % CHS) were supplemented with 20 μM extra EGF or TGF-α, before the amphipol A8-35 (Anatrace) was added to reach a mass ratio of 1:3 (EGFR:A8-35). After incubation at 4 °C overnight, free amphipol molecules were removed by size-exclusion chromatography using a Superose 6 Increase 10/300 GL column in detergent-free buffer containing 25 mM Tris pH 8.0, 150 mM NaCl and 5 μM Erlotinib. Peak fractions corresponding to the reconstituted EGFR:ligand complexes in amphipol were analyzed by SDS-PAGE, before EM studies. Reconstitution into peptidiscs Samples containing purified complexes of EGFR bound to EGF or TGF-α (~10 μM, solubilized in 0.02 % DDM and 0.002 % CHS) were supplemented with 20 μM extra EGF or TGF-α, before the addition of NSP r peptide ( Carlson et al., 2018 ) to the samples at a mass ratio of 1:1.5 (EGFR:NSP r peptide). After overnight incubation at 4 °C, the sample was fractionated using a Superose 6 Increase 10/300 GL column (detergent-free buffer: 25 mM Tris pH 8.0, 150 mM NaCl and 5 μM Erlotinib) and free NSP r peptides were removed during fractionation. Peak fractions corresponding to the reconstituted EGFR:ligand complexes in peptidiscs were analyzed by SDS-PAGE, before applied to EM grids.
Preparation of electron microscopy
(EM) grids and data acquisition For negative-stain EM, a 5 μL sample of reconstituted full-length human EGFR (~0.05 mg/mL protein in 25 mM Tris pH 8.0, 150 mM NaCl and 2 μM Erlotinib) was placed on the continuous-carbon side of a glow-discharged copper grid (Ted Pella, Redding, CA, USA), and the excess sample was removed by wicking with filter paper after 1 min incubation. The bound particles were stained by floating the grids on four consecutive 30 μL droplets of freshly prepped 2 % uranyl formate solution and incubating the grids with each droplet for 15 s. The excess stain was removed by blotting with filter paper and the grids were air-dried for at least 5 min. Images of negative-stained full-length human EGFR reconstituted in lipid nanodisc, amphipol, and peptidisc were recorded on a 4049 × 4096 pixels CMOS camera (TVIPS TemCam-F416) using the automated Leginon data collection software ( Suloway et al., 2005 ). Samples were imaged using a Tecnai 12 transmission electron microscope (FEI, Hillsboro, OR, USA) at 120 keV with a nominal magnification of 49,000 x (2.18 Å calibrated pixel size at the specimen level) using a defocus range of –0.8 to –1.5 μm. All data were acquired under low dose conditions, allowing a dose at around 35 e - /Å 2 . For cryo-EM, UltrAuFoil R 1.2/1.3 300 mesh grids (Electron Microscopy Sciences, Q350AR13A) were rendered hydrophilic by pretreatment with a O 2 /H 2 gas mixture using a Solarus 950 plasma cleaning system (Gatan, Inc, Pleasanton, CA) for 15 s at 50 W. After application of 3 µL sample of reconstituted full-length human EGFR (~0.5 mg/ml protein in 25 mM Tris pH 8.0, 150 mM NaCl and 2 uM Erlotinib), grids were plunge-frozen using a Leica EM GP (Leica Microsystems Inc, Buffalo Grove, IL) with blotting time of 8 s, chamber temperature and humidity of +4 °C and 95%, and a liquid ethane temperature of –184 °C. The grids were imaged using a Titan Krios transmission electron microscope (Thermo Fisher Scientific, Waltham, MA) operated at 300 kV. Images were recorded on a K3 camera (Gatan, Inc) operated in super-resolution counting mode with a physical pixel size of 0.54 Å. The detector was placed at the end of a GIF Quantum energy filter (Gatan, Inc), operated in zero-energy-loss mode with a slit width of 20 eV. Due to strongly preferred particle orientations, all movies were collected at 40° tilt, at a nominal magnification of 81,000 x and a defocus range between –0.75 and –1.5 µm., using the automated data collection software Latitude (Gatan, Inc). The nominal dose per frame was ~1 e - /Å 2 and the total dose per movie is ~50 e - /Å 2 . For the full-length EGFR:EGF complex reconstituted in peptidiscs, a total of 4331 movies were collected. For the full-length EGFR:TGF-α complex reconstituted in peptidiscs, a total of 7406 movies were collected. For the full-length EGFR(L834R):EGF complex reconstituted in peptidiscs, a total of 5013 movies were collected.
EM image processing
For negative-stain EM images of full-length EGFR:EGF complexes reconstituted in lipidic nanodiscs (MSP1E3D1), the initial image processing and classification steps were performed using the Appion image processing environment ( Lander et al., 2009 ). Particles were first selected from micrographs using DoG Picker ( Voss et al., 2009 ). The contrast transfer functions (CTFs) of the micrographs were estimated using the CTFFIND3 ( Mindell and Grigorieff, 2003 ). CTF correction of the micrographs was performed by Wiener filter using ACE2 ( Mallick et al., 2005 ). A total of 112,408 particles were extracted using a 192 × 192 box size and binned by a factor of 2. Each particle was normalized to remove pixels whose values were above or below 4.5 σ of the mean pixel value using the XMIPP normalization program ( Scheres et al., 2008 ). In order to remove incorrectly selected protein aggregates or other artifacts, particles with extreme intensity values were removed. The remaining 84,260 particles were subjected to 2D iterative reference-free alignment and classification using IMAGIC multi-reference alignment (MRA) and a topology-representing network classification ( van Heel et al., 1996 ; Ogura et al., 2003 ), to produce the 200 2D class averages. For Cryo-EM images of full-length EGFR:EGF complex reconstituted in peptidiscs, Extended Data Figure 3 shows a summary of the image processing workflow. In brief, movies were motion-corrected using the MotionCor2 wrapper ( Zheng et al., 2017 ) in Relion3 ( Zivanov et al., 2018 ). Corrected micrographs were imported to cryoSPARC v2 ( Punjani and Fleet, 2020 ; Punjani et al., 2017 ) for further processing. After local CTF determination using Patch-Based CTF Estimation, a total of 4,234,635 particles from 4,431 micrographs were automatically selected using template-free Blob_picker and were extracted with a box size of 320 × 320 pixels. Due to strongly preferred particle orientations, a relatively low threshold value was used during the particle picking to include particles with less contrast than the preferred views. The majority of the initial 4,234,635 picks are from the background. After iterative 2D classification, most of the background particles were removed based on 2D class averages. The remaining 1,587,872 particles were further cleaned-up by ab-initio reconstruction into four classes. The resulting 3D maps showed that 3 of the ab-initio reconstruction classes were mostly ‘junk’ particles without recognizable structural features, and the other class showed clear resemblance to the dimeric extracellular module of EGFR. This clean class of particles (814,089) were selected and subjected to a final round of 2D classification. After visual inspection of the final 2D class averages, 765,883 particles were retained and ab-initio reconstruction was performed to generate the initial model, which was used as the reference for a round of homogeneous refinement as well as a non-uniform refinement ( Punjani et al., 2019 ). Based on the gold-standard Fourier shell correlation (FSC) 0.143 criterion, the overall resolution of the reconstructions from homogeneous refinement and non-uniform refinement are determined as 3.0 Å and 2.9 Å, respectively. After visual inspection of both reconstructions, the map generated from non-uniform refinement with better quality was chosen for further analysis and used as the reference in the subsequent round of heterogeneous refinement (3D classification) using the 765,883 particles, resulting in 10 classes. A final round of homogeneous refinement and non-uniform refinement were performed for each of the resulting 10 classes from the heterogeneous refinement run. After visual inspection, the 10 maps resulting from non-uniform refinement were chosen for model building and refinement for each class. The overall resolution of these 10 maps ranges between 3.1 Å and 3.7 Å.
Cryo-EM data processing of full-length
EGFR(L834R):EGF complex and full-length EGFR:TGF-α complex reconstituted in peptidiscs followed similar procedures described above. For full-length EGFR(L834R):EGF complex, after local CTF estimation by Patch-Based CTF Estimation, a total of 3,250,237 particles were automatically picked by Blob_Picker. After iterative 2D classification and ab-initio reconstruction, background and spurious particles were removed. 987,367 cleaned particles were subjected to homogeneous as well as non-uniform refinement, using the initial model generated from ab initio reconstruction as reference. After visual inspection, the map generated by non-uniform refinement (overall resolution: 3.0 Å) was chosen as the reference for the subsequent heterogeneous refinement, resulting in 10 classes. A final round of non-uniform refinement was performed for each of the 10 classes and the resulting 10 maps were used for model building and refinement. The resolutions of these 10 maps were determined to be in the range of 3.2–4.2 Å. For the full-length EGFR:TGF-α complex, a total of 6,846,834 particles were initially picked by Blob_Picker. Iterative 2D classification and ab-initio reconstruction were performed to remove background and spurious particles, and 1,019,024 cleaned particles were retained. These cleaned particles were subjected to homogeneous refinement and non-uniform refinement. The map resulting from non-uniform refinement was at an overall resolution of 3.2 Å and it was used as the reference for the subsequent heterogeneous refinement, resulting in 10 classes. A final round of non-uniform refinement was performed for each of the 10 classes and the resulting 10 maps were determined at resolutions between 3.4 Å and 3.9 Å. These maps were used for model building and refinement. 3D variability analysis, local resolution estimation, and B-factor sharpening of all refined maps were performed using the cryoSPARC v2.
Model building and refinement
To generate models for different conformations of the EGFR(WT):EGF and EGFR(L834R):EGF complexes, a crystal structure of the isolated EGFR extracellular module bound to EGF (PDB code: 3NJP) was split into four fragments: two heads and two legs. The two heads contain EGFR residues 1–500 and EGF residues 5–51 from each side of the dimeric structure, respectively. The two legs contain EGFR residues 501–614 from each EGFR molecule, respectively. These four fragments were fit into the reconstructed cryo-EM maps of the EGFR(WT):EGF and EGFR(L834R):EGF complexes, using UCSF Chimera ( Pettersen et al., 2004 ). UCSF chimera-fitted models were subjected to one round of real-space refinement ( Afonine et al., 2018 ) in Phenix ( Liebschner et al., 2019 ). To prevent overfitting due to the lower local resolution in the map region corresponding to the flexible Domain IV legs, the coordinates of the flexible Domain IV leg was not refined against the cryo-EM maps. The models were manually adjusted in Coot ( Emsley et al., 2010 ), followed by iterative rounds of real-space refinement in Phenix and manual fitting in Coot. Model quality was assessed using the comprehensive model validation tools from Phenix ( Figure 3—source data 1 ). All maps and models were visualized using UCSF Chimera and PyMOL (The PyMOL Molecular Graphics System, Version 2.0 Schrödinger, LLC). Similar procedures were followed to generate models for the different conformations of the EGFR:TGF-α complex, except that a crystal structure of the truncated EGFR extracellular domains bound to TGF-α (PDB code: 1MOX) was used to generate the fragments of the heads for the initial model fitting in UCSF Chimera.
Molecular dynamics simulations
System preparation for molecular dynamics simulations of extracellular module We built a system comprising of the extracellular module bound to EGF starting from the crystal structure (PDB code: 3NJP Lu et al., 2010 ). The N-terminal ends of each EGFR subunit are the true termini and were left uncapped. The C-terminal ends of EGFR were capped with a methyl group. In the crystal structure, four residues are missing from the N-terminal ends of the either ligand, and two residues are missing from the C-terminal ends. We initiated one trajectory starting with these structures while capping the N-terminal ends with acetyl groups and the C-terminal ends with methyl groups. For three other trajectories, we built in the missing residues with PyMOL ( Schrödinger, LLC, 2015 ) and left the termini uncapped in these structures. These systems were solvated such that the water layer extended for 15 Å beyond the longest dimension of the protein, and ions were added such that the ionic strength was 0.15 M with VMD ( Humphrey et al., 1996 ). We built a second system of EGFR bound to TGFα. For this structure, EGFR was taken from the crystal structure 3NJP ( Lu et al., 2010 ), and TGFα was taken from the structure of truncated EGFR bound to TGFα (PDB code: 1MOX Garrett et al., 2002 ). Similar to the system of EGFR bound to EGF, the EGFR subunits were left uncapped at the N-terminal ends and capped at the C-terminal ends. The ligands were uncapped in all the simulations. These systems were solvated such that the water layer extended for 15 Å beyond the longest dimension of the protein and ions were added such that the ionic strength was 0.15 M with VMD ( Humphrey et al., 1996 ). Minimization, equilibration, and production protocols for simulations of extracellular module The energies of each system were minimized, first for a 1000 steps while holding protein atoms fixed, and then for a 1000 steps while allowing all the atoms to move. The systems were then equilibrated, first for one ns while holding all the heavy atoms fixed, then for one ns while holding the protein backbone atoms fixed, and then for one ns without any constraints. The four trajectories for each system were then allowed to run for between ~350 and ~ 550 ns, for a total simulation time of ~1.8 µs for EGFR bound to EGF and ~2.0 µs for EGFR bound to TGF-α. All equilibration and production simulations were carried out at a temperature of 300 K and pressure of 1 atm. System preparation for molecular dynamics simulations of transmembrane helices in POPC membrane We built two systems – the first of the two transmembrane helices (residues 610–653) associating at the N-terminal ends starting from model 1 of the NMR structure (PDB code: 5LV6 Bocharov et al., 2017 ), and the second of the two transmembrane helices (residues 614–653) associating at the C-terminal ends starting from model 6 of the NMR structure (PDB code: 2M0B Bocharov et al., 2016 ). We used the Membrane Builder module on the CHARMM-GUI website ( Jo et al., 2008 ; Wu et al., 2014 ) to insert each protein system into a lipid bilayer comprising of neutral POPC lipids. The x- and y- dimensions of the bilayer was set to 100 Å each. This lipid bilayer comprised of 148 lipids in the upper leaflet, and 146 lipids in the lower leaflet in the N-terminal dimer system, and 142 lipids in each leaflet in the C-terminal dimer system. The N-termini of each protein chain were capped with acetyl groups and the C-termini were capped with methyl groups. The system was solvated such that the solvent layer extended to 20 Å beyond the lipid bilayer on either side, and ions were added such that the ionic strength was 0.1 M, using VMD ( Humphrey et al., 1996 ). The final edge dimensions of these systems were ~103 Å x 103 Å x 118 Å. Minimization, equilibration, and production protocols For each system, first the energy was minimized while holding the protein, waters, ions, and lipid heads fixed, and allowing only the lipid tails to move, for 1000 steps, then while holding the protein and lipid heads fixed for 5000 steps, then while holding only the protein fixed for 1,000 steps, and finally for a 1000 steps while allowing all the atoms to move. This system was then equilibrated using molecular dynamics for five ns while holding the protein fixed, to allow the lipids to relax about the protein. For the N-terminal dimer system, a longer trajectory of 175 ns then was generated from this equilibrated structure, during which all the atoms were allowed to move. During the course of this simulation, the N-terminal ends of the linkers (residues 610–613), which are disordered in this structure, interacted frequently with each other. In the full-length structure, these residues are a part of the ordered region in Domain IV of the extracellular module and would not be available to form such interactions. We therefore deleted these four residues, such that the protein chains started at Thr 614, and capped these N-terminal ends with acetyl groups. The energy of this system was minimized with the same multi-step protocol as before and used to initiate 25 independent molecular dynamics trajectories. For the simulations starting from the C-terminal dimer, in the initial structure the gap between the N-terminal ends is too small to accommodate lipid tails. Additionally, the helices tilt away from each other such that the distance between the Thr 627 residues at the N-terminal ends of the helices changes from ~18 Å to ~23 Å, in order to optimally pack the hydrophobic residues of the protein into the membrane ( Killian and Nyholm, 2006 ). In order the maintain the N-terminal ends of the helices, a multi-step equilibration protocol was used. First, the distance between the Thr 627 residues of either subunit was increased from ~18 Å to ~23 Å over five ns. During this phase, restraints applied to the protein backbone atoms of residues 620–626 to maintain the Ile619-Ala623 association and the 3 10 -helical turn at the N-terminal ends of the helices. The system was equilibrated for another 25 ns with these restraints applied. The system was then run for 20 ns without restraints, to ensure that the N-terminal ends were stable. This structure was then used to start 25 productions runs which ran for 100ns each for a total of 2.5 µs. All equilibration and production simulations were carried out at a temperature of 300 K and pressure of 1 atm. Simulation parameters The NAMD package was used to run the minimization and equilibration simulations ( Phillips et al., 2005 ) with the CHARMM36m force field ( Huang et al., 2017 ). The velocity Verlet algorithm was used to calculate the trajectories of the atoms. A time step of 2 fs was used. Particle Mesh Ewald was used to calculate long-range electrostatic interactions, with a maximum space of 1 Å between grid points ( Darden et al., 1993 ). Long-range electrostatics were updated at every time step. Van der Waals interactions were truncated at 12 Å. Hydrogen atoms bonded to the heavy atoms were constrained using the ShakeH algorithm ( Ryckaert et al., 1977 ). The temperature was controlled with Langevin dynamics with a damping coefficient of 1/ps, applied only to non-hydrogen atoms. Pressure was controlled by the Nose-Hoover method with the Langevin piston, with an oscillation period of 200 fs and a damping time scale of 50 fs ( Feller et al., 1995 ; Martyna et al., 1994 ). Distance and angle variations over the course of the simulations were calculated with the AmberTools20 package ( Case et al., 2020 ). Free energy calculations with umbrella sampling Umbrella sampling simulations ( Torrie and Valleau, 1977 ) were carried out to measure the free energy change as the distance between the Thr614 residues was decreased from 27 Å to 8 Å when the transmembrane helices are in the N-terminal dimer conformation. We performed three umbrella sampling calculations, starting from initial paths generated from three different steered molecular dynamics simulations. For each umbrella sampling calculation, 20 windows of simulations were run, where each window was separated by 1 Å, and the starting structure in each window had distances between Thr614 distances ranging from 8 Å to 27 Å. A force constant of 1 kcal.mol –1 .Å –2 was used to maintain the distance between Thr 614 residues in each window, using the colvars module ( Fiorin et al., 2013 ). Two of the umbrella sampling simulations converged over 60 ns while the third converged over 90 ns. The biased probability distribution thus generated was reweighted and the free energy change was calculated using the Weighted Histogram Analysis Method ( Kumar et al., 1992 ) using the implementation provided by Alan Grossfield ( Grossfield, 2010 ).
Western-blot analysis of EGFR autophosphorylation with purified EGFR proteins
Expression and purification of FLAG-tagged full-length human
EGFR from HEK293FT cells
A cDNA fragment encoding full-length human EGFR (UniProt accession no. P00533 ) was cloned into the pEGFP-N1 plasmid (Clontech, Mountain View, CA). To facilitate affinity purification, a FLAG-tag (with sequence DYKDDDDK) was inserted after the signal sequence of EGFR. To monitor protein expression and to reduce non-specific degradation of the C-terminal tail of EGFR, EGFP was fused after the C-terminus of EGFR. HEK293FT cells were transfected with the plasmid using FuGENE6 (Promega). After 24 hr, 10 mM sodium butyrate was added to the culture medium. The cells were harvested from culture dishes 36 hr after transfection and were resuspended in lysis buffer (25 mM Tris pH 8.0, 150 mM NaCl, and cOmplete Protease Inhibitor Cocktail). To extract EGFR from the membrane, 1 % DDM and 0.1 % CHS were added to the cell suspension. After mixing for 1 hr at 4 °C, detergent solubilized proteins were collected by ultra-centrifugation at 190,000 g for 40 min. The supernatant was incubated with Anti-FLAG M2 Affinity agarose resin for at least 4 hr at 4 °C and was applied to a Micro Bio-Spin column. The resin was washed with lysis buffer supplemented with 0.05 % DDM and 0.005 % CHS. EGFR was eluted from the resin with lysis buffer containing 0.16 mg/ml FLAG peptide, 0.05 % DDM and 0.005 % CHS. Protein concentration was estimated by the band intensities on a SDS-PAGE gel stained with Coomassie Brilliant Blue and by UV absorbance at 280 nm measured using NanoDrop (ThermoFisher).
Western-blot assays using purified EGFR protein ~1 μM purified
EGFR protein prepared as described above, was mixed with ~16 μM EGF or TGF-α in a buffer containing 25 mM Tris pH 8.0, 150 mM NaCl, 10 mM MgCl 2 , 1 mM sodium orthovanadate, and 0.2 mM DTT. The mixture was incubated for 5 minutes, and phosphorylation reactions were initiated by addition of ATP to a final concentration of 1 mM. Reactions were typically carried out at 25 °C. At various time points, aliquots of the reaction solution were mixed with quenching solution, SDS-PAGE loading buffer supplemented with 20 mM EDTA, to achieve final concentration of 1 % SDS and 10 mM EDTA in the quenched solutions. The samples quenched at different time points were run on two 12 % acrylamide SDS-PAGE gels at 250 V, 400 mA for 35 min at room temperature. The first SDS-PAGE gel was stained using Coomassie Brilliant Blue to monitor the total amount of EGFR protein loaded in each lane. The second SDS-PAGE gel was transferred to PVDF membrane using a semi-dry transfer apparatus TRANS-BLOT (Bio-Rad) at 25 V, 150 mA for 40 min at room temperature, in transfer buffer containing 25 mM Tris, 192 mM glycine, 0.02 % SDS, and 10 % Methanol. The PVDF membranes were blocked for 1 hr at room temperature in 5 % (w/v) dry milk dissolved in Tris-buffered saline with 0.1 % Tween-20 (TBST). A pan-phosphotyrosine antibody (pY20, catalog no. sc-12351, Santa Cruz Biotechnology) was diluted (1:2000) with 5 % (w/v) dry milk in TBST and incubated with the membranes at 4 °C overnight. The membranes were then washed three times with TBST, and incubated with horseradish peroxidase (HRP)-conjugated anti-mouse secondary antibody (catalog no. 7074, Cell Signaling Technology) at a 1:3000 dilution in TBST with 5 % dry milk at room temperature for 1 hr. The membranes were then washed three times with TBST, incubated with WesternBright Quantum chemiluminescent reagents (Advansta) for 2 min, and were imaged using ImageLab (Bio-Rad).
Cell-based western-blot assays for EGFR autophosphorylation and Erk phosphorylation
EGFR autophosphorylation in cells N-terminal Flag-tagged full-length human EGFR was cloned into the pEGFP-N1 plasmid. HEK293T cells were transiently transfected with EGFR using polyethylenimine (PEI) in a six-well plate format. Twenty-four hrs after transfection, cells were serum starved overnight (~12 hr) in serum-free medium. For stimulation, cells were incubated with fresh medium without ligand, with EGF (16.7 nM), or with TGF-α (16.7 nM) for 1 hr at 4 °C (on ice). Following ligand stimulation, cells were pelleted and then immediately lysed in ice-cold cell lysis buffer (catalog no. 9803, Cell Signaling Technology) supplemented with cOmplete Protease Inhibitor Cocktail and PhosSTOP phosphatase inhibitors (Roche) for 30 min on ice. Cell lysates were clarified by centrifugation and western-blot analyses were carried out as described above for the purified EGFR proteins. A pan-phosphotyrosine antibody (pY20) was used to detect EGFR autophosphorylation. An anti-FLAG M2 antibody (catalog no. F1804, Sigma-Aldrich) was used to monitor the total amount of EGFR protein in the cell lysate loaded to each lane. Erk phosphorylation in cells N-terminal Flag-tagged full-length human EGFR was cloned into the pEGFP-N1 plasmid. The mutations were introduced by QuikChange site-directed mutagenesis (Stratagene). Twenty-four hr after transfection, HEK293T cells transiently transfected with EGFR and EGFR variants were serum starved overnight (~12 hr) in serum-free medium. For stimulation, cells were incubated with fresh medium without ligand, with EGF (16.7 nM), or with TGF-α (16.7 nM) for 5 min at 37 °C. Following ligand stimulation, cells were immediately placed on ice and then lysed in ice-cold cell lysis buffer supplemented with cOmplete Protease Inhibitor Cocktail and PhosSTOP phosphatase inhibitors for 30 min on ice. Cell lysates were clarified by centrifugation and western blot analyses were carried out as described above. An anti-phospho-Erk antibody (catalog no. 4370, Cell Signaling Technology) is used to detect phosphorylation of p44 and p42 MAP kinase (Erk1 and Erk2). An anti-FLAG M2 antibody was used to monitor the total amount of EGFR protein in the cell lysate loaded to each lane. All western blots were reproduced at least three times and the representative ones were presented.
Minimization, equilibration, and production protocols for simulations of extracellular module The energies of each system were minimized, first for a 1000 steps while holding protein atoms fixed, and then for a 1000 steps while allowing all the atoms to move. The systems were then equilibrated, first for one ns while holding all the heavy atoms fixed, then for one ns while holding the protein backbone atoms fixed, and then for one ns without any constraints. The four trajectories for each system were then allowed to run for between ~350 and ~ 550 ns, for a total simulation time of ~1.8 µs for EGFR bound to EGF and ~2.0 µs for EGFR bound to TGF-α. All equilibration and production simulations were carried out at a temperature of 300 K and pressure of 1 atm.
Minimization, equilibration, and production protocols For each system, first the energy was minimized while holding the protein, waters, ions, and lipid heads fixed, and allowing only the lipid tails to move, for 1000 steps, then while holding the protein and lipid heads fixed for 5000 steps, then while holding only the protein fixed for 1,000 steps, and finally for a 1000 steps while allowing all the atoms to move. This system was then equilibrated using molecular dynamics for five ns while holding the protein fixed, to allow the lipids to relax about the protein. For the N-terminal dimer system, a longer trajectory of 175 ns then was generated from this equilibrated structure, during which all the atoms were allowed to move. During the course of this simulation, the N-terminal ends of the linkers (residues 610–613), which are disordered in this structure, interacted frequently with each other. In the full-length structure, these residues are a part of the ordered region in Domain IV of the extracellular module and would not be available to form such interactions. We therefore deleted these four residues, such that the protein chains started at Thr 614, and capped these N-terminal ends with acetyl groups. The energy of this system was minimized with the same multi-step protocol as before and used to initiate 25 independent molecular dynamics trajectories. For the simulations starting from the C-terminal dimer, in the initial structure the gap between the N-terminal ends is too small to accommodate lipid tails. Additionally, the helices tilt away from each other such that the distance between the Thr 627 residues at the N-terminal ends of the helices changes from ~18 Å to ~23 Å, in order to optimally pack the hydrophobic residues of the protein into the membrane ( Killian and Nyholm, 2006 ). In order the maintain the N-terminal ends of the helices, a multi-step equilibration protocol was used. First, the distance between the Thr 627 residues of either subunit was increased from ~18 Å to ~23 Å over five ns. During this phase, restraints applied to the protein backbone atoms of residues 620–626 to maintain the Ile619-Ala623 association and the 3 10 -helical turn at the N-terminal ends of the helices. The system was equilibrated for another 25 ns with these restraints applied. The system was then run for 20 ns without restraints, to ensure that the N-terminal ends were stable. This structure was then used to start 25 productions runs which ran for 100ns each for a total of 2.5 µs. All equilibration and production simulations were carried out at a temperature of 300 K and pressure of 1 atm.
Additional files Transparent reporting form
📊 Figures
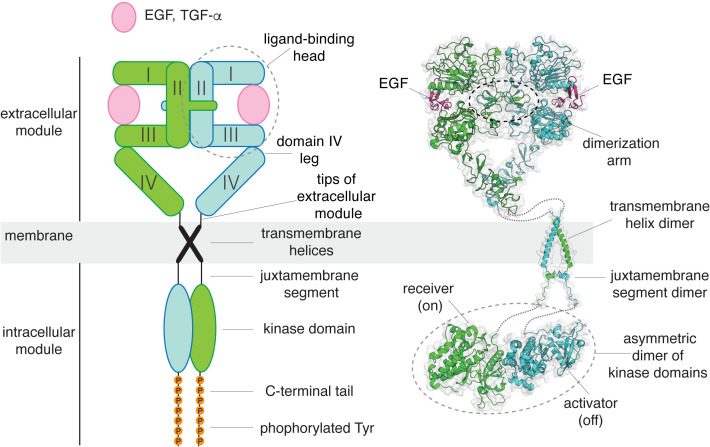
Figure 1.
A structural collage of a ligand-bound EGFR dimer.
Left, a schematic diagram of ligand-bound dimeric EGFR. Right, structures of EGFR fragments, determined previously: a dimeric extracellular module bound to EGF (PDB code: 3NJP Lu et al., 2010 ), a tra...
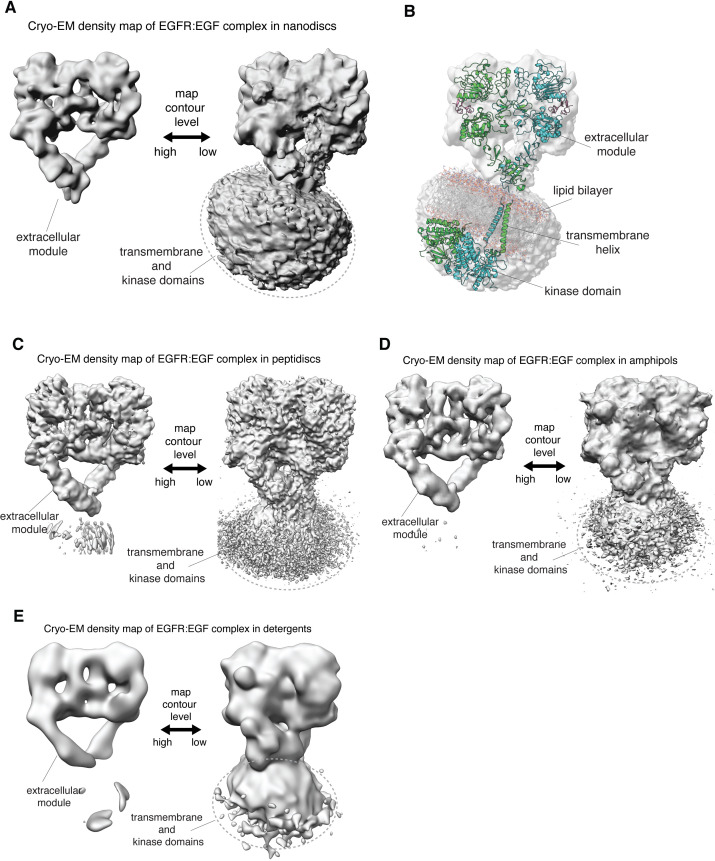
Figure 2.
Linkage between the extracellular module and transmembrane helices in full-length human EGFR is not rigid.
( A, Cu2013E ) In each panel, the cryo-EM density map for a reconstituted full-length EGFR:EGF complex is shown at two contour levels. Note the lack of EM density for the transmembrane and kinase doma...
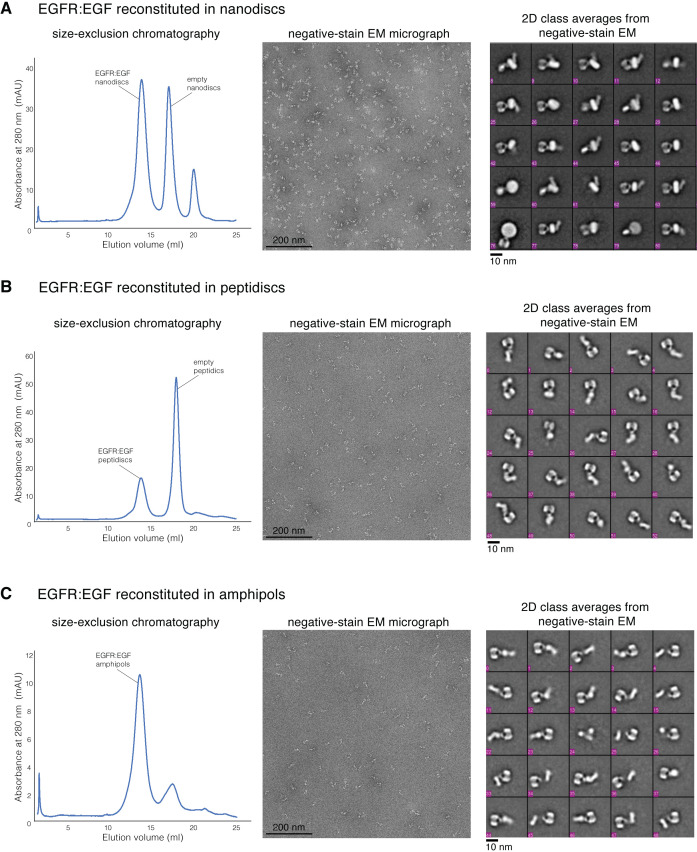
Figure 2u2014figure supplement 1.
Reconstitution of full-length human EGFR:EGF complex.
( A ) Sample preparation of full-length EGFR:EGF reconstituted into nanodiscs. ( B ) Sample preparation of full-length EGFR:EGF reconstituted into peptidiscs. ( C ) Sample preparation of full-length E...
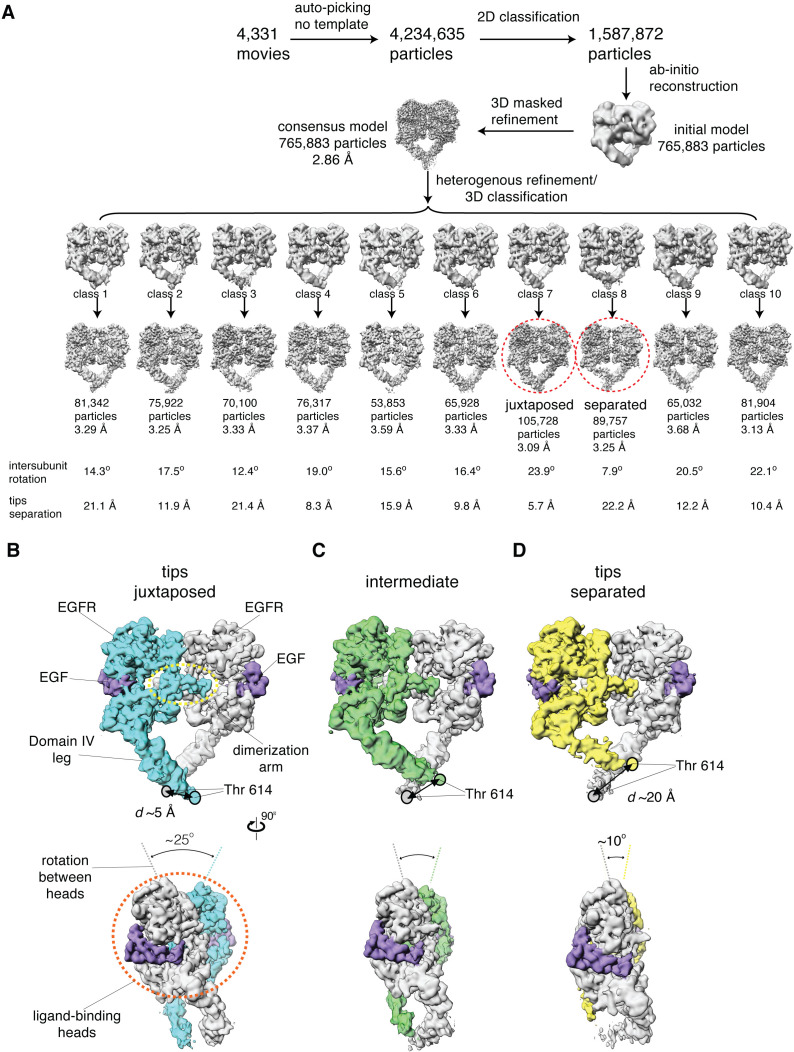
Figure 3.
Cryo-EM analysis reveals a range of conformations for the EGF-bound extracellular module.
( A ) Summary of the cryo-EM data processing workflow for the full-length EGFR:EGF complex reconstituted in peptidiscs. The two extreme conformations of the ensemble, the juxtaposed and the separated,...
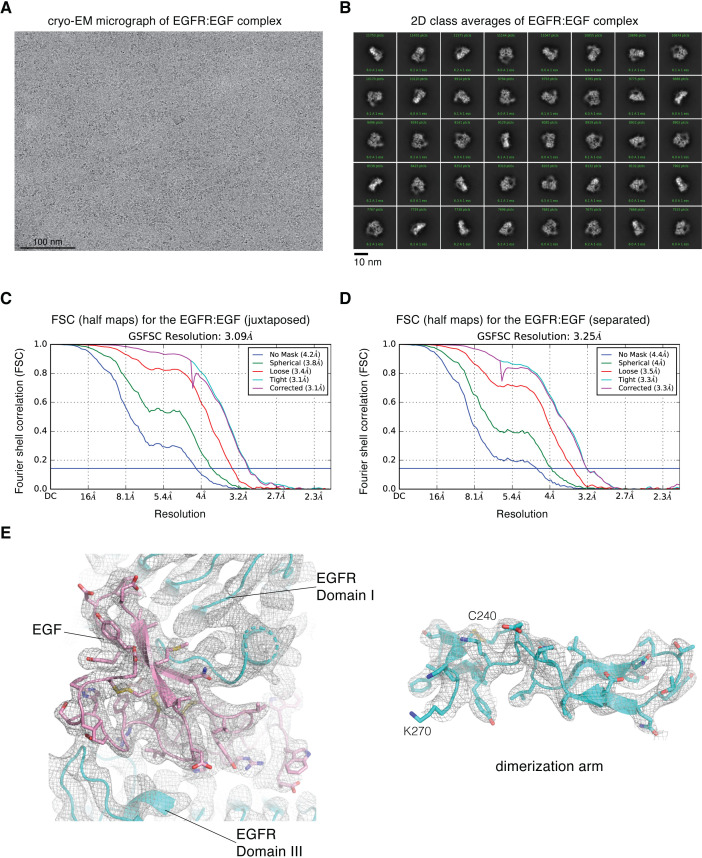
Figure 3u2014figure supplement 1.
Cryo-EM image processing for focused reconstruction on the extracellular module of full-length EGFR:EGF complex reconstituted in peptidiscs.
( A ) Representative cryo-EM micrograph after motion-correction. ( B ) Representative 2D class averages generated from reference-free 2D classification. ( C ) Fourier shell correlation (FSC) curves ou...
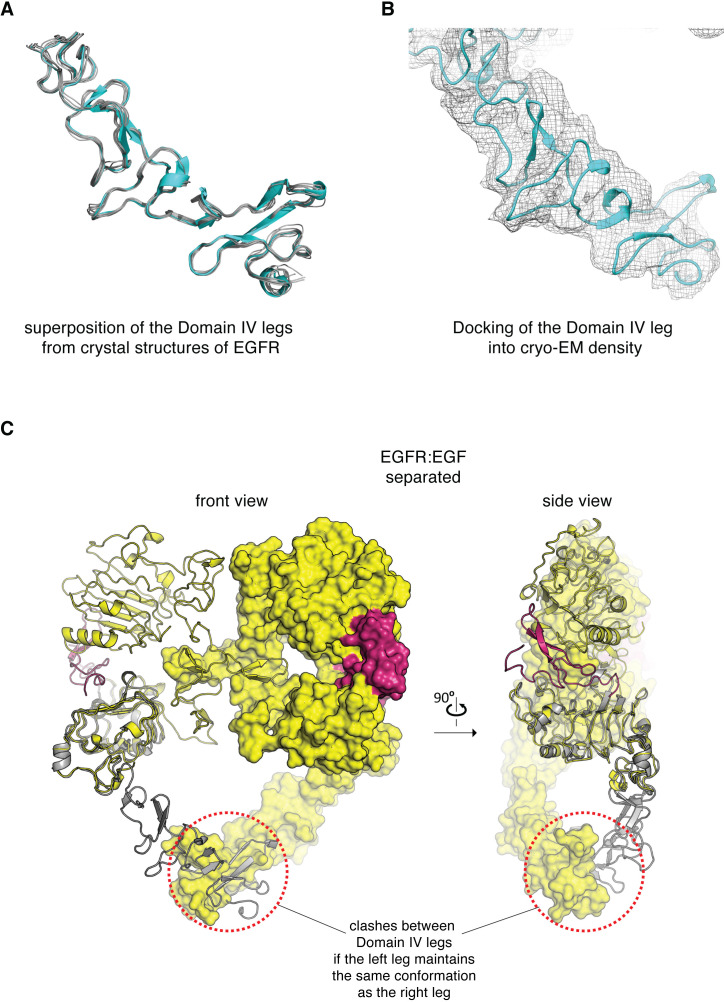
Figure 3u2014figure supplement 2.
Conformation of the Domain IV leg.
( A ) Superposition of the Domain IV leg from the dimeric crystal structure of the isolated EGFR extracellular domains bound to EGF (cyan, PDB code: 3NJP), with the Domain IV legs from seven different...
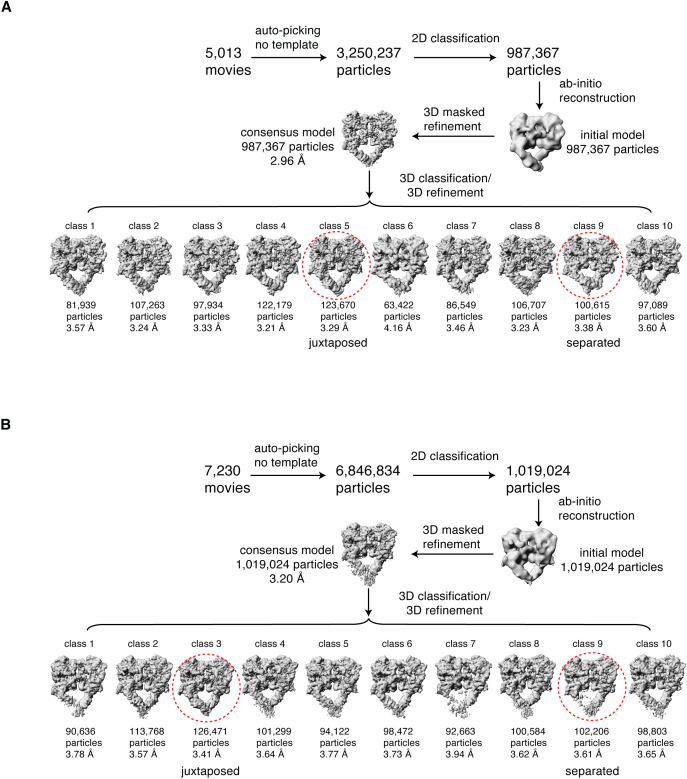
Figure 3u2014figure supplement 3.
Cryo-EM data processing workflow.
Summary of the cryo-EM data processing workflow for the full-length EGFR(L834R):EGF ( A ) and the full-length EGFR:TGF-u03b1 ( B ) complexes reconstituted in peptidiscs. The two extreme conformations ...
Figure 3u2014video 1.
3D variability analysis of the EGFR:EGF complex performed in cryoSPARC v2 ( Punjani and Fleet, 2020 ), shown from the front.
Note the intersubunit rotation between the two heads and the corresponding movement of the Domain IV legs.
Figure 3u2014video 2.
3D variability analysis of the EGFR:EGF complex performed in cryoSPARC v2 ( Punjani and Fleet, 2020 ), shown from the side.
Note the intersubunit rotation between the two heads and the corresponding movement of the Domain IV legs.
Figure 3u2014video 3.
3D variability analysis of the EGFR:EGF complex performed in cryoSPARC v2 ( Punjani and Fleet, 2020 ), shown from the top.
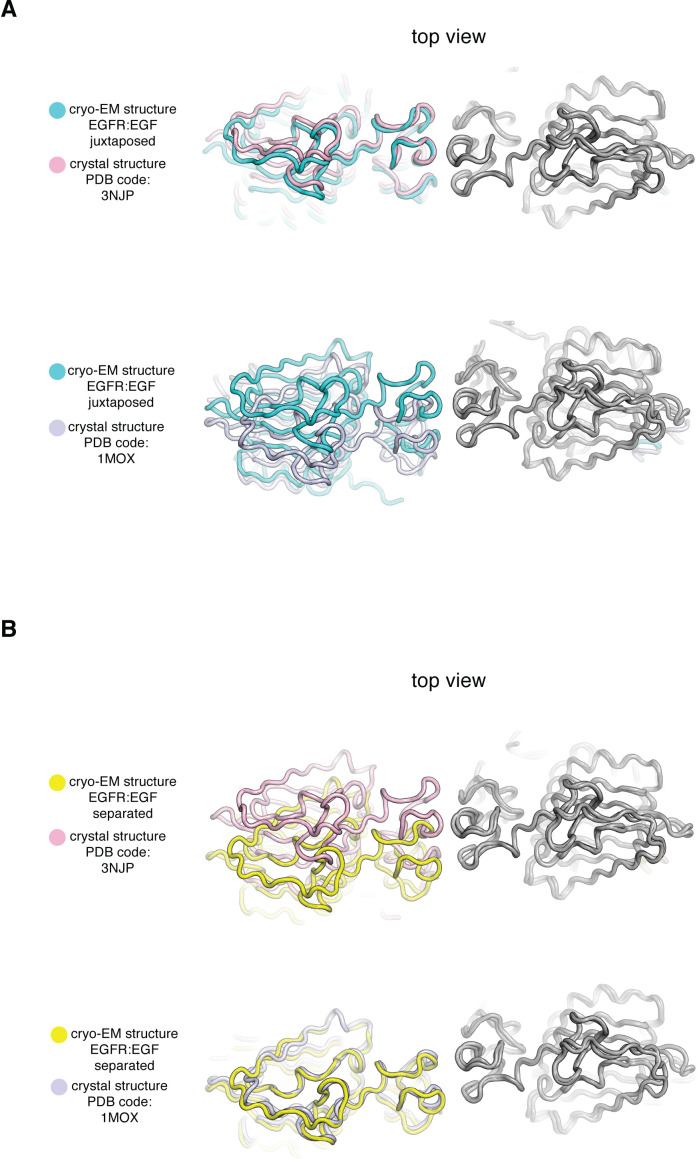
Figure 4.
Comparison of Cryo-EM structures of EGFR:EGF complex in two extreme conformations with previous crystal structures of the ligand-binding head of EGFR bound to EGF and TGF-u03b1.
In each panel, a cryo-EM structure of the extracellular module of the full-length EGFR:EGF complex (juxtaposed or separated) is compared to a crystal structure of the ligand-binding head of EGFR bound...
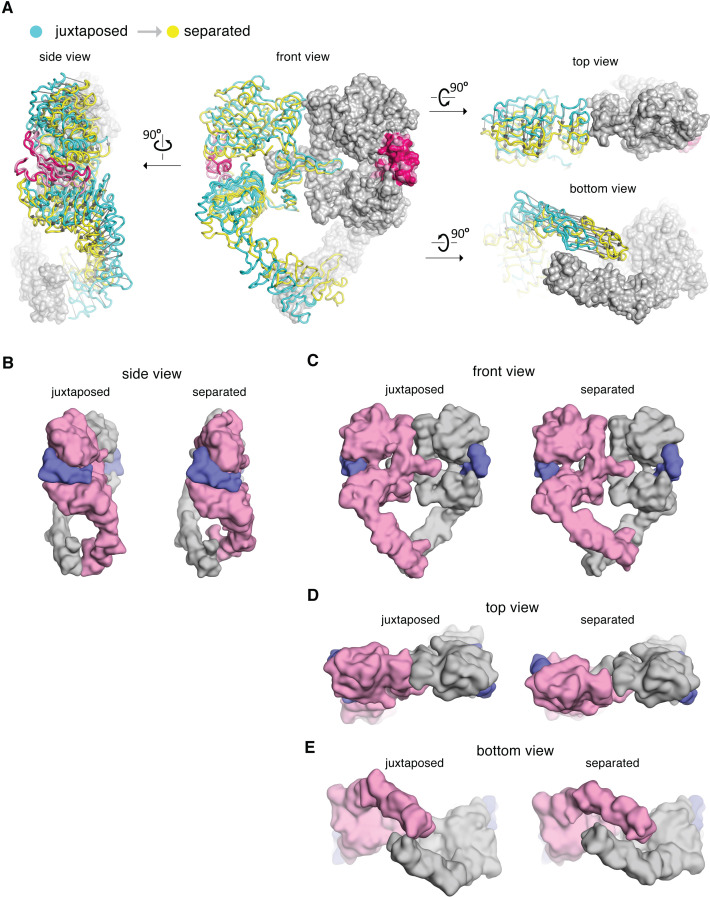
Figure 5.
Comparison between the cryo-EM structures of the juxtaposed and the separated conformations of the extracellular module of the EGFR:EGF complex.
( A ) The cryo-EM structures representing the juxtaposed conformation (cyan) and the separated conformation (yellow) are superimposed on the right-hand EGFR subunits which have similar Domain IV leg c...
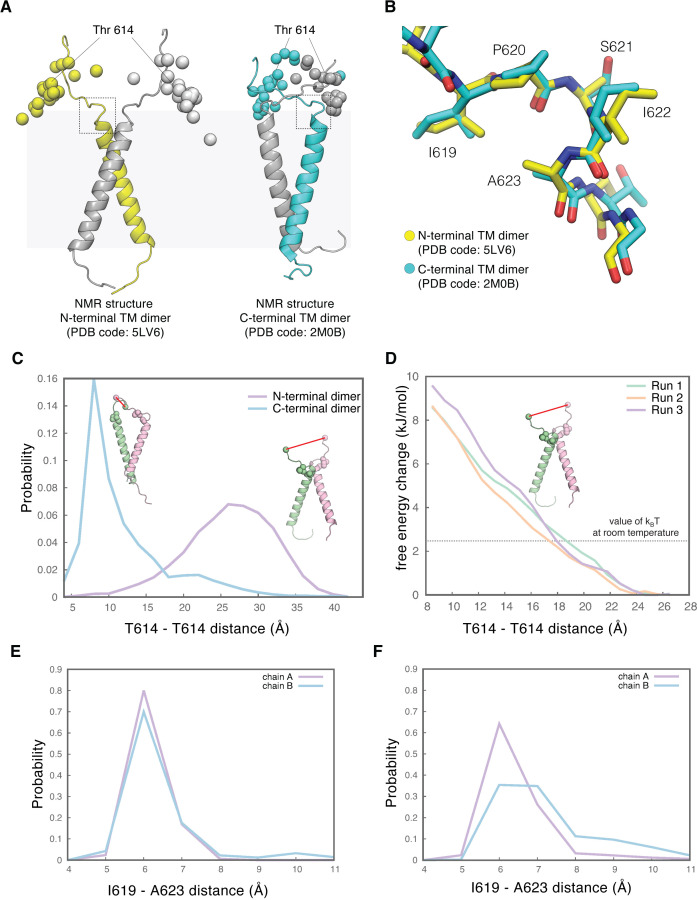
Figure 6.
The tips-separated conformation of the extracellular module can couple more readily to the N-terminal dimer of the transmembrane helices.
( A ) Models of the transmembrane helices in two configurations based on previous NMR structures. One of the structures in the NMR-based ensemble for the N-terminal dimer configuration (PDB code: 5LV6...
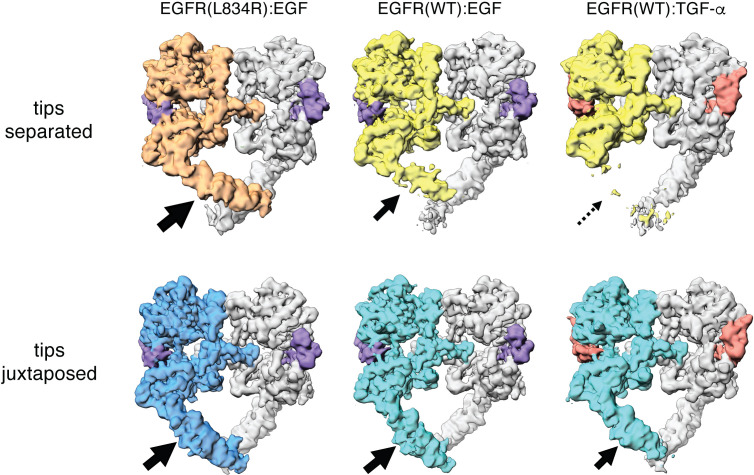
Figure 7.
Comparison between Cryo-EM density maps of the tips-separated and the tips-juxtaposed conformations in different EGFR complexes.
Cryo-EM density maps of the tips-separated (upper row) and the tips-juxtaposed (lower row) conformations in three different EGFR complexes are shown: EGFR(L834R) bound to EGF (left), EGFR(WT) bound to...
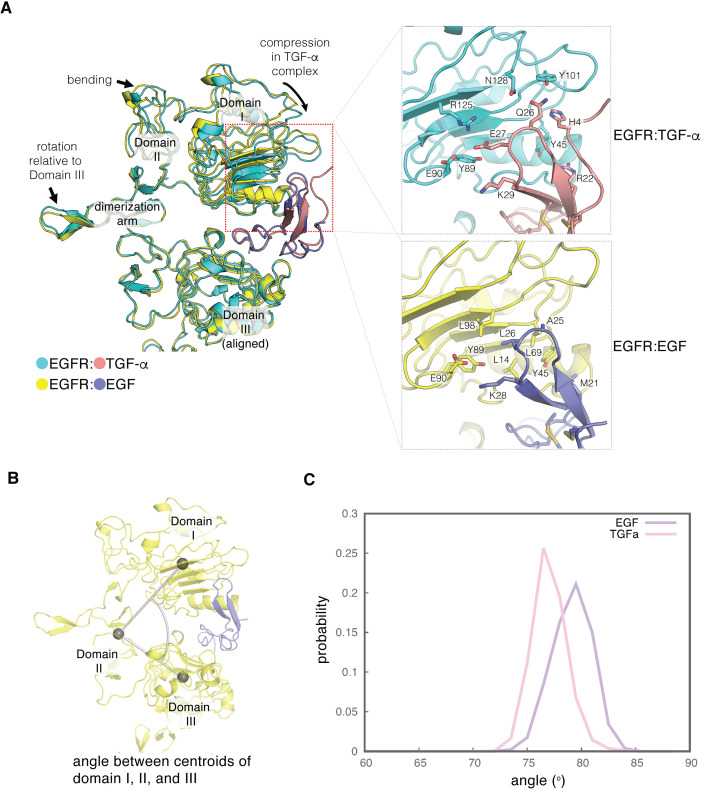
Figure 8.
Difference in the ligand-binding heads between EGF- and TGF-u03b1-bound EGFR complexes.
( A ) The differences in structure between the separated conformations of the EGF and TGF-u03b1 complexes of EGFR are illustrated. Structures corresponding to the separated conformations of the EGFR:E...
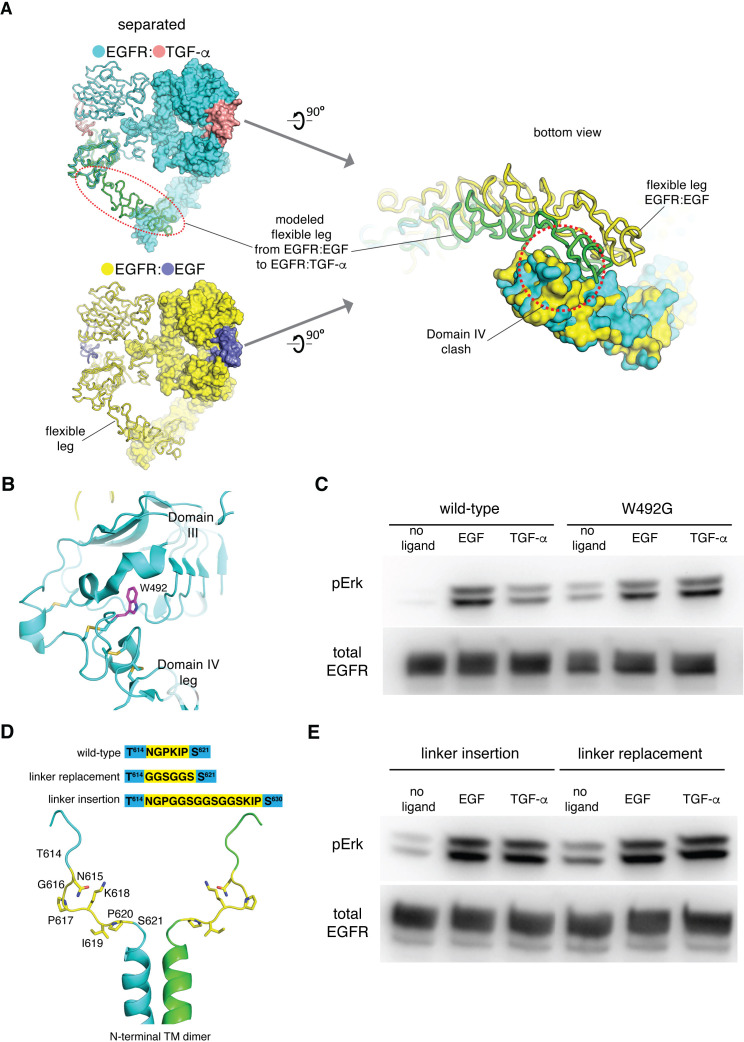
Figure 9.
EGF and TGF-u03b1 differ in their abilities to stabilize the tips-separated conformation and to generate different levels of EGFR activation.
( A ) Destabilization of the flexible Domain IV leg in the separated conformation of the EGFR:TGF-u03b1 complex. The EGFR:TGF-u03b1 complex (upper left) is colored in cyan:salmon and the EGFR:EGFcompl...
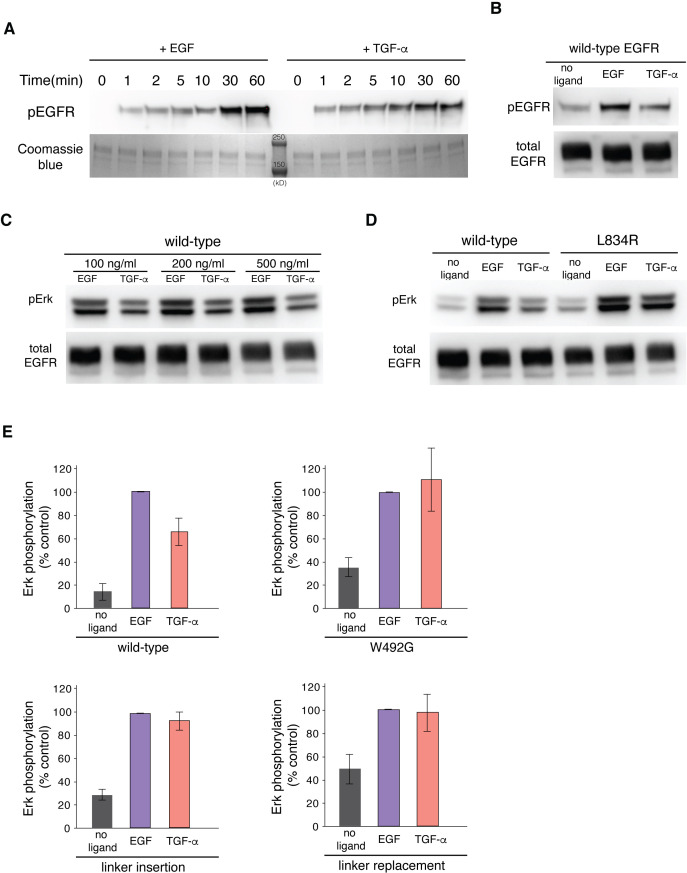
Figure 9u2014figure supplement 1.
EGF and TGF-u03b1 generate different levels of EGFR autophosphorylation and Erk phosphorylation.
( A ) Western-blot analysis of EGFR autophosphorylation in purified full-length EGFR protein stimulated by EGF and TGF-u03b1. A pan-phosphotyrosine antibody is used to detect total phosphorylation of ...
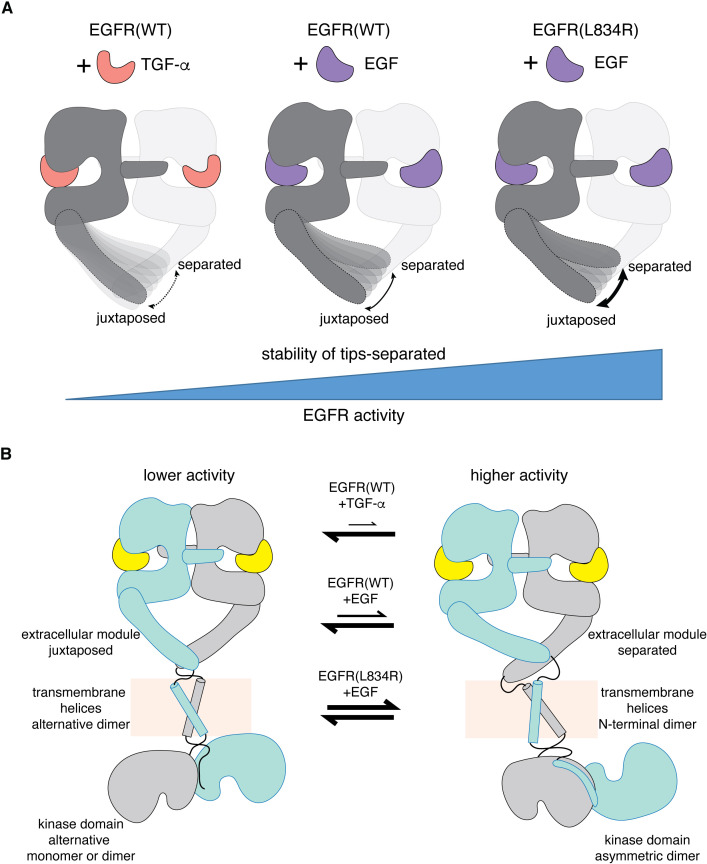
Figure 10.
A mechanism for differential activation of EGFR by EGF and TGF-u03b1.
( A ) Schematic representations of the ligand-bound extracellular module of EGFR illustrate the differential modulation of the conformation of the Domain IV legs by TGF-u03b1 (left), EGF(middle) and o...
Figure images are served from the NIH/NLM PubMed Central Open Access Subset or Europe PMC; copyright remains with the publishers and authors.
💬 Discussion
0 commentsNo comments yet. Be the first to start a discussion!
Leave a Comment