Abstract
The donor-acceptor (D-A) type dipolar fluorophores, an important class of luminescent dyes with two-photon absorption behaviour, generally emit strongly in organic solvents but poorly in aqueous media. To understand and enhance the poor emission behaviour of dipolar dyes in aqueous media, we undertake a rational approach that includes a systematic structure variation of the donor, amino substituent of acedan, an important two-photon dye. We identify several factors that influence the emission behaviour of the dipolar dyes in aqueous media through computational and photophysical studies on new acedan derivatives. As a result, we can make acedan dyes emit bright fluorescence under one- and two-photon excitation in aqueous media by suppressing the liable factors for poor emission: 1,3-allylic strain, rotational freedom, and hydrogen bonding with water. We also validate that these findings can be generally extended to other dipolar fluorophores, as demonstrated for naphthalimide, coumarin and (4-nitro-2,1,3-benzoxadiazol-7-yl)amine (NBD) dyes. The new acedan and naphthalimide dyes thus allow us to obtain much brighter two-photon fluorescent images in cells and tissues than in their conventional forms. As an application of these findings, a thiol probe is synthesized based on a new naphthalimide dye, which shows greatly enhanced fluorescence from the widely used N,N-dimethyl analogue. The results disclosed here provide essential guidelines for the development of efficient dipolar dyes and fluorescence probes for studying biological systems, particularly by two-photon microscopy.
🔬 Techniques
✨ Fluorophores
🔬 Cell Lines
🏛️ Research Organizations (ROR)
Affiliated research institutions:
📋 Methods
The experimental procedures for the synthesis of all the dyes and the biothiol probes P1 and P2 , one-photon spectroscopic analysis, two-photon spectroscopic analysis, tissue and cell imaging experiments, and theoretical computations are described in the ESI. † The experimental procedures regarding mouse tissues herein were performed in accordance with protocols approved by the Kyung Hee University Committee on Animal Research and followed the guidelines for the use of experimental animals established by The Korean Academy of Medical Science. We made every effort to minimize animal suffering and reduce the number of animals used to prepare samples for imaging (for details of sample preparation, see ESI † ).
Supplementary Material Supplementary information Click here for additional data file.
📊 Figures
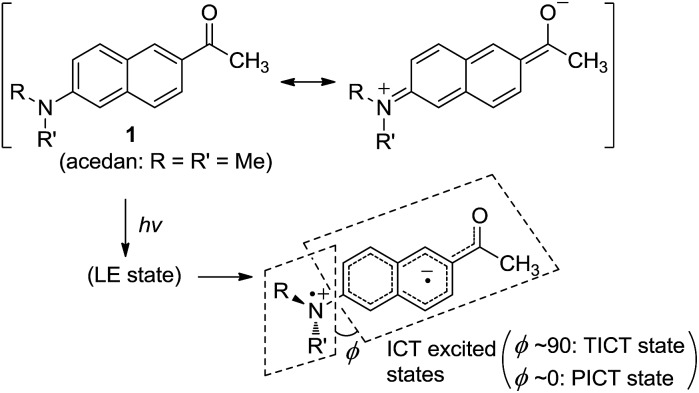
Fig. 1
Acedan ( 1 ) and its ICT excited states, where u03c6 is the torsional angle between the naphthalene and the Ru2013Nu2013Ru2032 planes when viewed along the C naphthyl u2013N bond.
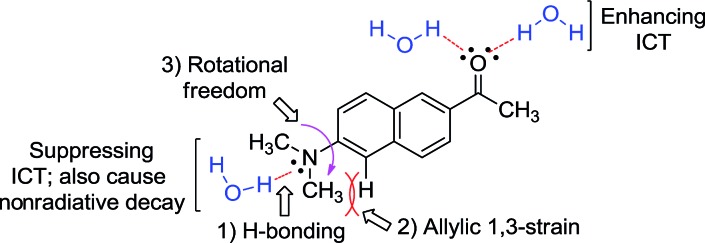
Fig. 2
The proposed factors in this study that would affect ICT in the dipolar fluorophores with an amino donor group: acedan as an example.
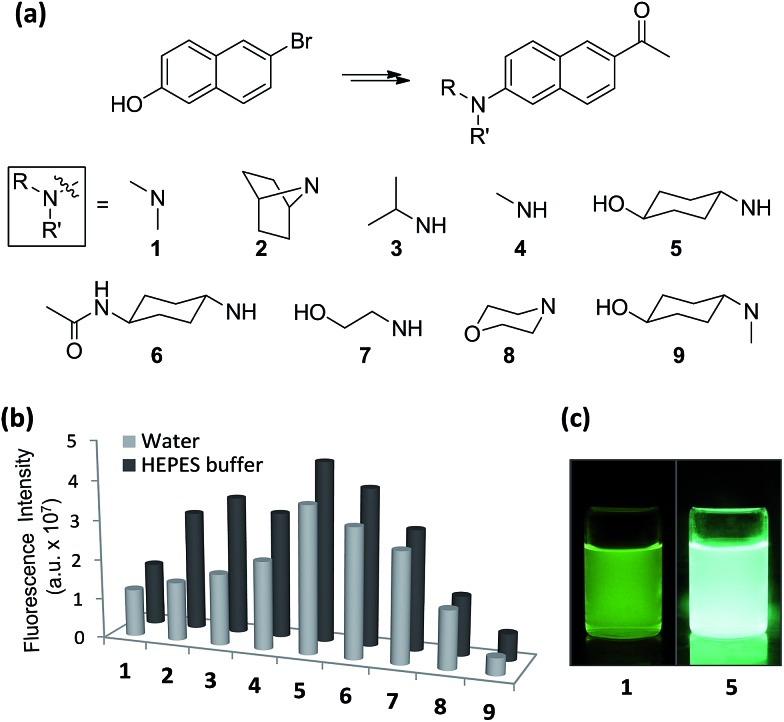
Fig. 3
One-photon emission properties of acedan derivatives. (a) Structures of acedan ( 1 ) and its derivatives 2u20139 investigated in this study. (b) Comparison of one-photon fluorescence intensity of acedan ( 1 ) and its derivatives 2u20139 (each at 10 u03bcM) in aqueous media; the fluorescence was measured by excitation at the maximum absorbance wavelength ( u03bb abs ) of each compound. The uncertainty is less than u00b110% for all the measurements. (c) Photos of acedan ( 1 ) and 5 in water (10 u03bcM) under UV irradiation (365 nm).
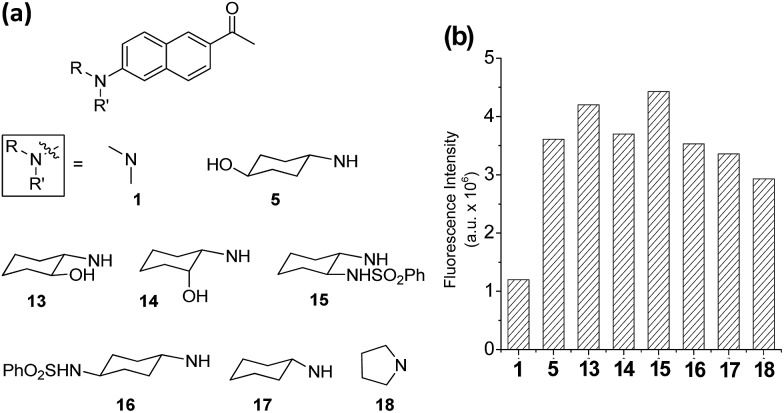
Fig. 4
Acedan derivatives and their relative emission intensity in water. (a) Acedan derivatives 13u201318 investigated further. (b) Comparison of one-photon fluorescence intensities of acedan ( 1 ) and its derivatives 5 , 13u201318 (each at 1 u03bcM) in aqueous medium; the fluorescence intensity was measured by excitation at the maximum absorbance wavelength ( u03bb abs ) of each compound. The uncertainty is less than u00b110% for all the measurements.
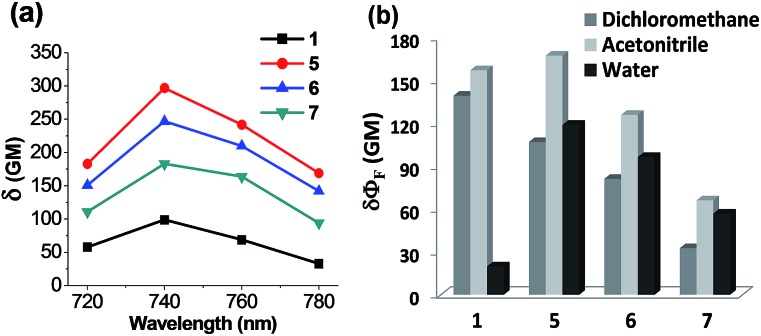
Fig. 5
Two-photon photophysical properties of acedan derivatives. (a) Plots of two-photon absorption cross-sections ( u03b4 ) of acedan ( 1 ) and its derivatives 5u20137 in water. The values were measured with rhodamine B as a standard. The uncertainty is less than u00b110%. (b) Comparison of two-photon action cross-section ( u03b4u03a6 F ) values obtained for acedan ( 1 ) and its derivatives 5u20137 in different solvents (dichloromethane, acetonitrile and water) under excitation at 740 nm (the maximum two-photon excitation wavelength). The uncertainty is less than u00b110% for all the measurements.
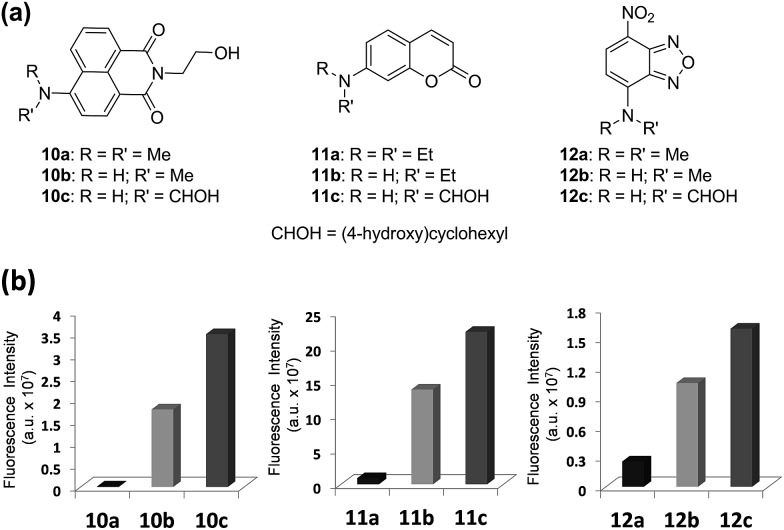
Fig. 6
Comparison of emission intensities depending on the amino substituent of three common dipolar fluorophores. (a) Structures of naphthalimides 10au201310c , coumarins 11au201311c and NBDs 12au201312c . (b) Comparison of fluorescence intensities of naphthalimides 10au201310c , coumarins 11au201311c and NBDs 12au201312c (each at 10 u03bcM) in water; the fluorescence intensity was measured by excitation at the maximum absorbance wavelength ( u03bb abs ) of each compound. The uncertainty is less than u00b110% for all the measurements.
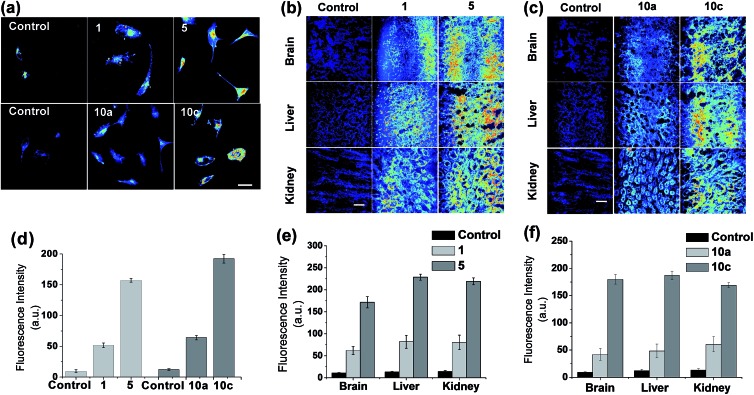
Fig. 7
Evaluations of the new and old types of acedan and naphthalimide dyes in cell and tissue imaging by two-photon microscopy (TPM). (a) Upper row: TPM images of HeLa cells treated with acedan 1 (100 u03bcM) and its N -cyclohexyl derivative 5 (100 u03bcM) under excitation at 880 nm with 16.25 mW laser power. Lower row: TPM images of HeLa cells treated with N , N -dimethyl-naphthalimide 10a (100 u03bcM) and its N -cyclohexyl analogue 10c (100 u03bcM) under excitation at 900 nm with 15 mW laser power. The images were taken after incubation for 30 min. Cells untreated with any fluorophore were used as controls. (b) TPM images of mouse tissues (brain, liver and kidney) obtained after incubation with acedan 1 (100 u03bcM) and its N -cyclohexyl derivative 5 (100 u03bcM) for 10 min, under excitation at 880 nm. Tissues without treatment of any fluorophore are used as controls. Laser power: 75 mW. (c) TPM images of mouse tissues (brain, liver and kidney) obtained after incubation with naphthalimides 10a (100 u03bcM) and 10c (100 u03bcM) for 10 min, under excitation at 900 nm. Laser power: 70 mW. Scale bar: 50 u03bcm. (du2013f) Relative intensity plots of the corresponding TPM images shown in (a)u2013(c), which were obtained by collecting and averaging of all the data pixels. The error bars indicate u00b1SD.

Fig. 8
Emission properties of naphthalimide-based probes P1 and P2 towards thiols, and their fluorescence imaging in cells. (a) Structures of the probes, P1 and P2 , with different amine donors. (b) Emission spectra of P1 and P2 in the absence and presence of Cys (200 u03bcM), obtained in HEPES buffer (pH = 7.4) containing 1% acetonitrile at 25 u00b0C (excitation wavelengths for P1 and P2 were 440 nm and 453 nm, respectively). (c) TPM images of HeLa cells after 60 min of incubation with P1 (middle column) or P2 (right column) at 5 u03bcM (upper row) and at 10 u03bcM (lower row), obtained under two-photon excitation at 900 nm with 5.7 mW laser power. Cells without treatment of any fluorophore were used as controls. Scale bar: 30 u03bcm. (d) Relative intensity plot of the respective TPM images shown in (c), which were obtained by collecting and averaging of all the data pixels. The error bars indicate u00b1SD.
Figure images are served from the NIH/NLM PubMed Central Open Access Subset or Europe PMC; copyright remains with the publishers and authors.
💬 Discussion
0 commentsNo comments yet. Be the first to start a discussion!
Leave a Comment