Abstract
Protein-metabolite networks are central to biological systems, but are incompletely understood. Here, we report a screen to catalog protein-lipid interactions in yeast. We used arrays of 56 metabolites to measure lipid-binding fingerprints of 172 proteins, including 91 with predicted lipid-binding domains. We identified 530 protein-lipid associations, the majority of which are novel. To show the data set's biological value, we studied further several novel interactions with sphingolipids, a class of conserved bioactive lipids with an elusive mode of action. Integration of live-cell imaging suggests new cellular targets for these molecules, including several with pleckstrin homology (PH) domains. Validated interactions with Slm1, a regulator of actin polarization, show that PH domains can have unexpected lipid-binding specificities and can act as coincidence sensors for both phosphatidylinositol phosphates and phosphorylated sphingolipids.
🔬 Techniques
🧬 Organisms
💻 Software
✨ Fluorophores
🧪 Sample Preparation
🏭 Microscope Brands
🧪 Reagent Suppliers
📷 Detectors
💻 Software Details
💾 Data Repositories
🏛️ Research Organizations (ROR)
Affiliated research institutions:
📋 Methods
Lipid–arrays The protocol to produce lipid–arrays was developed from Kanter et al (2006) . Briefly, 1 mM solutions of lipids were prepared in adequate solvent mixtures. Using an argon flow, 0.1 μl of each lipid was sprayed on a nitrocellulose membrane (Hybond-C Extra, GE Healthcare) with an ATS4S spotter (CAMAG). We also spotted a nitrobenzoxadiazole-labeled phosphatidylglycerol (Sigma) at different positions on the array and monitored the quality of the spotting procedure by scanning at 432 nm excitation (GenePix 4000B, Molecular Devices). The three different solvent mixtures used (chloroform, chloroform:methanol 1:1 and chloroform:methanol:water–HCl 1:1:0.2) were also sprayed as blank controls. All the samples were spotted in duplicate. The arrays were stored at 4°C under argon atmosphere and protected from light. Lipid overlay assay The S. cerevisiae strains expressing the desired TAP-tagged protein were grown at 30°C to an OD 600 of 3.5–3.8. Pelleted cells were disrupted by glass beads beating. Cell extracts were obtained by a 30 min centrifugation at 22 000 r.p.m. at 4°C and filtration (HPF Millex ® —0.45 μm). The lipid overlay assay was adapted from Dowler et al (2000) . The arrays were blocked for 1 h in 2 ml of blocking buffer (3% fatty-acid-free BSA, 150 mM NaCl, 10 mM Tris pH 7.4). The arrays were then incubated for 1 h in the presence of cell extracts, washed and the bound TAP-tagged proteins were immunodetected with PAP or with V5-specific antibodies (Invitrogen).
Show full methods section
Lipid–arrays The protocol to produce lipid–arrays was developed from Kanter et al (2006) . Briefly, 1 mM solutions of lipids were prepared in adequate solvent mixtures. Using an argon flow, 0.1 μl of each lipid was sprayed on a nitrocellulose membrane (Hybond-C Extra, GE Healthcare) with an ATS4S spotter (CAMAG). We also spotted a nitrobenzoxadiazole-labeled phosphatidylglycerol (Sigma) at different positions on the array and monitored the quality of the spotting procedure by scanning at 432 nm excitation (GenePix 4000B, Molecular Devices). The three different solvent mixtures used (chloroform, chloroform:methanol 1:1 and chloroform:methanol:water–HCl 1:1:0.2) were also sprayed as blank controls. All the samples were spotted in duplicate. The arrays were stored at 4°C under argon atmosphere and protected from light. Lipid overlay assay The S. cerevisiae strains expressing the desired TAP-tagged protein were grown at 30°C to an OD 600 of 3.5–3.8. Pelleted cells were disrupted by glass beads beating. Cell extracts were obtained by a 30 min centrifugation at 22 000 r.p.m. at 4°C and filtration (HPF Millex ® —0.45 μm). The lipid overlay assay was adapted from Dowler et al (2000) . The arrays were blocked for 1 h in 2 ml of blocking buffer (3% fatty-acid-free BSA, 150 mM NaCl, 10 mM Tris pH 7.4). The arrays were then incubated for 1 h in the presence of cell extracts, washed and the bound TAP-tagged proteins were immunodetected with PAP or with V5-specific antibodies (Invitrogen).
Molecular biology and recombinant protein expression
All primers used are listed in Supplementary Table S8 . TAP-tagged proteins selected for recombinant expression in E. coli ( Supplementary Tables S1B and S2A ) and the PH domain of Slm1 (Slm1-PH) were cloned in pET100-D/TOPO or pET101-D/TOPO vector (Invitrogen) following the manufacturer's instructions. Mutations in Slm1 were introduced using the QuikChange ® lightning Site-Directed Mutagenesis kit (Stratagene). For detailed information on the cloning, mutagenesis, expression and purification of the recombinant proteins, as well as strains used in this study, see Supplementary information .
Live-cell imaging Perturbation of sphingolipid metabolism with myriocin
The localization of endogenously expressed proteins was examined using yeast strains expressing GFP fusions ( Huh et al, 2003 ). Cells attached on 35 mm glass bottom culture dishes coated with Concanavalin A were treated with 5 μM myriocin or 5 μM myriocin and 5 μM DHS(Sigma). The effect of myriocin was measured after 2 h treatment, which represents the minimal exposure time that induced, in our experimental setting, the delocalization of two proteins that bound sphingolipids in vitro : Mss4 and Slm1. Under these conditions, cells remained perfectly viable (data not shown) and other membrane resident were unaffected ( Figure 6E ; Supplementary Figure S8A ). For a more detailed description of the procedure, see Supplementary information . Imaging was performed with an Olympus IX81 microscope equipped with 100 × /NA 1.45 objective lens and Hamamatsu Orca-ER camera. For 49 GFP fusions that did not localize in punctate structures, the effect of myriocin was assessed qualitatively. Those proteins were considered sensitive to myriocin if the effect was restored by DHS. Yhr131c did not fulfill this requirement. We quantified the effects of myriocin using a standardized method for 32 proteins that showed similar punctate localization patterns (see Supplementary information ). Perturbation of PtdIns(4,5)P 2 metabolism The mss4 ts cells coding for the respective C-terminal GFP-tagged protein were grown and attached to dishes at 25°C, following the same protocol described above. Dishes were kept at the selected temperature (25 or 37°C) for 2 h and imaged immediately after. Same protocol was followed for PLCδ-PH-GFP. In this case, mss4 ts strain was transformed with the plasmid coding for PLCδ-PH-GFP. Perturbation of Pkh1/Pkh2 signaling pathway The pkh1 ts / Δ pkh2 cells coding for the respective C-terminal GFP-tagged proteins were grown and attached to dishes at 25°C, following the same protocol described above. Dishes were kept at the selected temperature (25 or 37°C) for 1 h and imaged immediately after. At 37°C, pkh1 ts /Δ pkh2 cells are defective in actin polarization ( Inagaki et al, 1999 ). One hour represents the first time point, in our experimental condition, in which we observed the delocalization of the actin-binding protein Abp1. Under these conditions, cells remained viable (data not shown).
Cell based assays to assess Slm1-PH function
Actin polarization assay was performed as previously described ( Fadri et al, 2005 ; see Supplementary information ). Yeast wild-type strain and strains carrying point mutations in Slm1-PH domain were grown on SC plates containing 500 ng ml –1 myriocin or equivalent amounts of methanol at 30°C for 3 days.
Strains carrying Slm2 deletion
(Δ slm2 ) were grown in YPD plates at 25 or 37°C for 1 day.
Liposome preparation
A mixture of the lipids was prepared in chloroform:methanol:water, 1:1:0.07, containing 0.03% HCl. We added 1-palmitoyl-2-oleoyl- sn -glycero-3-phosphocholine (Avanti Polar Lipids) to a final concentration of 3.8 mM. Where indicated, PtdIns, PtdIns(3)P, PtdIns(4)P, PtdIns(5)P, PtdIns(3,4)P 2 , PtdIns(3,5)P 2 , PtdIns(4,5)P 2 , PtdIns(3,4,5)P 3 , DHS-1P (Avanti Polar Lipids) and phosphatidylserine (Sigma) were also included. Lipid mixtures were dried under an argon stream followed by 30 min high vacuum. Dried mixtures were rehydrated in binding buffer (10 mM HEPES, 150 mM NaCl, pH 7.4) by mixing at 60°C for 2 h. Lipids were subjected to 5 min sonication and three snap-freeze/thaw cycles in liquid N 2 and shaking at 60°C. Finally, small unilamellar vesicles were generated using a mini-extruder (Avanti Polar Lipids) and a membrane pore size of 0.1 μm. Liposome-binding assays: flotation assay and size exclusion chromatography and western blot Flotation assay was performed as previously described ( Miller et al, 2002 ) (see Supplementary information ). Size exclusion chromatography was performed on Pharmacia FPLC system by using Superdex 200 HR 10/30 column, equilibrated with binding buffer at the flow rate 0.25 ml × min −1 . After 30 min incubation at 22°C with 8 μM Slm1-PH or PLCδ-PH, 250 μl of the different liposome solutions were injected. We collected 0.5 ml fractions that were then analyzed by SDS–PAGE and western blot. A V5-specific antibody produced in mouse (Invitrogen) was used to detect Slm1-PH. Total band intensity was integrated with Photoshop software and normalized versus the total amount of protein loaded. Presented results are the sum of all detected fractions of Slm1-PH or PLCδ-PH co-eluted with liposomes. Isothermal titration calorimetry Isothermal titration calorimetry (ITC) was performed using a VP-ITC Microcal calorimeter (Microcal). Injectant (Slm1-PH or PLCδ-PH) was dialyzed extensively against binding buffer before all titrations. The experiments were performed at 25°C. A typical titration consisted of injecting 6–12 μl aliquots of 47 μM protein into the different solutions of liposomes, at intervals of 5 min to ensure that the titration peak returned to the baseline. The ITC data were corrected for the injectant dilution heat. To estimate K d , we used the concentration of binding sites on liposome surface as a fitting parameter, assuming that the interactions occur in a stoichiometry of 1:1. The analysis was performed with the Origin 5.0 software. Slm1-PH crystallization and structure determination Crystals were grown at 20°C by vapor diffusion using the sitting-drop method. For crystallization, 0.5 μl of protein solution (9 mg ml –1 ) were mixed with 0.5 μl of precipitant solution (2 M (NH 4 ) 2 SO 4 , 2% PEG 400, 0.1 M Hepes pH 7.5). A single crystal was cryo-protected in mother liquor supplemented with 30% glycerol and flash frozen in liquid nitrogen at 100 K. Diffraction data were collected at beamline ID14-2 of the European Synchrotron Radiation Facility (ESRF, Grenoble France) using an ADSC Q4r CCD detector, and subsequently processed with XDS ( Kabsch, 2010 ). The structure was solved by molecular replacement with the program PHASER ( McCoy et al, 2007 ) using a search model obtained from the PDB entry 1btk ( Hyvonen and Saraste, 1997 ) after conversion to polyalanine and removal of poorly conserved regions among PH domains. The search model included the following residues in the PDB entry 1btk: 5–14, 25–42, 53–57, 63–65, 101–104, 111–134. The initial solution was completed by iterative cycles of manual building in COOT ( Emsley and Cowtan, 2004 ) and refinement using PHENIX ( Adams et al, 2002 ), yielding a final model with R and R free values of 22.1 and 27.1, respectively ( Supplementary Table S7 ). The stereochemistry of the final model was checked with PROCHECK ( Laskowski et al, 1993 ). The atomic coordinates and structure factors have been deposited in the Protein Data Bank under accession code 3nsu . In Figure 7 , the electrostatic potential calculated with APBS ( Baker et al, 2001 ) is represented on the solvent-accessible surface. Blue and red indicate positive (+4 kT/e) and negative (−4 kT/e) potential, respectively. Images were generated using Pymol ( DeLano, 2002 ).
Estimation of accuracy based on interactions with PtdInsPs pathway
We thought to use the genetic coverage of the literature-derived reference data set to extrapolate the fraction of true interactions (accuracy) in our data (see below). We reasoned that if the lipid–array and the literature-derived reference data set are comparable in terms of quality and biological relevance, they should be similarly covered by genetic interactions. As the literature-derived reference data set mainly consists of PtdInsPs, we used accuracy measured for this lipid class as an approximation for the entire data set. For this analysis, intermediate cutoff was used for Costanzo et al (2010) data set along with data from SGD and literature ( Supplementary Tables S2C and S4 ; see also Supplementary Data 1 ). For different sets of proteins, we measured the fraction that interacts genetically with enzymes involved in the synthesis of PtdInsPs ( Figure 3B ): (i) proteins that bound PtdInsPs in the literature-derived reference data set (10/16=62.5%=reference genetic coverage); (ii) proteins that bound PtdInsPs in the lipid–array (40/86=46.5%=experimental genetic coverage); (iii) a set of proteins defined as those proteins devoid of LBD and that did not bind PtdInsPs in the lipid–array (4/19=21.1%=background genetic coverage). We observed that the literature-derived reference data set has significantly more genetic interactions than the background genetic coverage ( P =0.015). The same was true for proteins that bound PtdInsPs in the lipid–array versus the background genetic coverage ( P =0.035). Interestingly, the lipid–array data did not show any significant difference when compared with the literature-derived reference data set ( P =0.18). Fisher's exact test was used to measure significance. We can now interpolate the fraction of true interactions (accuracy) expected in the PtdInsPs lipid–array data set. The coverage of genetic interactions in our data set results from two different components: interactions of ‘true positive’ ( x ) and ‘false positive’ (1− x ) proteins. Assuming that the ‘false positive’ will have a genetic coverage equal to the background genetic coverage and that ‘true positive’ will have a genetic coverage equal to the reference genetic coverage, we predict that 61.4% of the proteins are ‘true positives’ (see below). If all of the 86 proteins that bound PtdInsPs in the lipid–array are equally likely to be among the ‘true positives’, the ‘true positive’ rate among our protein–lipid interactions will also be 61.4% ( Figure 3B ). where χ=‘true positive’ in the lipid–array data set (accuracy). (1−χ)=‘false positive’ in the lipid–array data set. GC Exp =experimental genetic coverage. GC Ref =reference genetic coverage. GC BG =background genetic coverage. Prediction of a CRAL/TRIO in Ecm25 The putative CRAL/TRIO domain of Ecm25 was detected by running HHsearch ( Soding, 2005 ) for all yeast proteins against the SCOP 1.69 database. For detailed information on the sequence-based alignment of the non-redundant set of structures annotated by Pfam as having a CRAL/TRIO domain, see Supplementary information . Clustering of proteins and lipids according to their binding profiles For every protein, we calculated the fraction f 1 of all the lipids with which it interacted and the fraction f 0 of all the lipids with which it did not interact. Likewise, for every lipid, we calculated the fraction f 1 of all the proteins with which it interacted and the fraction f 0 of all the proteins with which it did not interact. Then at every position ( i , j ) in the interaction matrix, we have a score s 1 i , j for an interaction between protein i and lipid j =log( f 1 i )+log( f 1 j ), and a score s 0 i , j for no interaction=log( f 0 i )+log( f 0 j ). Thus, an interaction between a promiscuous protein and a promiscuous lipid has a lower score than an interaction between a highly selective protein and lipid. We then scored the similarity between the lipid-binding profiles of all pairs of proteins i 1 and i 2 by summing the scores for every lipid j in the profile, where the score for lipid j = We then clustered the proteins by complete linkage using the program OC ( Barton, 2002 ), on the basis of these scores. We followed the same procedure to cluster the lipids on the basis of their protein-binding profiles. The calculation of the binomial probability for a significant deficiency or enrichment with a particular attribute and correction for testing for a particular feature in multiple places is described in Supplementary information . For detailed description on other bioinformatic procedures (e.g. multiple sequence alignment), see Supplementary information .
Supplementary Material Supplementary Information Tables S1–S4 Tables S5–S8 Dataset 1 Movie S1 Movie S2
📊 Figures
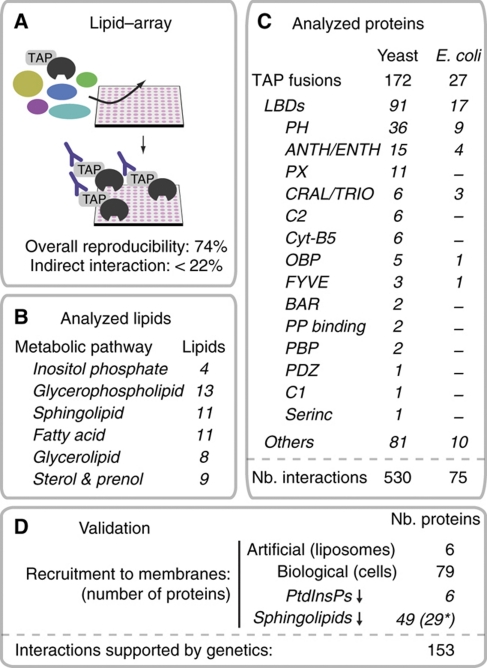
Figure 1
Identification of proteinu2013lipid interactions in S. cerevisiae using lipidu2013arrays and live-cell imaging. ( A ) Charting proteinu2013lipid interactions with lipidu2013arrays. ( B ) Summary of th...
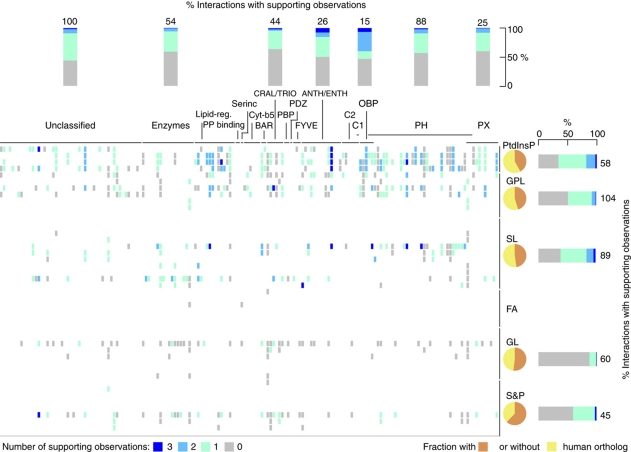
Figure 2
Proteinu2013lipid map in yeast. The table displays all interactions color coded according to the number of experimental supports: reproducibility with proteins expressed in homologous and heterologous...
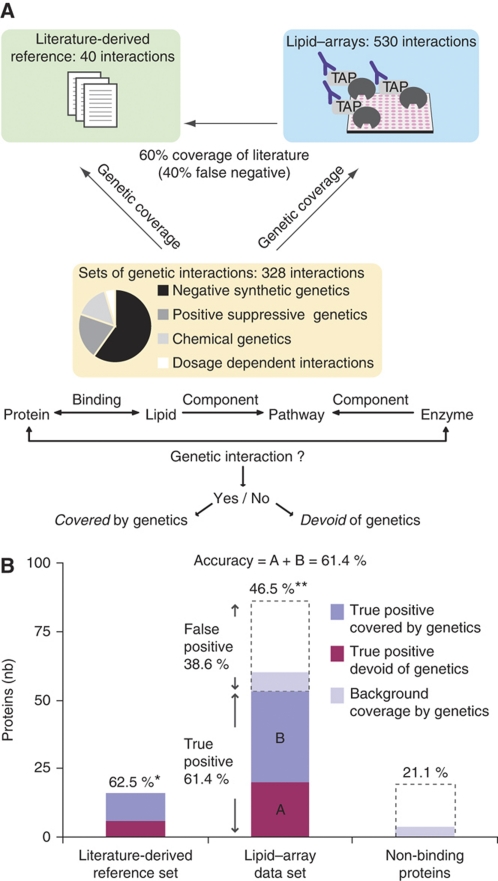
Figure 3
Assessment of the lipidu2013array data quality. ( A , B ) Comparison with sets of literature curated and genetic interactions. (A) Summary of the two reference data sets and strategies used to assess ...
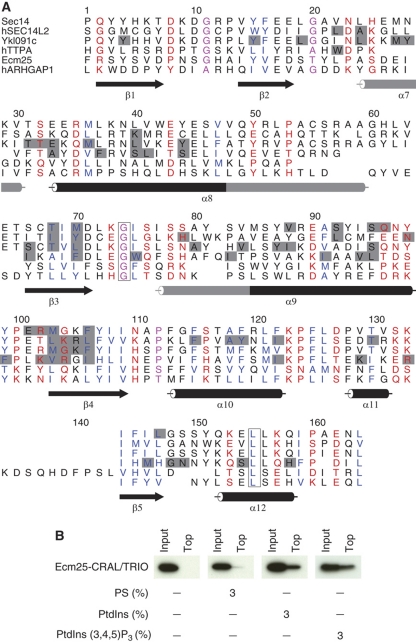
Figure 4
Identification of a new cryptic lipid-binding domain in Ecm25. ( A ) Structure-based alignment of Ecm25 and five known CRAL/TRIO domain. Conserved hydrophobic sites are colored blue, polar sites are r...
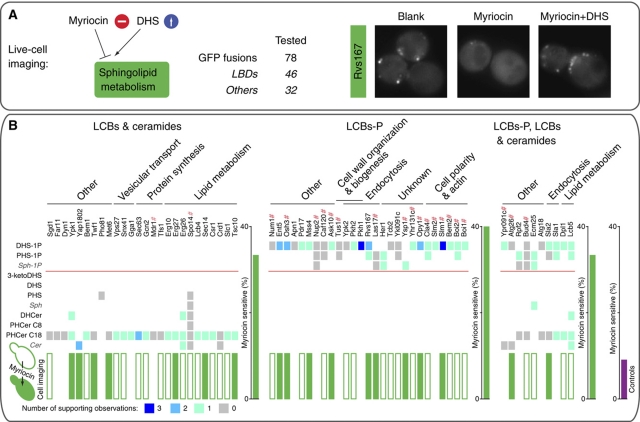
Figure 5
Lipidu2013arrays and live-cell imaging identify new series of sphingolipid effectors. ( A ) The effect of the perturbation of sphingolipid metabolism on GFP-fusion localization was monitored in yeast ...
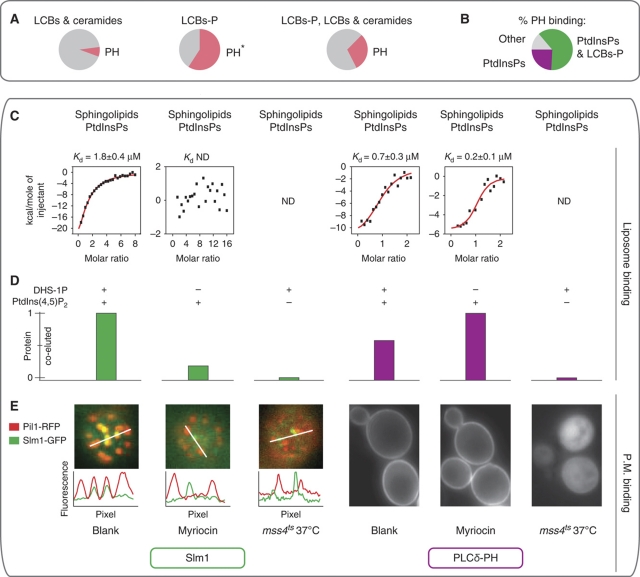
Figure 6
The PH domain of Slm1 cooperatively binds PtdInsPs and phosphorylated sphingolipids. ( A ) A significant fraction of proteins-binding phosphorylated LCBs also contained a PH domain. For each sphingoli...
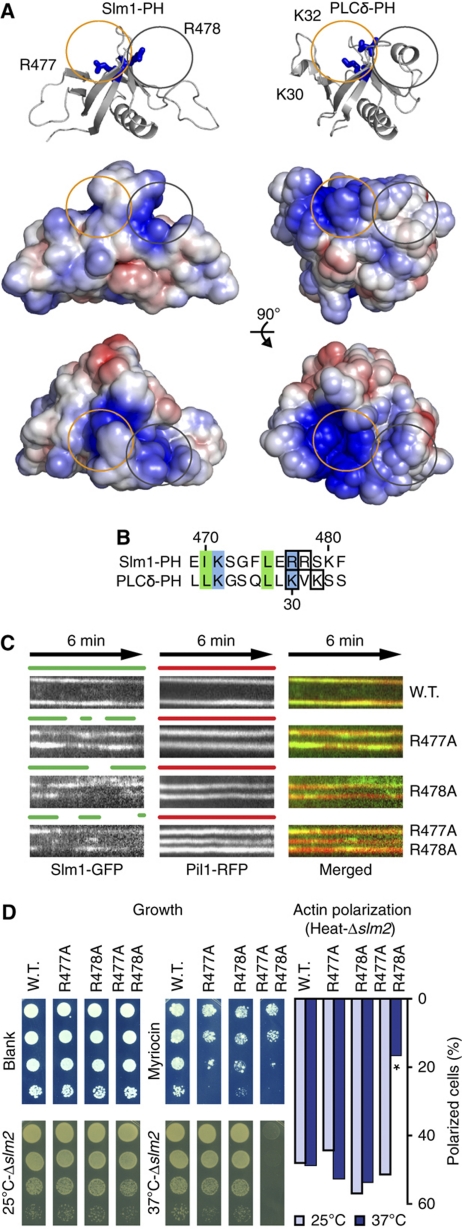
Figure 7
The 2.0 u00c5 X-ray structure of Slm1-PH reveals two putative binding sites required for Slm1 function in vivo . ( A ) Comparison of the structures of Slm1-PH with that of PLCu03b4-PH (Protein Data Ba...
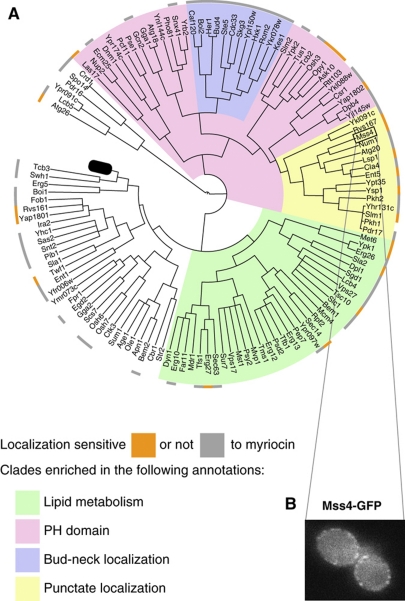
Figure 8
Lipid-binding fingerprints as predictors of protein localization, domains and functions. ( A ) Proteins clustered according to their lipid-binding profiles. The wedge shapes highlight some groups that...
Figure images are served from the NIH/NLM PubMed Central Open Access Subset or Europe PMC; copyright remains with the publishers and authors.
💬 Discussion
0 commentsNo comments yet. Be the first to start a discussion!
Leave a Comment