Abstract
A basic assumption underlying synthetic biology is that analysis of genetic circuit elements, such as regulatory proteins and promoters, can be used to understand and predict the behavior of circuits containing those elements. To test this assumption, we used time-lapse fluorescence microscopy to quantitatively analyze two autoregulatory negative feedback circuits. By measuring the gene regulation functions of the corresponding repressor-promoter interactions, we accurately predicted the expression level of the autoregulatory feedback loops, in molecular units. This demonstration that quantitative characterization of regulatory elements can predict the behavior of genetic circuits supports a fundamental requirement of synthetic biology.
🔬 Techniques
🧬 Organisms
✨ Fluorophores
🧪 Sample Preparation
🏭 Microscope Brands
📷 Detectors
💻 Software Details
🏛️ Research Organizations (ROR)
Affiliated research institutions:
📋 Methods
Bacterial strains and constructs λ-cascade strains were described previously ( Rosenfeld et al , 2005 ). E. coli strains encoding chromosomally integrated negative autoregulatory circuits ( Figure 1A ; Supplementary Figure S1 ) were constructed as follows. First, complementary oligonucleotides encoding the lambda P R promoter were designed with appropriate cohesive ends to replace the P L lacO1 promoter driving cI-yfp expression in previously described plasmid pZE21- cIyfp ( Rosenfeld et al , 2005 ). The P R promoter contains O R 2 and O R 1 repressor-binding sites ( Meyer et al , 1980 ), conserves the spacing between them ( Liu and Little, 1998 ), and also contains the following sequence: …ataaatatc[taacaccgtgcGtgttg]actattt[tacctctggcggtgata]atggttgcatgtactagaattcattaaagaggagaaaggtaccATG… (capital ATG marks translation start; brackets indicate O R 2 and O R 1; capital G marks the base that is changed in the O R 2 * variant). Site-directed mutagenesis of this promoter (G is changed to T; see Supplementary Figure S1 ) yielded the O R 2 * promoter variant, previously designated as ‘vN' ( Meyer et al , 1980 ). These steps resulted in the plasmid-based negative autoregulatory circuits. Homologous recombination of the construct into the chromosome of strain MC4100Z1 was performed using a ‘recombineering' technique. Briefly, PCR products of both of the complete transcriptional units, along with an adjacent amp R marker, were generated with ends homologous to the galK locus, as described previously ( Elowitz et al , 2002 ). Electroporation of these products into heat-shocked MC4100Z1 containing pSIM5 ( Yu et al , 2000 ) and subsequent recovery at 37°C on Amp plates resulted in the desired strains. Plasmid pSIM5, a generous gift of DL Court, contains the genes necessary for recombination under heat-shock control on a plasmid with a tsSC101 origin that is lost at 37°C.
Show full methods section
Bacterial strains and constructs λ-cascade strains were described previously ( Rosenfeld et al , 2005 ). E. coli strains encoding chromosomally integrated negative autoregulatory circuits ( Figure 1A ; Supplementary Figure S1 ) were constructed as follows. First, complementary oligonucleotides encoding the lambda P R promoter were designed with appropriate cohesive ends to replace the P L lacO1 promoter driving cI-yfp expression in previously described plasmid pZE21- cIyfp ( Rosenfeld et al , 2005 ). The P R promoter contains O R 2 and O R 1 repressor-binding sites ( Meyer et al , 1980 ), conserves the spacing between them ( Liu and Little, 1998 ), and also contains the following sequence: …ataaatatc[taacaccgtgcGtgttg]actattt[tacctctggcggtgata]atggttgcatgtactagaattcattaaagaggagaaaggtaccATG… (capital ATG marks translation start; brackets indicate O R 2 and O R 1; capital G marks the base that is changed in the O R 2 * variant). Site-directed mutagenesis of this promoter (G is changed to T; see Supplementary Figure S1 ) yielded the O R 2 * promoter variant, previously designated as ‘vN' ( Meyer et al , 1980 ). These steps resulted in the plasmid-based negative autoregulatory circuits. Homologous recombination of the construct into the chromosome of strain MC4100Z1 was performed using a ‘recombineering' technique. Briefly, PCR products of both of the complete transcriptional units, along with an adjacent amp R marker, were generated with ends homologous to the galK locus, as described previously ( Elowitz et al , 2002 ). Electroporation of these products into heat-shocked MC4100Z1 containing pSIM5 ( Yu et al , 2000 ) and subsequent recovery at 37°C on Amp plates resulted in the desired strains. Plasmid pSIM5, a generous gift of DL Court, contains the genes necessary for recombination under heat-shock control on a plasmid with a tsSC101 origin that is lost at 37°C.
Bacterial growth and medium
Cultures were grown overnight in LB+15 μg/ml kanamycin at 37°C from single colonies, and diluted 1:100 in MSC medium (M9 minimal medium+0.6% succinate+0.01% casamino acids+0.15 μg/ml biotin+1.5 μM thiamine). Cultures were grown to OD 600 ∼0.1 at 32°C, and then diluted to give ∼1 cell per visual field when placed between a coverslip and 1.5% low-melt MSC agarose.
Quantitative fluorescence microscopy
Growth of bacterial microcolonies was observed by fluorescence microscopy at 32°C using an automated Leica DMIRB/E microscope with × 100 phase contrast objective, an Orca ERG-cooled CCD camera (Hamamatsu), and custom acquisition software. Typical intervals between subsequent exposures were 8–9 min. Custom software was developed using MATLAB (The Mathworks Inc) to analyze time-lapse movie data ( Rosenfeld et al , 2005 ). The cell length ( l , typical values are 3–4 μm) and width ( w , narrowly distributed around 0.75 μm) were recorded, and cell volume was calculated by modeling the cell as a cigar-shape cylinder of length ( l − w ) and radius ( w /2), capped by two hemispheres of radius ( w /2). Cell volumes typically varied from 1–2 to 2–3 μm 3 . Fluorescence levels were translated into units of fluorescent proteins using a fluctuation method, which compares the distribution of sister-cell fluorescence values after cell-division to a hypothesis of binomial protein segregation ( Rosenfeld et al , 2005 , 2006 ). Protein production rate was averaged between subsequent movie frames. Segmentation errors can contribute a relative error of a few percent, and calibration errors can contribute a systematic additive error in the order of 10 molecules per cell.
Supplementary Material Supplementary Figure S1 Supplementary Figure S2 Supplementary Figure S3 Supplementary movies SM1 and SM2 Supporting information Supporting Legends
📊 Figures
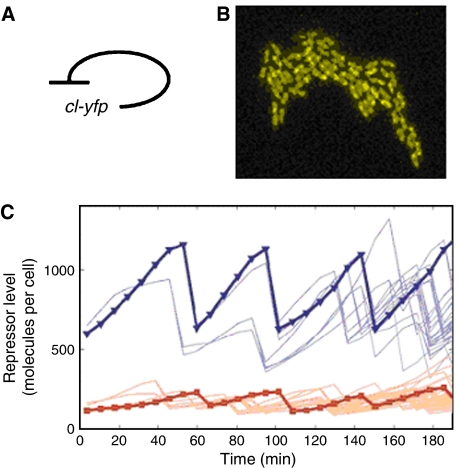
Figure 1
Measurements of synthetic negative autoregulation circuits. ( A ) Schematic diagram of a negative autoregulatory circuit. cI-yfp encodes a fusion protein of the lambda repressor and yfp genes. This ch...
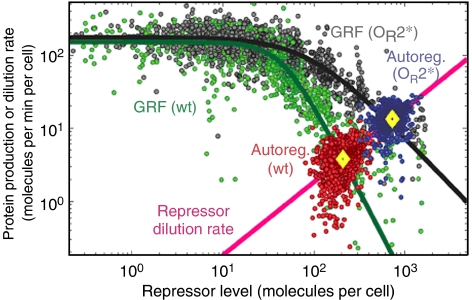
Figure 2
Predicted and actual behavior of the synthetic negative autoregulatory circuits. GRFs are plotted as a function of repressor level R T for wild-type P R promoter (green) and the O R 2 * variant (black...
Figure images are served from the NIH/NLM PubMed Central Open Access Subset or Europe PMC; copyright remains with the publishers and authors.
💬 Discussion
0 commentsNo comments yet. Be the first to start a discussion!
Leave a Comment