Abstract
Biochemical networks interconnect, grow and evolve to express new properties as different chemical pathways are selected during a continuous cycle of energy consumption and transformation. In contrast, synthetic systems that push away from equilibrium usually return to the same self-assembled state, often generating waste that limits system recyclability and prevents the formation of adaptable networks. Here we show that annealing by slow proton dissipation selects for otherwise inaccessible morphologies of fibres built from DNA and cyanuric acid. Using single-molecule fluorescence microscopy, we observe that proton dissipation influences the growth mechanism of supramolecular polymerization, healing gaps within fibres and converting highly branched, interwoven networks into nanocable superstructures. Just as the growth kinetics of natural fibres determine their structural attributes to modulate function, our system of photoacid-enabled depolymerization and repolymerization selects for healed materials to yield organized, robust fibres. Our method provides a chemical route for error-checking, distinct from thermal annealing, that improves the morphologies and properties of supramolecular materials using out-of-equilibrium systems.
🔬 Techniques
💻 Software
✨ Fluorophores
🧪 Sample Preparation
🔬 Cell Lines
🏭 Microscope Brands
🧪 Reagent Suppliers
📷 Detectors
💻 Software Details
🏛️ Research Organizations (ROR)
Affiliated research institutions:
📋 Methods
Chemicals and kits
Magnesium chloride, TRIS acetate EDTA (TAE) buffer, TRIS-base, sodium chloride, Phosphate Buffer Saline, ethidium Bromide solution (10 mg/mL), Pluronic F-127 (#540025–50ML) and Amicon ultra 0.5 centrifugal filter (#UFC5003) were provided by Sigma-Aldrich. Nuclease free water was purchased from Integrated DNA Technologies, Inc. (IDT). The DNTPs mix (#N0447S), the DNA ladder (Quick-Load® Purple 2-Log DNA ladder 0.1–10 kb, #N0550S) were provided by New England Biolabs (NEB), The polymerase enzyme (Accustart Taq DNA polymerase HiFi, #95085–05K) was provided by Quanta Biosciences. Low melt agarose was purchased from IBI Scientific (#IB70058) and the agarose from Seakem, Inc. G-capsule for electroelution (#786–001) was purchased from G-Biosciences and Freeze ‘N Squeeze DNA gel extraction columns by Bio-rad, Inc. (#732–6165). The Zymoclean Gel DNA recovery kit (#D4008) was purchased from Zymo Research, Inc. The SybrSafe DNA staining reagent was provided by Thermo Fisher Scientific, Inc. PEG3500 (#A4010–1/MAL-PEG3500-MAL) and PEG2000 (#A4010–1/MAL-PEG2000-MAL) bismaleimide were purchased from JenKem Technology. - Oligonucleotides and DNA templates All oligonucleotides used for asymmetric PCR (aPCR) amplification of the template and for folding the various scaffolded DNA origami nanoparticles (NPs) were purchased from IDT. The circular plasmid DNA scaffold M13mp18 used for amplification of the short scaffolds with aPCR (Supplementary sequences are provided in the supplementary Table 10 – 17 ) was acquired from NEB (#N4040S). - Antigens and cell lines The eOD antigen with a 6xHis tag and N-terminal cysteine was prepared as previously described 20 . Plasmids were transiently transfected into Expi293 cells (ThermoFisher Scientific, not authenticated). After 5 days, cell culture supernatants were collected and protein was purified in an ÄKTA pure chromatography system using HiTrap HP Ni sepharose affinity column, followed by size exclusion chromatography using Superdex 75 Increase 10/300 GL column (GE Healthcare Life Sciences). Endotoxin levels in purified protein was measured using Endosafe Nexgen-PTS system (Charles River) and assured to be < 5EU/mg protein. PNA conjugated peptide antigens p31 (HDWRSGFGGFQHLCC-O-Linker-cagtccagt-K(AF-647)) and p5 (SGSVTYLPTPEWALQSGS-O-Linker-cagtccagt-K(AF-647)) were purchased from PNA Bio. Ramos B cells stably expressing VRC01 germline IgM B cell receptor were provided by Dr. Daniel Lingwood (Ragon Institute of MGH, MIT and Harvard) 43 , 44 . As described previously, VRC01 germline cells were generated by stable lentiviral transduction of surface IgM-negative Ramos B cells and IgM-BCR-expressing cells were sorted by flow cytometry. Antigen-specific receptor expression levels after transduction were characterized previously and found to be ~12,000 per cell 44 . Functional expression of germline VRC01 was confirmed by flow cytometry analysis of labeled eOD probes binding to the VRC01 Ramos cells. Both Expi293 and germline VRC01-expressing Ramos B cells tested negative for mycoplasma. - ssDNA scaffold synthesis The ssDNA scaffolds used to fold the DNA six helix bundle (6-HB) and the DNA icosahedron NPs were produced using the previously described procedure asymmetric PCR 18 , 45 . Briefly, two specific primers sets were used to amplify the ssDNA fragments ( Supplementary Table 3 ) using Quanta Accustart HiFi DNA polymerase. The aPCR mix was prepared at a final volume of 50 μL with the specific polymerase buffer complemented with 2 mM magnesium chloride, 200 μM dNTPs, 1μM forward primer, 20 nM reverse primer, 25 ng M13mp18 template, and 1 unit of Quanta Accustart HiFi polymerase. The amplification protocol used was: 94°C for 1 min for initial denaturation followed by 35 cycles of 94°C held for 20 sec; 56°C held for 30 sec; 68°C held for 1 min per kb for amplification. Following amplification, the aPCR mix was run on a 1% low-melt agarose gel prestained with Ethidium Bromide (EtBr). The resulting ssDNA product was then extracted using the Zymoclean gel DNA recovery kit. The custom circular DNA scaffold phPB84 used for the pentagonal bipyramid DNA-NP was prepared as previously published 46 . Purified ssDNA concentration was measured using a NanoDrop 2000 (Thermo Scientific). - DNA-NP folding DNA-NPs (icosahedron, pentagonal bipyramid, and 6-HB) with or without overhangs were self-assembled using a one-pot reaction and annealing as described previously 17 , 18 . Briefly, 20–40 nM of scaffold was mixed with an excess of the staple strand mix (molar ratio of 10x) in buffer TAE-MgCl 2 (40 mM Tris, 20 mM acetic acid, 2 mM EDTA, 16 mM MgCl 2 , pH 8.0) in a final reaction volume of 50 uL and annealed with the following program: 95°C for 5 min, 80–75°C at 1°C per 5 min, 75–30°C at 1°C per 15 min, and 30–25°C at 1°C per 10 min. In the case of the pentagonal bipyramid, the reverse-complement oligonucleotide to the overhang sequence was added to the reaction mixture at 2-fold excess over the total concentration of the overhang sequence. The folded NPs are stored at 4°C in the folding buffer with the excess of staples strands prior to perform conjugation with antigens. - DNA-NP purification Before using the DNA-NPs for conjugation with antigens and for the B cell activation assay, the DNA origami objects folded with an excess of staples strands were purified using an Amicon ultra 0.5 centrifugal filter with three washes of folding buffer and an extra wash of 1X PBS for further modification with antigens. In the case of the pentagonal bipyramid, DNA-NPs with overhangs were purified into TAE-MgCl 2 buffer prior to functionalization with antigen and concentrated to at least 5-fold over the target concentration for the functionalization reaction. Centrifugation steps were performed at 1000g for 30–40 minutes and the final concentration of NPs was determined using a NanoDrop 2000. Purified NPs were subsequently modified with antigens or stored in 1X PBS (or TAE-MgCl 2 buffer) at 4°C. - PNA strand synthesis PNA strands were synthesized in-house using solid phase peptide synthesis. Lysine residues were attached at either end of the PNA sequence to improve solubility. Fmoc-PNA monomers (PNA-Bio, Inc.) were coupled to a low loading Tentagel-S-RAM resin using 4 eq. PNA, 3.95 eq. PyBOP, and 6 eq. diisopropylethylamine (DIEA). Lysine and glycine residues were reacted in the same way. Following each coupling, the peptide was deprotected in 20% piperidine in DMF. N-maleoyl-β-alanine (Sigma) was coupled to the N-terminus under the same coupling conditions. The peptide was then cleaved from the resin in 95% trifluoroacetic acid (TFA), 2.5% H2O, and 2.5% triisopropylsilane. The peptide was dissolved in aqueous solution with 0.1% TFA, filtered, and purified by HPLC using a C-18 Gemini column (Phenomenex) with a mobile phase of acetonitrile containing 0.1% TFA. Purity of the PNA products was analyzed with MALDI-TOF mass spectrometry on a Bruker Daltonics microflex. The sequence of the synthesized PNA strand is: (Maleimide)-GGK-cagtccagt-K-(CONH 2 ), and the complementary ssDNA is: 5’-Oligo-TT-ACTGGACTG-3’ (melting temperature predicted: 56.7°C). The sequence has been designed to have a melting temperature above 55°C (predicted with the PNA tool: https://www.pnabio.com/support/PNA_Tool.htm , from PNA Bio, Inc.) and orthogonal to the sequence of M13mp18 and validated using NCBI BLAST online tool. - Antigen-PNA conjugation PNA strands were conjugated to eOD by reacting the terminal maleimide onto an N-terminal cysteine of eOD. Prior to the reaction, eOD was incubated with a 10-fold molar excess of tris(2-carboxyethyl)phosphine (TCEP) for 15 minutes, after which TCEP was removed using a centrifugal filter. Immediately after removal of TCEP, a 2-fold molar excess of maleimide-PNA was reacted with cysteine-eOD overnight at 4C in PBS. Unreacted PNA was then removed using an Amicon centrifugal filter (10 kDa MWCO). - Antigen conjugation with AF647 dye The eOD-PNA conjugate was modified with the fluorescent label AlexaFluor 647-NHS (AF647) using a protocol previously published by Havenar-Daughton et al. 47 . Briefly, eOD-PNA was incubated with 5 molar equivalents of AF647-NHS in 10 mM sodium bicarbonate buffer for 2 hours at room temperature. Unreacted dye was removed using centrifugal filtration (10kDa MWCO). - Antigen attachment to DNA-NPs Purified DNA-NPs were mixed with PNA-antigen conjugates at a molar ratio of 5X antigen per overhang on the DNA-NPs in 1X PBS buffer. The concentration of DNA-NPs used was in the range of 50 to 100 nM. An annealing temperature ramp was used for ssPNA-ssDNA hybridization starting at 37°C and decreasing to 4°C at 1°C per 20 min and kept for at least 4 hours at 4°C prior use for B cell activation assay. Prior to use in the B cell activation assay, modified DNA-NPs were purified using a centrifugal filter, as described in the DNA-NP purification section above, to remove excess free PNA-antigens. Peptide antigens were added from DMF stock solutions and maximal target concentrations of DMF in the functionalization reaction were kept below 5% (v/v). For purification of the functionalized pentagonal bipyramid, centrifugal filters were coated with Pluronic F-127. - Structural characterization Transmission Electron Microscopy: DNA-NPs were visualized by transmission electron microscopy (TEM) using grids prepared as described previously with minor modifications 48 . Briefly, carbon supported grids with copper mesh (CF200H-CU; Electron Microscopy Sciences) were glow discharged and soaked in 100 μM MgCl2 and blotted prior to depositing DNA-NPs. 20 μl of a 10 nM DNA-NP solution was applied to a clean parafilm surface and the grid was floated for 2 minutes. While soaking, 2% uranyl formate (UF; Electron Microscopy Sciences) was neutralized with 25 mM NaOH final concentration, vortexed for 1 minute, and filtered via syringe through a 0.1 μm filter (EMD Millipore) dropwise onto the clean parafilm surface. The grid was then removed and quickly dried by edge blotting with Whatman 44 ashless paper. The grid was then immediately transferred to the 2% UF solution and incubated for 30 seconds. Again, the grid was dried by blotting along the edge with Whatman paper, and left to dry in air for an additional 30 minutes prior to imaging. Imaging was done on a FEI Tecnai G2 Spirit TWIN set to 120kV equipped with a Gatan camera. Images were acquired at 6,500x for wide-field views and 52,000x for near-field views. Images were collected using 3-second exposures. All raw images were cropped in Adobe Photoshop with subsequent autocontrast applied. Agarose Gel Electrophoresis: DNA-NPs folded and conjugated with eOD-GT8-PNA were analyzed using agarose gel electrophoresis with 2% agarose gel pre-stained with EtBr. Samples non-purified in folding buffer or purified in PBS buffer were loaded at a concentration of 20 to 50 nM of DNA origami, ran for 2–3 hours at 70 V at 4C and visualized with a transilluminator. For fluorescence gel analysis with the AF647 modified eOD-GT8 images were acquired using a Typhoon FLA 7000 at the SybrSafe excitation wavelength (473 nm), and at the AF647 excitation wavelength (635 nm). Images were subsequently merged using ImageJ software 49 . Fluorescence quantification of DNA-NP coverage with antigen: Quantification of the eOD-GT8 conjugation to DNA-NPs was performed using a Fluoromax-4 (Horiba, Inc.) fluorimeter. eOD-GT8-PNA monomers were modified with AF647 dye using NHS-NH 2 chemistry as described above, prior to conjugation via hybridization to DNA-NPs. eOD-GT8-PNA was incubated with 5 molar equivalents of AF647 for 2 hours, and subsequently purified using centrifugal spin filtration (10k MWCO). The degree of labeling was 2 dyes per protein on average. Spectra were acquired with an excitation wavelength of 630 nm (emission measured at 670 nm). A fluorescence calibration curve was first measured using free monomeric eOD-GT8-PNA conjugated with AF647 dye by varying antigen concentration, and subsequently used as a reference curve to determine the conjugation yield to DNA-NPs. Tryptophan assay for quantification of DNA-NP coverage with antigen: A tryptophan fluorescence standard curve (0 to 2 μM) was used to determine the percentage of antigen coverage on DNA-NPs. Tryptophan fluorescence was read on a fluorescence plate reader at 440 nm using an excitation wavelength of 370 nm. Absorbance quantification of DNA-NP coverage with antigen: For functionalization of purified DNA-NPs with AF-647-labeled peptide antigens, ratiometric absorbance measurements were employed to quantify coverage. The concentration of DNA-NPs was determined via absorbance measurements at 260 nm using a NanoDrop 2000 and compared to the concentration of AF-647 determined at 647 nm (ε = 270,000 1/(cm*M)). Coverage was determined in triplicate and absorbance values were extracted from the same UV-Vis spectrum. - B cell Calcium flux assay Ramos B Cells at a concentration of 10 million cells/mL were incubated with 10 μM Fluo-4 AM (ThermoFisher, Inc.) for 30 minutes at 37C. After washing once, flux assays were performed on a Tecan plate reader at 37C on a 96 well microplate with 160 μL of Fluo-4 labeled Ramos cells at 2 million cells/mL. A baseline fluorescence was then recorded for 1 minute, and 40 μL of NPs were added to the cells for a final concentration of 5 nM of antigen, unless otherwise stated. A fixed concentration of antigens was used rather than the concentration of DNA-NPs to simplify the comparison between experiments with various DNA-NPs and to assess the role of antigen concentration instead of the role of the DNA-NPs. For studies utilizing the p5 peptide antigen, primary B cells were isolated from 3–83 mouse spleens and stained via the same procedure. Primary B cells were isolated from splenocytes by negative selection using a StemCell EasySep B Cell Isolation Kit. - Animals Female 3–83 mice (H-2K K -specific BCR) 6–10 weeks of age were used for primary B cell experiments. Mice were handled under local, state, and federal guidelines following an Institutional Animal Care and Use Committee (IACUC)-approved protocol at MIT. - B cell Calcium flux data statistical analysis Raw calcium traces were normalized to a common baseline by subtracting the PBS timetrace at every timepoint, then dividing the timetrace at every point by the average of the timepoints before antigen addition. The timepoints after antigen addition were then summed for each sample in each repeat to give the calcium release above baseline (I tot ). The maximum I tot across all samples within each repeat was determined (max(I tot )), and total calcium signaling (Normalized AUC) for each sample within each repeat is then given by I tot / max(I tot ). Repeats were averaged together to yield the bar height for graphs in Figures 2 – 4 . Student’s t-test was performed on the Normalized AUCs entering into this average, where in most cases N=3 replicates. - B cell imaging Sample preparation for confocal microscopy: Ramos cells were labeled on ice at a concentration of 5 million/mL and protected from light for 30 minutes in Hank’s Buffered Salt Solution (HBSS) with 20 μg/mL human anti IgM f(Ab)1 fragment (Jackson 109-007-043) conjugated to Janelia Fluor 549. Cells were spun down and resuspended in warm HBSS at a concentration of 2 million/mL. Antigens were added to a final concentration of 5 nM by adding 50 μL antigen solution to a volume of cells between 175 μL and 400 μL, and cells were kept at 37C by incubation in a thermal bead bath. At timepoints following the addition of antigen, 100 μL of cells were removed and placed into 200 μL of 6% warm PFA solution and allowed to fix for 10 minutes at 37C. Following fixation, fixed cells were permeabilized by HBSS containing 0.1% triton-X and washed before to be diluted in 4.5 mL HBSS and centrifuged at 600g for 5 minutes. Cells were then labeled for 5 hours at 4C in 50 μL HBSS with a 1:100 dilution of anti-phospho Syk primary Ab (Millipore Sigma) and a 1:50 dilution of Phalloidin conjugated to Alexa 405 in the presence of 5 mg/mL bovine serum albumin (BSA, Sigma) and 0.1% Triton-X. Cells were diluted into 4.5 mL HBSS and centrifuged at 600g for 5 minutes, and resuspended in 4.5 mL HBSS and centrifuged again to wash before being resuspended in 100 μL HBSS. Cells were then labeled with a 1:100 dilution of secondary anti-rabbit conjugated to AF488 for 1 hour at 4C in the presence of 5 mg/ml BSA and 0.1% Triton-X, before being washed twice as above. Cells were then plated onto LabTech II 8-well glass bottom chambers modified with 0.1% Poly-L-Lysine (PLL, Sigma P8920) and allowed to adhere for at least 4 hours at 4C before performing confocal microscopy. Confocal Microscopy imaging: Confocal microscopy was performed on a Zeiss AxioVert 200M inverted microscope stand with Yokogawa CSU-22 spinning disk confocal scan head with Andor Borealis multi-point confocal system. Probes were excited by 4 laser lines in the Andor / Spectral applied Research Integrated Laser Engine: 405 nm 100 mW OPSL, 488 nm 150 mW OPSL, 561 nm 100 mW OPSL, and 642 nm 110 mW OPSL. Multipass dichroic mirror 405/488/568/647 and emission filters 450/50 nm, 525/50 nm, 605/70 nm, and 700/75 nm were used for each emission channel, respectively. Sample was imaged through a 63x oil Plan Apochromat objective with an effective pixel size of 0.092 μm/pixel. Images were captured through a Hamamatsu Orca-ER cooled CCD, and instrumentation was controlled through MetaMorph software. For each image, 9 z-planes having separation of 1.5 μm were acquired between the top and bottom of the cell, and approximately 10 fields of view were acquired for each sample. Image analysis: 16-bit images were read into MATLAB and converted to double precision. For each field of view, a maximum intensity projection (MIP) was calculated for the phalloidin channel. This was then binarized using adaptive thresholding, cleaned of stray pixels, and then morphological opening and closing was performed. Holes within this binarization were then filled, and discreet objects within this binarization were labeled as individual cells. For each cell in a field of view, z-planes were binarized as above using the phalloidin channel, and these z-plane binarizations were restricted to the limit of the MIP binarization for each cell. The convex hull of this z-plane binarization was used to estimate the extent of the cell, and the cell surface was estimated by selecting the perimeter of the z-plane binarization and dilating this 25 times in a 4-connected neighborhood and subsequent restriction by the undilated cell extent binarization. The total intensity of cellular probes and the surface intensity of cellular probes was calculated through summation using all z-stacks after logical indexing of the background-subtracted raw z-plane images, where background was estimated to be a constant through all z-planes and channels. Pixel-based correlation was performed through pairwise linear correlation of pixel values between channels following logical indexing. Average intensity values shown are an average over cells, and errorbars shown are the standard errors of the means, given by the standard deviation divided by sqrt(N cells ). Internalized fraction of probe intensity for a single cell is given by (total cell intensity – cell surface intensity) / total cell intensity.
Show full methods section
Chemicals and kits
Magnesium chloride, TRIS acetate EDTA (TAE) buffer, TRIS-base, sodium chloride, Phosphate Buffer Saline, ethidium Bromide solution (10 mg/mL), Pluronic F-127 (#540025–50ML) and Amicon ultra 0.5 centrifugal filter (#UFC5003) were provided by Sigma-Aldrich. Nuclease free water was purchased from Integrated DNA Technologies, Inc. (IDT). The DNTPs mix (#N0447S), the DNA ladder (Quick-Load® Purple 2-Log DNA ladder 0.1–10 kb, #N0550S) were provided by New England Biolabs (NEB), The polymerase enzyme (Accustart Taq DNA polymerase HiFi, #95085–05K) was provided by Quanta Biosciences. Low melt agarose was purchased from IBI Scientific (#IB70058) and the agarose from Seakem, Inc. G-capsule for electroelution (#786–001) was purchased from G-Biosciences and Freeze ‘N Squeeze DNA gel extraction columns by Bio-rad, Inc. (#732–6165). The Zymoclean Gel DNA recovery kit (#D4008) was purchased from Zymo Research, Inc. The SybrSafe DNA staining reagent was provided by Thermo Fisher Scientific, Inc. PEG3500 (#A4010–1/MAL-PEG3500-MAL) and PEG2000 (#A4010–1/MAL-PEG2000-MAL) bismaleimide were purchased from JenKem Technology. - Oligonucleotides and DNA templates All oligonucleotides used for asymmetric PCR (aPCR) amplification of the template and for folding the various scaffolded DNA origami nanoparticles (NPs) were purchased from IDT. The circular plasmid DNA scaffold M13mp18 used for amplification of the short scaffolds with aPCR (Supplementary sequences are provided in the supplementary Table 10 – 17 ) was acquired from NEB (#N4040S). - Antigens and cell lines The eOD antigen with a 6xHis tag and N-terminal cysteine was prepared as previously described 20 . Plasmids were transiently transfected into Expi293 cells (ThermoFisher Scientific, not authenticated). After 5 days, cell culture supernatants were collected and protein was purified in an ÄKTA pure chromatography system using HiTrap HP Ni sepharose affinity column, followed by size exclusion chromatography using Superdex 75 Increase 10/300 GL column (GE Healthcare Life Sciences). Endotoxin levels in purified protein was measured using Endosafe Nexgen-PTS system (Charles River) and assured to be < 5EU/mg protein. PNA conjugated peptide antigens p31 (HDWRSGFGGFQHLCC-O-Linker-cagtccagt-K(AF-647)) and p5 (SGSVTYLPTPEWALQSGS-O-Linker-cagtccagt-K(AF-647)) were purchased from PNA Bio. Ramos B cells stably expressing VRC01 germline IgM B cell receptor were provided by Dr. Daniel Lingwood (Ragon Institute of MGH, MIT and Harvard) 43 , 44 . As described previously, VRC01 germline cells were generated by stable lentiviral transduction of surface IgM-negative Ramos B cells and IgM-BCR-expressing cells were sorted by flow cytometry. Antigen-specific receptor expression levels after transduction were characterized previously and found to be ~12,000 per cell 44 . Functional expression of germline VRC01 was confirmed by flow cytometry analysis of labeled eOD probes binding to the VRC01 Ramos cells. Both Expi293 and germline VRC01-expressing Ramos B cells tested negative for mycoplasma. - ssDNA scaffold synthesis The ssDNA scaffolds used to fold the DNA six helix bundle (6-HB) and the DNA icosahedron NPs were produced using the previously described procedure asymmetric PCR 18 , 45 . Briefly, two specific primers sets were used to amplify the ssDNA fragments ( Supplementary Table 3 ) using Quanta Accustart HiFi DNA polymerase. The aPCR mix was prepared at a final volume of 50 μL with the specific polymerase buffer complemented with 2 mM magnesium chloride, 200 μM dNTPs, 1μM forward primer, 20 nM reverse primer, 25 ng M13mp18 template, and 1 unit of Quanta Accustart HiFi polymerase. The amplification protocol used was: 94°C for 1 min for initial denaturation followed by 35 cycles of 94°C held for 20 sec; 56°C held for 30 sec; 68°C held for 1 min per kb for amplification. Following amplification, the aPCR mix was run on a 1% low-melt agarose gel prestained with Ethidium Bromide (EtBr). The resulting ssDNA product was then extracted using the Zymoclean gel DNA recovery kit. The custom circular DNA scaffold phPB84 used for the pentagonal bipyramid DNA-NP was prepared as previously published 46 . Purified ssDNA concentration was measured using a NanoDrop 2000 (Thermo Scientific). - DNA-NP folding DNA-NPs (icosahedron, pentagonal bipyramid, and 6-HB) with or without overhangs were self-assembled using a one-pot reaction and annealing as described previously 17 , 18 . Briefly, 20–40 nM of scaffold was mixed with an excess of the staple strand mix (molar ratio of 10x) in buffer TAE-MgCl 2 (40 mM Tris, 20 mM acetic acid, 2 mM EDTA, 16 mM MgCl 2 , pH 8.0) in a final reaction volume of 50 uL and annealed with the following program: 95°C for 5 min, 80–75°C at 1°C per 5 min, 75–30°C at 1°C per 15 min, and 30–25°C at 1°C per 10 min. In the case of the pentagonal bipyramid, the reverse-complement oligonucleotide to the overhang sequence was added to the reaction mixture at 2-fold excess over the total concentration of the overhang sequence. The folded NPs are stored at 4°C in the folding buffer with the excess of staples strands prior to perform conjugation with antigens. - DNA-NP purification Before using the DNA-NPs for conjugation with antigens and for the B cell activation assay, the DNA origami objects folded with an excess of staples strands were purified using an Amicon ultra 0.5 centrifugal filter with three washes of folding buffer and an extra wash of 1X PBS for further modification with antigens. In the case of the pentagonal bipyramid, DNA-NPs with overhangs were purified into TAE-MgCl 2 buffer prior to functionalization with antigen and concentrated to at least 5-fold over the target concentration for the functionalization reaction. Centrifugation steps were performed at 1000g for 30–40 minutes and the final concentration of NPs was determined using a NanoDrop 2000. Purified NPs were subsequently modified with antigens or stored in 1X PBS (or TAE-MgCl 2 buffer) at 4°C. - PNA strand synthesis PNA strands were synthesized in-house using solid phase peptide synthesis. Lysine residues were attached at either end of the PNA sequence to improve solubility. Fmoc-PNA monomers (PNA-Bio, Inc.) were coupled to a low loading Tentagel-S-RAM resin using 4 eq. PNA, 3.95 eq. PyBOP, and 6 eq. diisopropylethylamine (DIEA). Lysine and glycine residues were reacted in the same way. Following each coupling, the peptide was deprotected in 20% piperidine in DMF. N-maleoyl-β-alanine (Sigma) was coupled to the N-terminus under the same coupling conditions. The peptide was then cleaved from the resin in 95% trifluoroacetic acid (TFA), 2.5% H2O, and 2.5% triisopropylsilane. The peptide was dissolved in aqueous solution with 0.1% TFA, filtered, and purified by HPLC using a C-18 Gemini column (Phenomenex) with a mobile phase of acetonitrile containing 0.1% TFA. Purity of the PNA products was analyzed with MALDI-TOF mass spectrometry on a Bruker Daltonics microflex. The sequence of the synthesized PNA strand is: (Maleimide)-GGK-cagtccagt-K-(CONH 2 ), and the complementary ssDNA is: 5’-Oligo-TT-ACTGGACTG-3’ (melting temperature predicted: 56.7°C). The sequence has been designed to have a melting temperature above 55°C (predicted with the PNA tool: https://www.pnabio.com/support/PNA_Tool.htm , from PNA Bio, Inc.) and orthogonal to the sequence of M13mp18 and validated using NCBI BLAST online tool. - Antigen-PNA conjugation PNA strands were conjugated to eOD by reacting the terminal maleimide onto an N-terminal cysteine of eOD. Prior to the reaction, eOD was incubated with a 10-fold molar excess of tris(2-carboxyethyl)phosphine (TCEP) for 15 minutes, after which TCEP was removed using a centrifugal filter. Immediately after removal of TCEP, a 2-fold molar excess of maleimide-PNA was reacted with cysteine-eOD overnight at 4C in PBS. Unreacted PNA was then removed using an Amicon centrifugal filter (10 kDa MWCO). - Antigen conjugation with AF647 dye The eOD-PNA conjugate was modified with the fluorescent label AlexaFluor 647-NHS (AF647) using a protocol previously published by Havenar-Daughton et al. 47 . Briefly, eOD-PNA was incubated with 5 molar equivalents of AF647-NHS in 10 mM sodium bicarbonate buffer for 2 hours at room temperature. Unreacted dye was removed using centrifugal filtration (10kDa MWCO). - Antigen attachment to DNA-NPs Purified DNA-NPs were mixed with PNA-antigen conjugates at a molar ratio of 5X antigen per overhang on the DNA-NPs in 1X PBS buffer. The concentration of DNA-NPs used was in the range of 50 to 100 nM. An annealing temperature ramp was used for ssPNA-ssDNA hybridization starting at 37°C and decreasing to 4°C at 1°C per 20 min and kept for at least 4 hours at 4°C prior use for B cell activation assay. Prior to use in the B cell activation assay, modified DNA-NPs were purified using a centrifugal filter, as described in the DNA-NP purification section above, to remove excess free PNA-antigens. Peptide antigens were added from DMF stock solutions and maximal target concentrations of DMF in the functionalization reaction were kept below 5% (v/v). For purification of the functionalized pentagonal bipyramid, centrifugal filters were coated with Pluronic F-127. - Structural characterization Transmission Electron Microscopy: DNA-NPs were visualized by transmission electron microscopy (TEM) using grids prepared as described previously with minor modifications 48 . Briefly, carbon supported grids with copper mesh (CF200H-CU; Electron Microscopy Sciences) were glow discharged and soaked in 100 μM MgCl2 and blotted prior to depositing DNA-NPs. 20 μl of a 10 nM DNA-NP solution was applied to a clean parafilm surface and the grid was floated for 2 minutes. While soaking, 2% uranyl formate (UF; Electron Microscopy Sciences) was neutralized with 25 mM NaOH final concentration, vortexed for 1 minute, and filtered via syringe through a 0.1 μm filter (EMD Millipore) dropwise onto the clean parafilm surface. The grid was then removed and quickly dried by edge blotting with Whatman 44 ashless paper. The grid was then immediately transferred to the 2% UF solution and incubated for 30 seconds. Again, the grid was dried by blotting along the edge with Whatman paper, and left to dry in air for an additional 30 minutes prior to imaging. Imaging was done on a FEI Tecnai G2 Spirit TWIN set to 120kV equipped with a Gatan camera. Images were acquired at 6,500x for wide-field views and 52,000x for near-field views. Images were collected using 3-second exposures. All raw images were cropped in Adobe Photoshop with subsequent autocontrast applied. Agarose Gel Electrophoresis: DNA-NPs folded and conjugated with eOD-GT8-PNA were analyzed using agarose gel electrophoresis with 2% agarose gel pre-stained with EtBr. Samples non-purified in folding buffer or purified in PBS buffer were loaded at a concentration of 20 to 50 nM of DNA origami, ran for 2–3 hours at 70 V at 4C and visualized with a transilluminator. For fluorescence gel analysis with the AF647 modified eOD-GT8 images were acquired using a Typhoon FLA 7000 at the SybrSafe excitation wavelength (473 nm), and at the AF647 excitation wavelength (635 nm). Images were subsequently merged using ImageJ software 49 . Fluorescence quantification of DNA-NP coverage with antigen: Quantification of the eOD-GT8 conjugation to DNA-NPs was performed using a Fluoromax-4 (Horiba, Inc.) fluorimeter. eOD-GT8-PNA monomers were modified with AF647 dye using NHS-NH 2 chemistry as described above, prior to conjugation via hybridization to DNA-NPs. eOD-GT8-PNA was incubated with 5 molar equivalents of AF647 for 2 hours, and subsequently purified using centrifugal spin filtration (10k MWCO). The degree of labeling was 2 dyes per protein on average. Spectra were acquired with an excitation wavelength of 630 nm (emission measured at 670 nm). A fluorescence calibration curve was first measured using free monomeric eOD-GT8-PNA conjugated with AF647 dye by varying antigen concentration, and subsequently used as a reference curve to determine the conjugation yield to DNA-NPs. Tryptophan assay for quantification of DNA-NP coverage with antigen: A tryptophan fluorescence standard curve (0 to 2 μM) was used to determine the percentage of antigen coverage on DNA-NPs. Tryptophan fluorescence was read on a fluorescence plate reader at 440 nm using an excitation wavelength of 370 nm. Absorbance quantification of DNA-NP coverage with antigen: For functionalization of purified DNA-NPs with AF-647-labeled peptide antigens, ratiometric absorbance measurements were employed to quantify coverage. The concentration of DNA-NPs was determined via absorbance measurements at 260 nm using a NanoDrop 2000 and compared to the concentration of AF-647 determined at 647 nm (ε = 270,000 1/(cm*M)). Coverage was determined in triplicate and absorbance values were extracted from the same UV-Vis spectrum. - B cell Calcium flux assay Ramos B Cells at a concentration of 10 million cells/mL were incubated with 10 μM Fluo-4 AM (ThermoFisher, Inc.) for 30 minutes at 37C. After washing once, flux assays were performed on a Tecan plate reader at 37C on a 96 well microplate with 160 μL of Fluo-4 labeled Ramos cells at 2 million cells/mL. A baseline fluorescence was then recorded for 1 minute, and 40 μL of NPs were added to the cells for a final concentration of 5 nM of antigen, unless otherwise stated. A fixed concentration of antigens was used rather than the concentration of DNA-NPs to simplify the comparison between experiments with various DNA-NPs and to assess the role of antigen concentration instead of the role of the DNA-NPs. For studies utilizing the p5 peptide antigen, primary B cells were isolated from 3–83 mouse spleens and stained via the same procedure. Primary B cells were isolated from splenocytes by negative selection using a StemCell EasySep B Cell Isolation Kit. - Animals Female 3–83 mice (H-2K K -specific BCR) 6–10 weeks of age were used for primary B cell experiments. Mice were handled under local, state, and federal guidelines following an Institutional Animal Care and Use Committee (IACUC)-approved protocol at MIT. - B cell Calcium flux data statistical analysis Raw calcium traces were normalized to a common baseline by subtracting the PBS timetrace at every timepoint, then dividing the timetrace at every point by the average of the timepoints before antigen addition. The timepoints after antigen addition were then summed for each sample in each repeat to give the calcium release above baseline (I tot ). The maximum I tot across all samples within each repeat was determined (max(I tot )), and total calcium signaling (Normalized AUC) for each sample within each repeat is then given by I tot / max(I tot ). Repeats were averaged together to yield the bar height for graphs in Figures 2 – 4 . Student’s t-test was performed on the Normalized AUCs entering into this average, where in most cases N=3 replicates. - B cell imaging Sample preparation for confocal microscopy: Ramos cells were labeled on ice at a concentration of 5 million/mL and protected from light for 30 minutes in Hank’s Buffered Salt Solution (HBSS) with 20 μg/mL human anti IgM f(Ab)1 fragment (Jackson 109-007-043) conjugated to Janelia Fluor 549. Cells were spun down and resuspended in warm HBSS at a concentration of 2 million/mL. Antigens were added to a final concentration of 5 nM by adding 50 μL antigen solution to a volume of cells between 175 μL and 400 μL, and cells were kept at 37C by incubation in a thermal bead bath. At timepoints following the addition of antigen, 100 μL of cells were removed and placed into 200 μL of 6% warm PFA solution and allowed to fix for 10 minutes at 37C. Following fixation, fixed cells were permeabilized by HBSS containing 0.1% triton-X and washed before to be diluted in 4.5 mL HBSS and centrifuged at 600g for 5 minutes. Cells were then labeled for 5 hours at 4C in 50 μL HBSS with a 1:100 dilution of anti-phospho Syk primary Ab (Millipore Sigma) and a 1:50 dilution of Phalloidin conjugated to Alexa 405 in the presence of 5 mg/mL bovine serum albumin (BSA, Sigma) and 0.1% Triton-X. Cells were diluted into 4.5 mL HBSS and centrifuged at 600g for 5 minutes, and resuspended in 4.5 mL HBSS and centrifuged again to wash before being resuspended in 100 μL HBSS. Cells were then labeled with a 1:100 dilution of secondary anti-rabbit conjugated to AF488 for 1 hour at 4C in the presence of 5 mg/ml BSA and 0.1% Triton-X, before being washed twice as above. Cells were then plated onto LabTech II 8-well glass bottom chambers modified with 0.1% Poly-L-Lysine (PLL, Sigma P8920) and allowed to adhere for at least 4 hours at 4C before performing confocal microscopy. Confocal Microscopy imaging: Confocal microscopy was performed on a Zeiss AxioVert 200M inverted microscope stand with Yokogawa CSU-22 spinning disk confocal scan head with Andor Borealis multi-point confocal system. Probes were excited by 4 laser lines in the Andor / Spectral applied Research Integrated Laser Engine: 405 nm 100 mW OPSL, 488 nm 150 mW OPSL, 561 nm 100 mW OPSL, and 642 nm 110 mW OPSL. Multipass dichroic mirror 405/488/568/647 and emission filters 450/50 nm, 525/50 nm, 605/70 nm, and 700/75 nm were used for each emission channel, respectively. Sample was imaged through a 63x oil Plan Apochromat objective with an effective pixel size of 0.092 μm/pixel. Images were captured through a Hamamatsu Orca-ER cooled CCD, and instrumentation was controlled through MetaMorph software. For each image, 9 z-planes having separation of 1.5 μm were acquired between the top and bottom of the cell, and approximately 10 fields of view were acquired for each sample. Image analysis: 16-bit images were read into MATLAB and converted to double precision. For each field of view, a maximum intensity projection (MIP) was calculated for the phalloidin channel. This was then binarized using adaptive thresholding, cleaned of stray pixels, and then morphological opening and closing was performed. Holes within this binarization were then filled, and discreet objects within this binarization were labeled as individual cells. For each cell in a field of view, z-planes were binarized as above using the phalloidin channel, and these z-plane binarizations were restricted to the limit of the MIP binarization for each cell. The convex hull of this z-plane binarization was used to estimate the extent of the cell, and the cell surface was estimated by selecting the perimeter of the z-plane binarization and dilating this 25 times in a 4-connected neighborhood and subsequent restriction by the undilated cell extent binarization. The total intensity of cellular probes and the surface intensity of cellular probes was calculated through summation using all z-stacks after logical indexing of the background-subtracted raw z-plane images, where background was estimated to be a constant through all z-planes and channels. Pixel-based correlation was performed through pairwise linear correlation of pixel values between channels following logical indexing. Average intensity values shown are an average over cells, and errorbars shown are the standard errors of the means, given by the standard deviation divided by sqrt(N cells ). Internalized fraction of probe intensity for a single cell is given by (total cell intensity – cell surface intensity) / total cell intensity.
Supplementary Material 1
📊 Figures
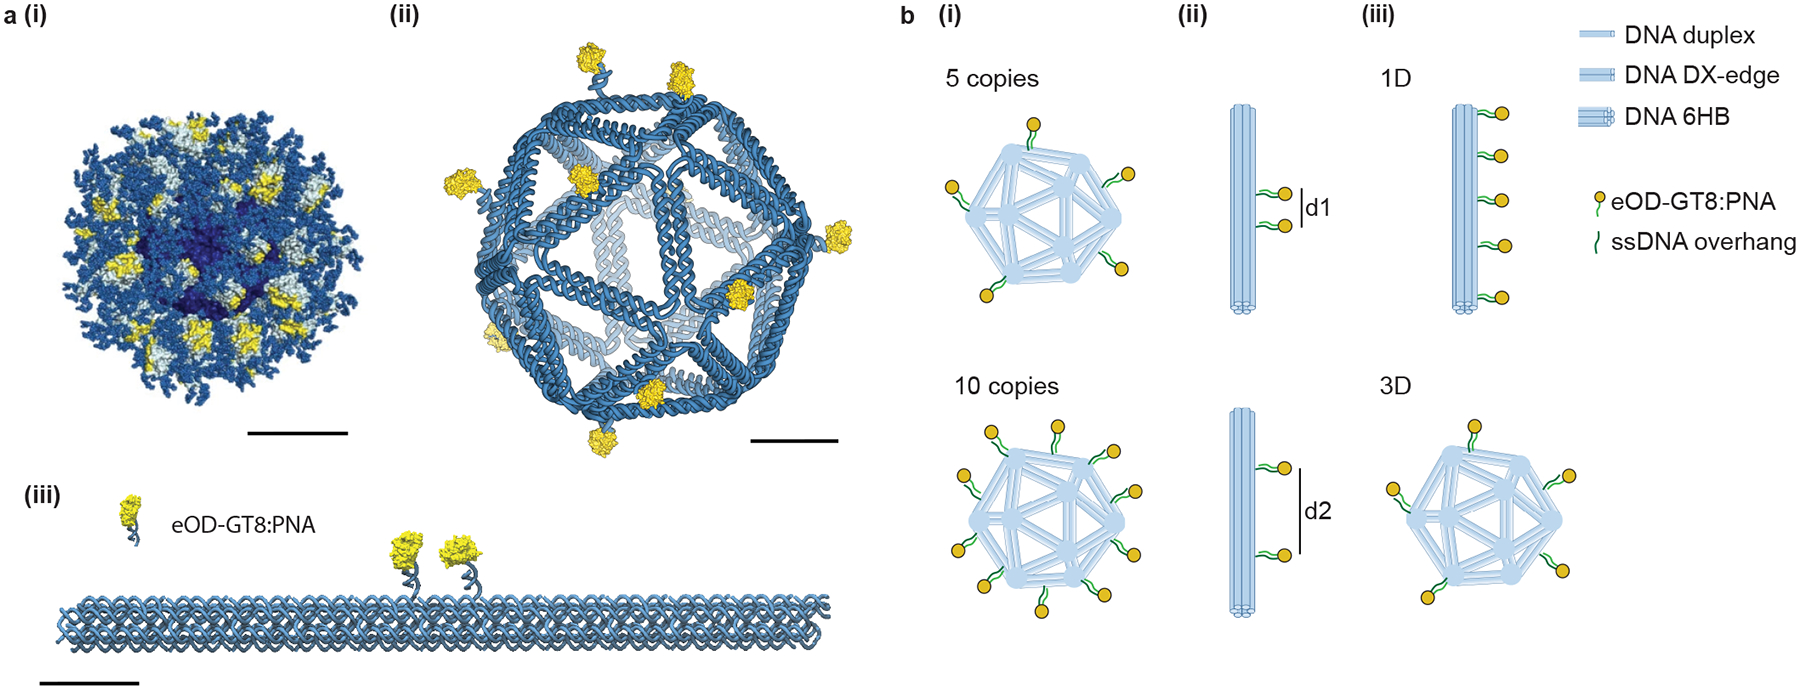
Fig. 1.
Scaffolded DNA origami nanoparticles to control nanoscale organization of HIV immunogens.
(a) DNA-NPs were designed to self-assemble the eOD-GT8 antigen in a controlled manner, mimicking features of the eOD-GT8u201360mer immunogen. ( i ) eOD-GT8u201360mer protein NP; ( ii ) Icosahedral DNA...
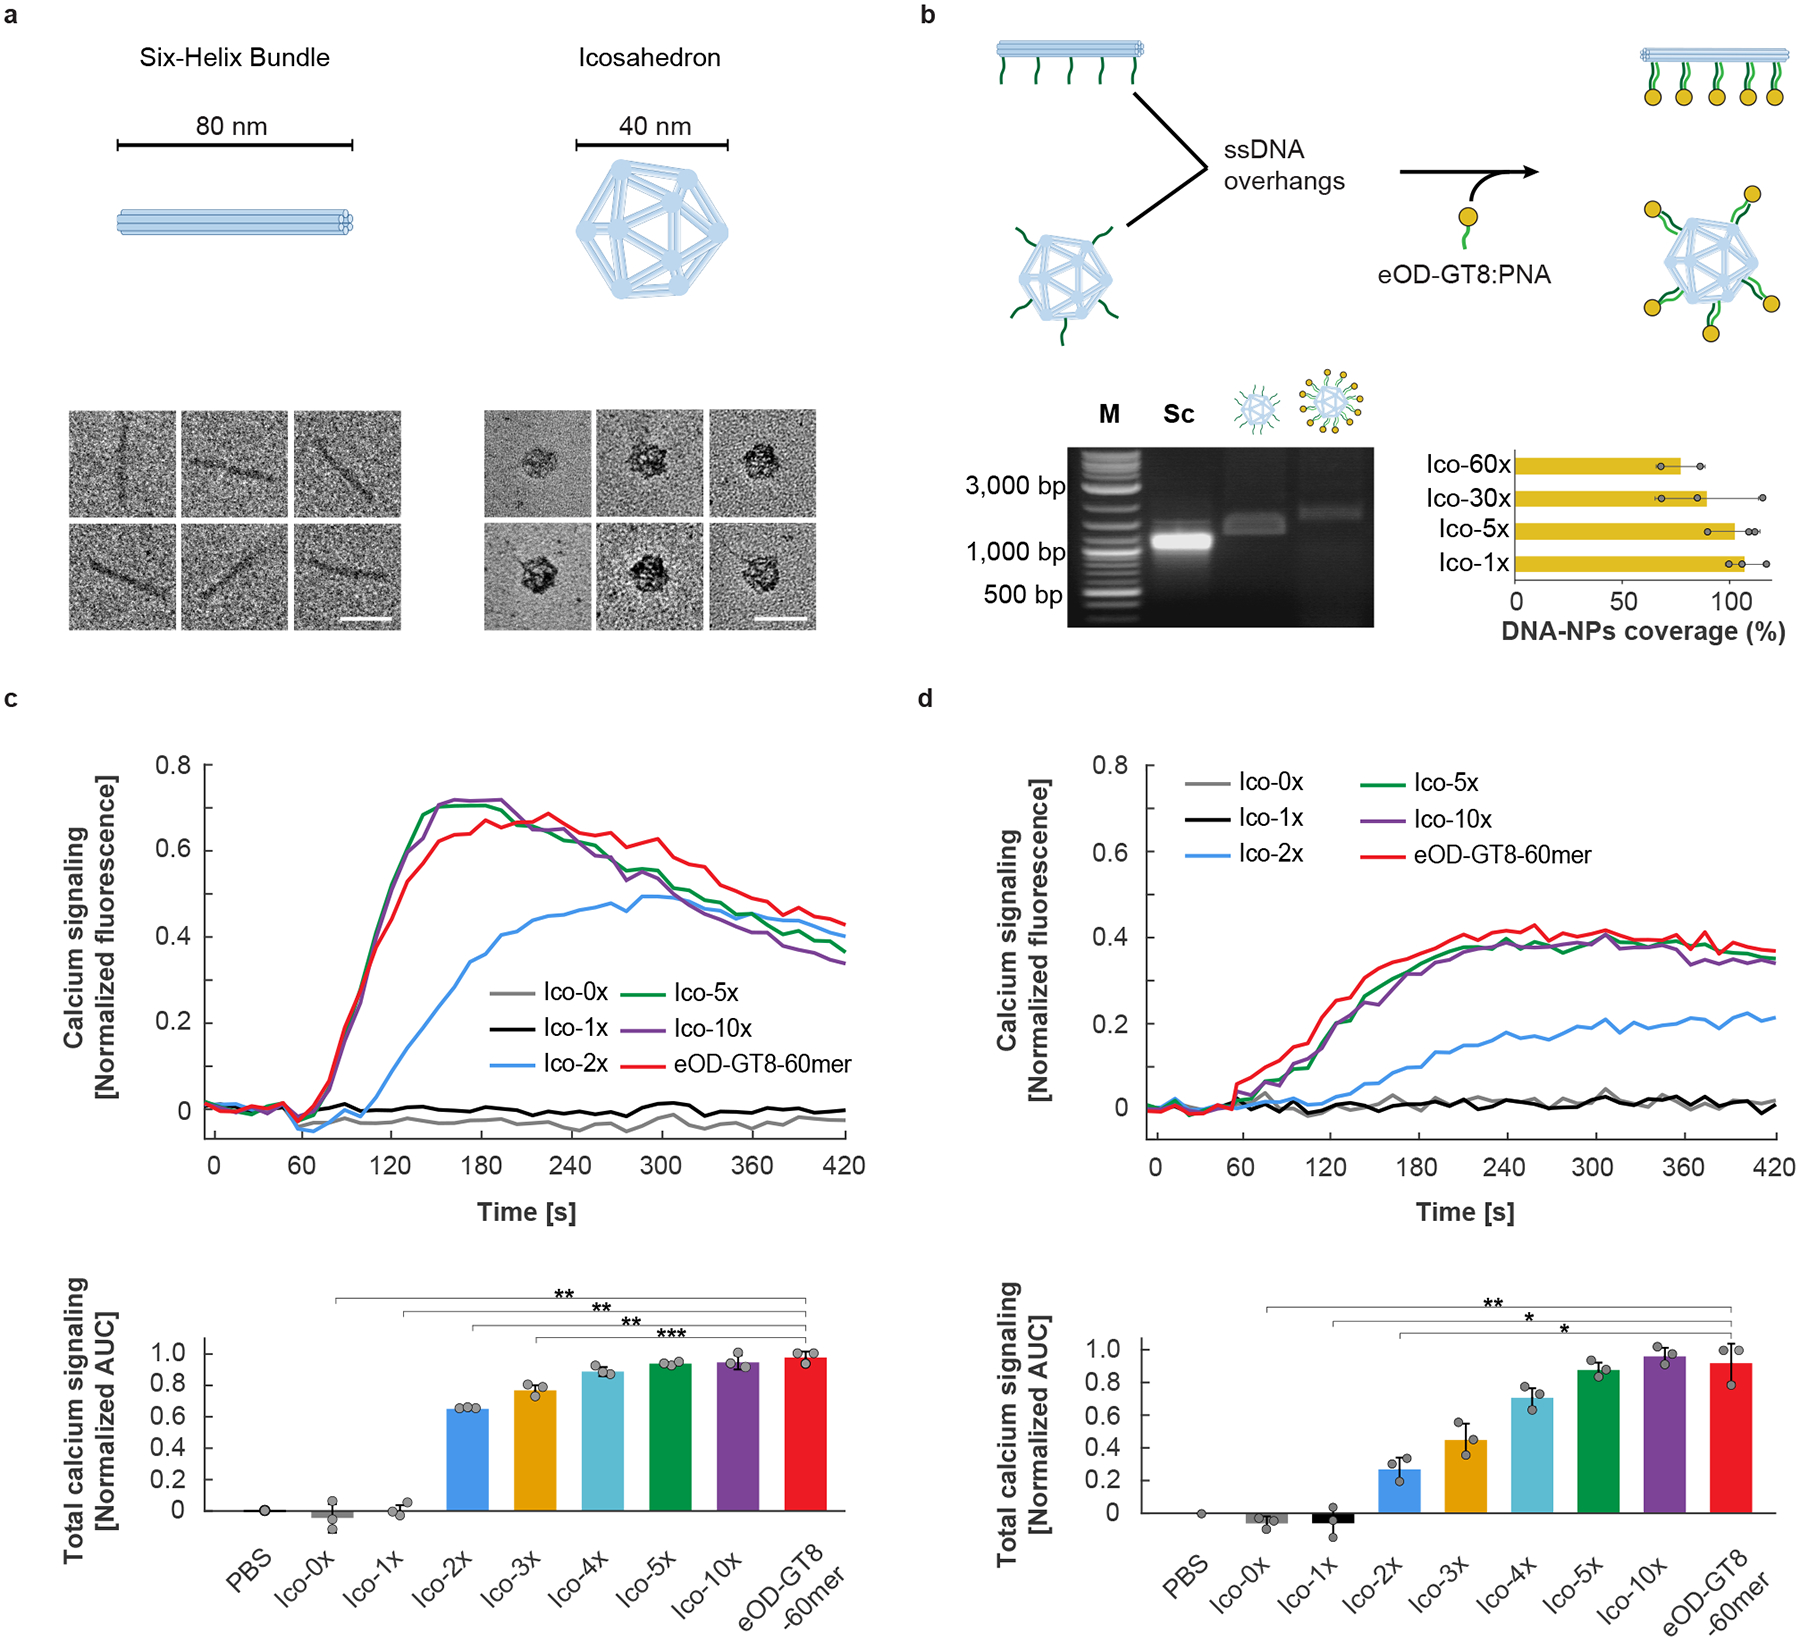
Fig. 2.
Increasing antigen valency improves B cell responses to nanoparticle antigens up to a threshold.
(a) Folding of the two types of DNA-NPs (six-helix bundle, 6HB, and DNA icosahedron) that were designed and used in this study for 1D versus 3D presentation of antigens. TEM images show high folding y...
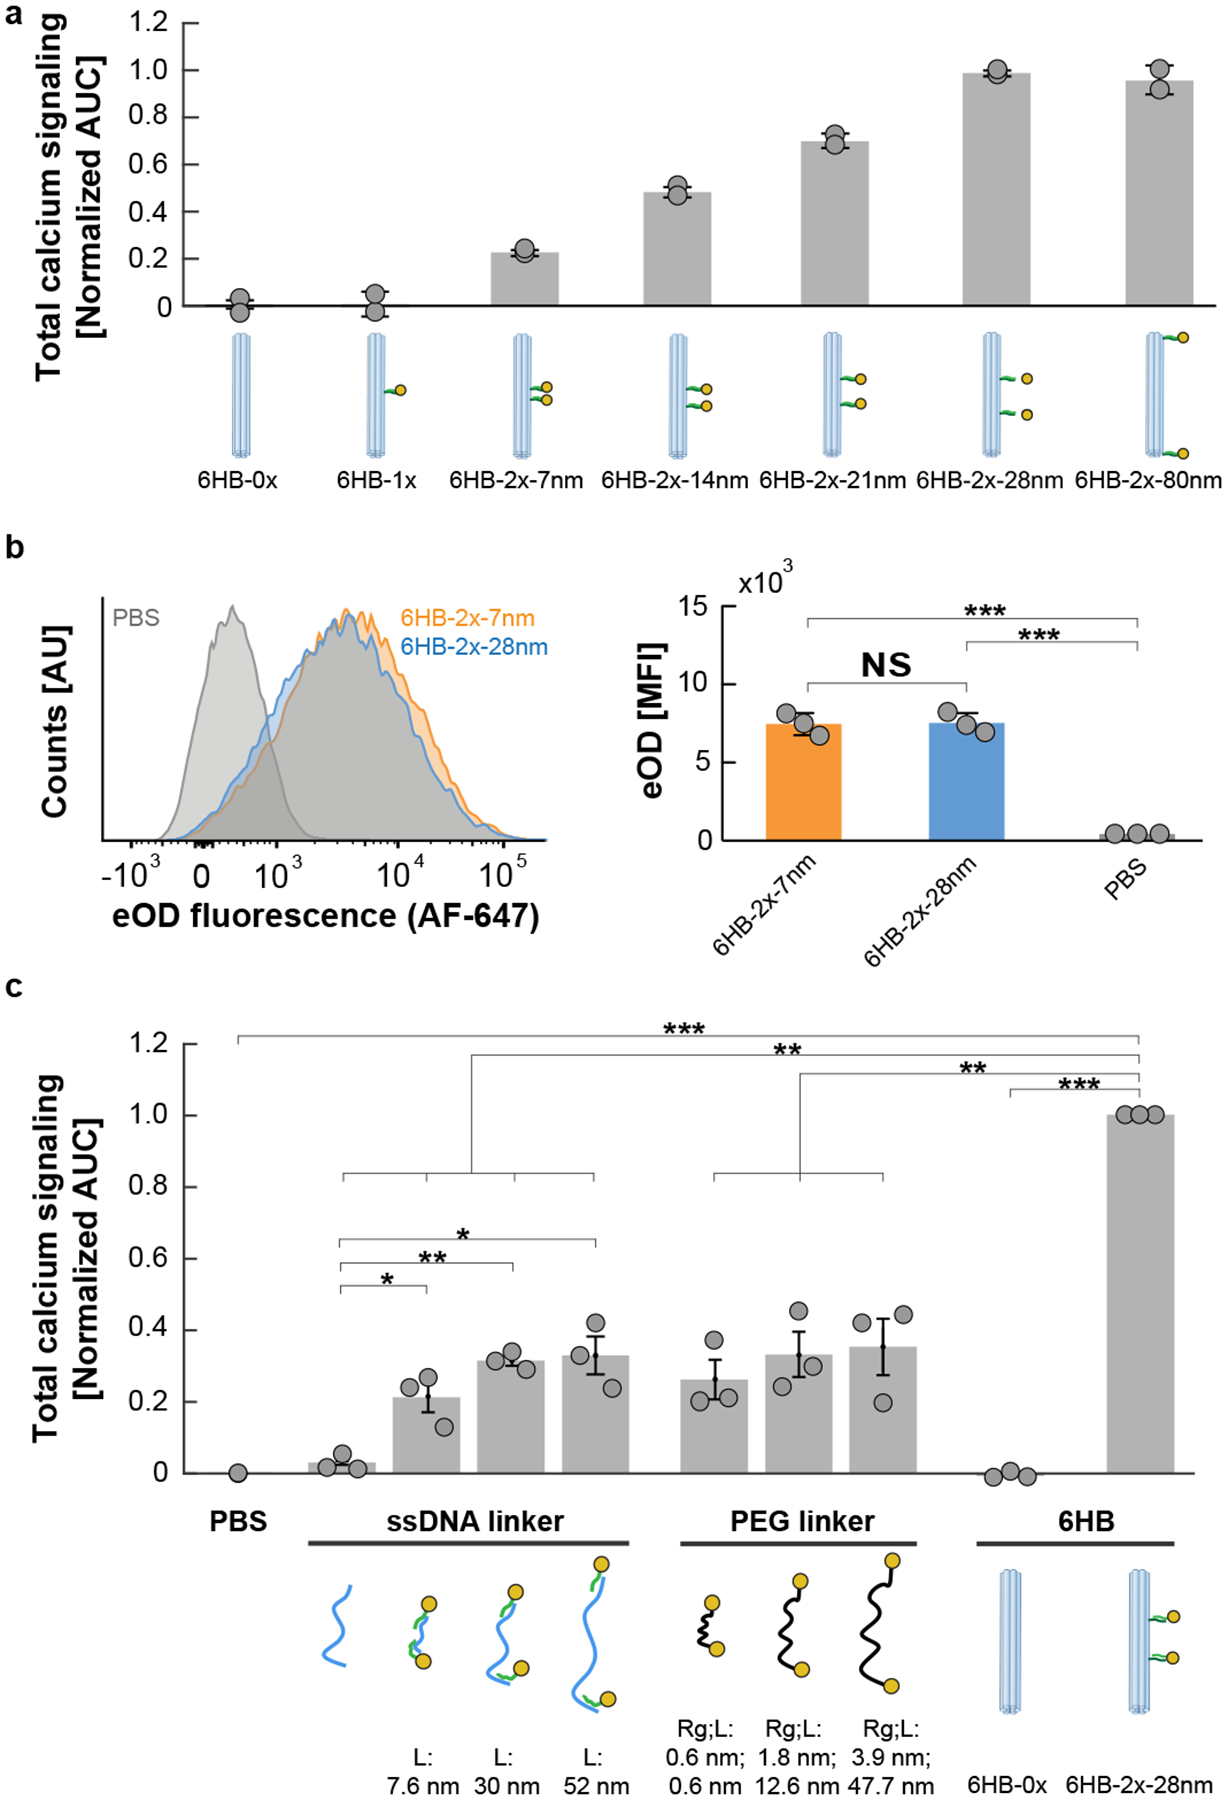
Fig. 3.
IgM-BCR response increases and then plateaus with increasing inter-antigen distance on a rigid scaffold.
(a) Area-under-the-curve total calcium signaling in glVRC01 B cells stimulated with DNA-NP eOD-GT8 dimers with inter-antigen distances between 7 nm and 80 nm at an antigen concentration of 5 nM (n=2 b...
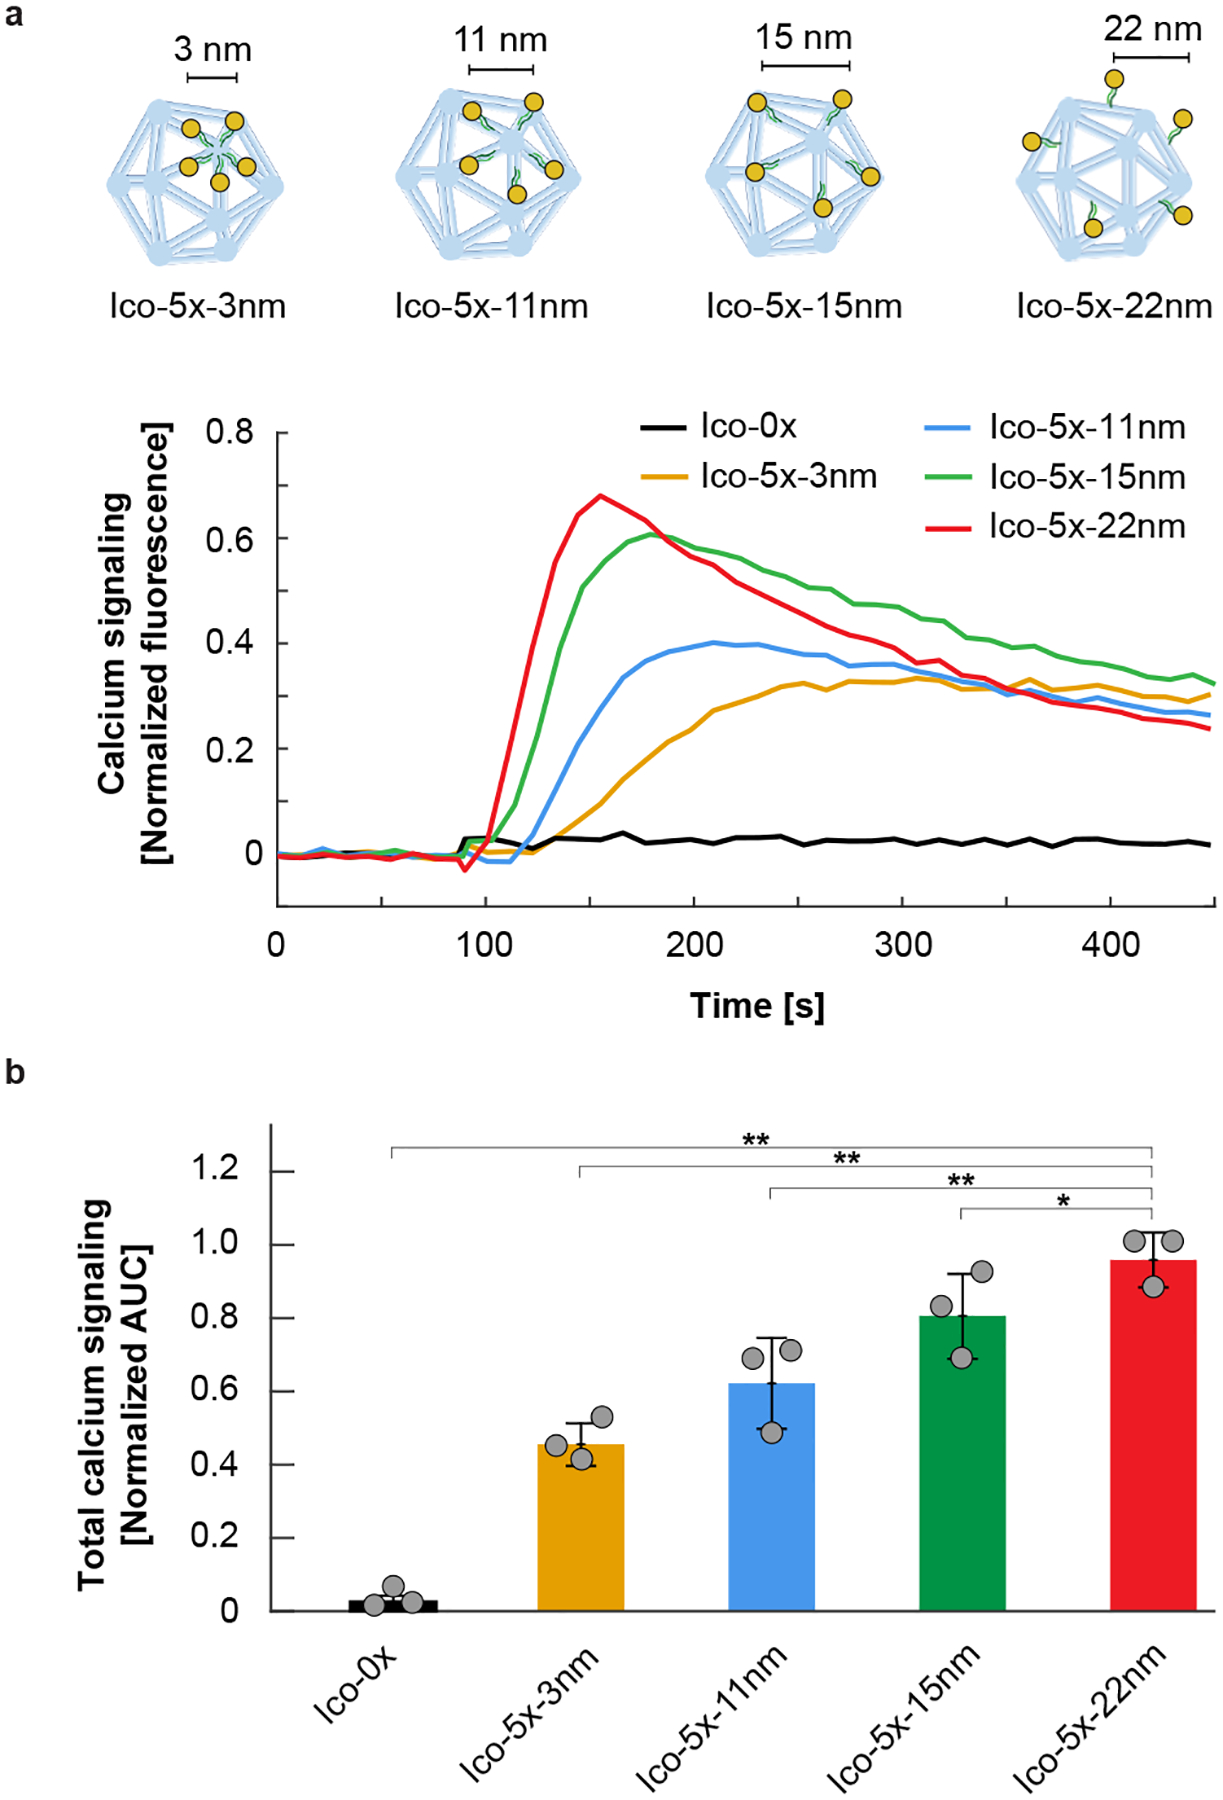
Fig. 4.
Clustering of antigens on one face of an icosahedral DNA-nanoparticle.
(a) Fluo-4 calcium probe fluorescence versus time following addition of 5 nM eOD-GT8 antigen to glVRC01 B cells. Icosahedral (Ico) structures with varying inter-antigen distances are plotted in the sa...
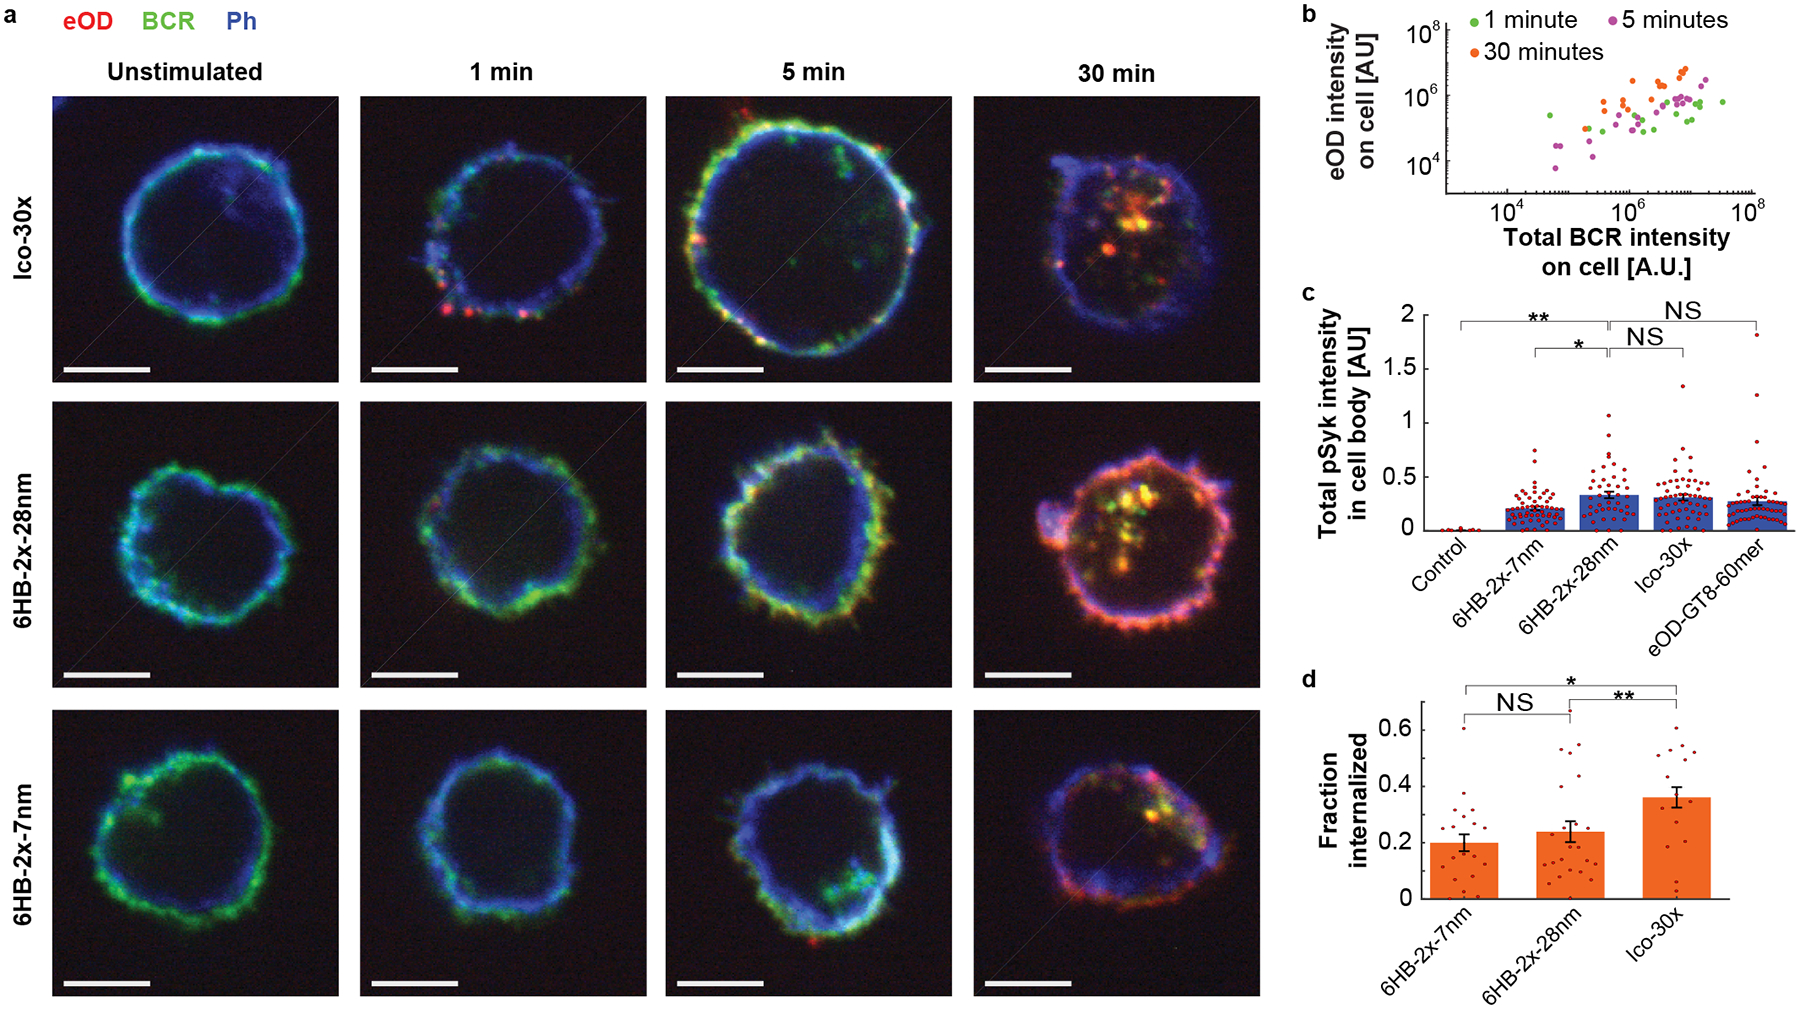
Fig. 5.
Confocal microscopic imaging of DNA-nanoparticles on Ramos B cells.
(a) Time series imaging of Ico-30x, 6HB-2x-28nm, and 6HB-2x-7nm shows surface binding and internalization into Ramos B-cells. Here, eOD-GT8 was fluorescently labelled with Alexa Fluor 647, VRC01 IgM-B...
Figure images are served from the NIH/NLM PubMed Central Open Access Subset or Europe PMC; copyright remains with the publishers and authors.
💬 Discussion
0 commentsNo comments yet. Be the first to start a discussion!
Leave a Comment