Abstract
Taste circuits are genetically determined to elicit an innate appetitive or aversive response, ensuring that animals consume nutritious foods and avoid the ingestion of toxins. We have examined the response of Drosophila melanogaster to acetic acid, a tastant that can be a metabolic resource but can also be toxic to the fly. Our data reveal that flies accommodate these conflicting attributes of acetic acid by virtue of a hunger-dependent switch in their behavioral response to this stimulus. Fed flies show taste aversion to acetic acid, whereas starved flies show a robust appetitive response. These opposing responses are mediated by two different classes of taste neurons, the sugar- and bitter-sensing neurons. Hunger shifts the behavioral response from aversion to attraction by enhancing the appetitive sugar pathway as well as suppressing the aversive bitter pathway. Thus a single tastant can drive opposing behaviors by activating distinct taste pathways modulated by internal state.
🔬 Techniques
🧬 Organisms
✨ Fluorophores
🧪 Sample Preparation
🏭 Microscope Brands
🧪 Reagent Suppliers
🔴 Lasers
📷 Detectors
💻 Software Details
💾 Data Repositories
🏛️ Research Organizations (ROR)
Affiliated research institutions:
📋 Methods
Key resources table
Reagent type (species) or resource Designation Source or reference Identifiers Additional information Genetic reagent ( Drosophila melanogaster ) wild-type control 2U (isoCJ1) Dubnau et al., 2001 Genetic reagent ( D. melanogaster ) poxn ∆M22-B5 Boll and Noll, 2002 Flybase: FBal0144686 Genetic reagent ( D. melanogaster ) poxn ∆M22-B5 with SuperA (rescue) Boll and Noll, 2002 Flybase: FBal0144670 Genetic reagent ( D. melanogaster ) ∆8Grs (R1, ∆Gr5a;; ∆Gr61a, ∆Gr64a-f) Yavuz et al., 2014 Genetic reagent ( D. melanogaster ) R1, ∆Gr5a; Gr61a-Gal4, UAS-GCaMP6m; ∆Gr61a, ∆Gr64a-f Yavuz et al., 2014 Genetic reagent ( D. melanogaster ) IR25a 1 Benton et al., 2009 Flybase: FBst0041736 Genetic reagent ( D. melanogaster ) IR25a 2 Benton et al., 2009 Flybase: FBst0041737 Genetic reagent ( D. melanogaster ) IR76b 1 Zhang et al., 2013 Flybase: FBst0051309 Genetic reagent ( D. melanogaster ) IR76b 2 Zhang et al., 2013 Flybase: FBst0051310 Genetic reagent ( D. melanogaster ) w 1118 Amrein lab Flybase: FBst0003605 Genetic reagent ( D. melanogaster ) Gr64f-Gal4 Dahanukar et al., 2007 Flybase: FBtp0057275 Genetic reagent ( D. melanogaster ) Gr66a-Gal4 Scott et al., 2001 Flybase: FBtp0014661 Genetic reagent ( D. melanogaster ) Gr98d-Gal4 Weiss et al., 2011 Flybase: FBst0057692 Genetic reagent ( D. melanogaster ) Gr22f-Gal4 Weiss et al., 2011 Flybase: FBst0057610 Genetic reagent ( D. melanogaster ) Gr59c-Gal4 Weiss et al., 2011 Flybase: FBst0057650 Genetic reagent ( D. melanogaster ) Gr47a-Gal4 Weiss et al., 2011 Flybase: FBst0057638 Genetic reagent ( D. melanogaster ) ppk28-Gal4 Cameron et al., 2010 Flybase: FBtp0054514 Genetic reagent ( D. melanogaster ) UAS-Kir2.1 Baines et al., 2001 Flybase: FBtp0014166 Genetic reagent ( D. melanogaster ) UAS-GCaMP6f Chen et al., 2013 Flybase: FBst0042747 Genetic reagent ( D. melanogaster ) UAS-norpA RNAi Masek and Keene, 2013 Flybase: FBst0031113 Chemical compound, drug acetic acid Sigma-Aldrich 338826 Chemical compound, drug sucrose Sigma-Aldrich S9378 Chemical compound, drug lobeline hydrochloride Sigma-Aldrich 141879 Chemical compound, drug quinine hydrochloride dihydrate Sigma-Aldrich Q1125 Chemical compound, drug myristic acid Sigma-Aldrich M3128 Software, algorithm Prism, version 4 GraphPad Software, algorithm MATLAB Mathworks Other two-photon laser scanning microscope Ultima, Bruker Other Ti:S laser Chameleon Vision, Coherent Other GaAsP detector Hamamatsu Photonics Fly stocks and maintenance Flies were reared at 25°C and 70% relative humidity on standard cornmeal food. The wild-type control strain was 2U ( isoCJ1 ; Dubnau et al., 2001 ). All lines used for behavior were outcrossed into this background for at least five generations, with the exception of the ∆8Grs line which contained too many mutations to outcross and the IR25a and IR76b mutants which were tested with the w 1118 controls that other studies have used ( Chen and Amrein, 2017 ; Ahn et al., 2017 ). PER assays were generally performed on 3–6 day-old mated females. Calcium imaging was performed on >1 week-old flies to ensure robust GCaMP6f expression, and PER assays for GCaMP6f-expressing flies were performed using flies of the same age. All fly strains have been described previously: Gr64f-Gal4 ( Dahanukar et al., 2007 ); Gr66a-Gal4 ( Scott et al., 2001 ); ppk28-Gal4 ( Cameron et al., 2010 ); Gr98d-Gal4 , Gr22f-Gal4 , Gr59c-Gal4 , and Gr47a-Gal4 ( Weiss et al., 2011 ); UAS-Kir2.1 ( Baines et al., 2001 ); UAS-GCaMP6f ( Chen et al., 2013 ); UAS-norpA RNAi ( Masek and Keene, 2013 ); poxn ∆M22-B5 and poxn ∆M22-B5 + SuperA rescue ( Boll and Noll, 2002 ); ∆8Grs ( R1, ∆Gr5a;; ∆Gr61a, ∆Gr64a-f ) and ∆8Grs with transgenes for GCaMP imaging ( R1, ∆Gr5a; Gr61a-Gal4, UAS-GCaMP6m; ∆Gr61a, ∆Gr64a-f ) ( Yavuz et al., 2014 ); IR25a 1 and IR25a 2 ( Benton et al., 2009 ); IR76b 1 and IR76b 2 ( Zhang et al., 2013 ).
Show full methods section
Key resources table
Reagent type (species) or resource Designation Source or reference Identifiers Additional information Genetic reagent ( Drosophila melanogaster ) wild-type control 2U (isoCJ1) Dubnau et al., 2001 Genetic reagent ( D. melanogaster ) poxn ∆M22-B5 Boll and Noll, 2002 Flybase: FBal0144686 Genetic reagent ( D. melanogaster ) poxn ∆M22-B5 with SuperA (rescue) Boll and Noll, 2002 Flybase: FBal0144670 Genetic reagent ( D. melanogaster ) ∆8Grs (R1, ∆Gr5a;; ∆Gr61a, ∆Gr64a-f) Yavuz et al., 2014 Genetic reagent ( D. melanogaster ) R1, ∆Gr5a; Gr61a-Gal4, UAS-GCaMP6m; ∆Gr61a, ∆Gr64a-f Yavuz et al., 2014 Genetic reagent ( D. melanogaster ) IR25a 1 Benton et al., 2009 Flybase: FBst0041736 Genetic reagent ( D. melanogaster ) IR25a 2 Benton et al., 2009 Flybase: FBst0041737 Genetic reagent ( D. melanogaster ) IR76b 1 Zhang et al., 2013 Flybase: FBst0051309 Genetic reagent ( D. melanogaster ) IR76b 2 Zhang et al., 2013 Flybase: FBst0051310 Genetic reagent ( D. melanogaster ) w 1118 Amrein lab Flybase: FBst0003605 Genetic reagent ( D. melanogaster ) Gr64f-Gal4 Dahanukar et al., 2007 Flybase: FBtp0057275 Genetic reagent ( D. melanogaster ) Gr66a-Gal4 Scott et al., 2001 Flybase: FBtp0014661 Genetic reagent ( D. melanogaster ) Gr98d-Gal4 Weiss et al., 2011 Flybase: FBst0057692 Genetic reagent ( D. melanogaster ) Gr22f-Gal4 Weiss et al., 2011 Flybase: FBst0057610 Genetic reagent ( D. melanogaster ) Gr59c-Gal4 Weiss et al., 2011 Flybase: FBst0057650 Genetic reagent ( D. melanogaster ) Gr47a-Gal4 Weiss et al., 2011 Flybase: FBst0057638 Genetic reagent ( D. melanogaster ) ppk28-Gal4 Cameron et al., 2010 Flybase: FBtp0054514 Genetic reagent ( D. melanogaster ) UAS-Kir2.1 Baines et al., 2001 Flybase: FBtp0014166 Genetic reagent ( D. melanogaster ) UAS-GCaMP6f Chen et al., 2013 Flybase: FBst0042747 Genetic reagent ( D. melanogaster ) UAS-norpA RNAi Masek and Keene, 2013 Flybase: FBst0031113 Chemical compound, drug acetic acid Sigma-Aldrich 338826 Chemical compound, drug sucrose Sigma-Aldrich S9378 Chemical compound, drug lobeline hydrochloride Sigma-Aldrich 141879 Chemical compound, drug quinine hydrochloride dihydrate Sigma-Aldrich Q1125 Chemical compound, drug myristic acid Sigma-Aldrich M3128 Software, algorithm Prism, version 4 GraphPad Software, algorithm MATLAB Mathworks Other two-photon laser scanning microscope Ultima, Bruker Other Ti:S laser Chameleon Vision, Coherent Other GaAsP detector Hamamatsu Photonics Fly stocks and maintenance Flies were reared at 25°C and 70% relative humidity on standard cornmeal food. The wild-type control strain was 2U ( isoCJ1 ; Dubnau et al., 2001 ). All lines used for behavior were outcrossed into this background for at least five generations, with the exception of the ∆8Grs line which contained too many mutations to outcross and the IR25a and IR76b mutants which were tested with the w 1118 controls that other studies have used ( Chen and Amrein, 2017 ; Ahn et al., 2017 ). PER assays were generally performed on 3–6 day-old mated females. Calcium imaging was performed on >1 week-old flies to ensure robust GCaMP6f expression, and PER assays for GCaMP6f-expressing flies were performed using flies of the same age. All fly strains have been described previously: Gr64f-Gal4 ( Dahanukar et al., 2007 ); Gr66a-Gal4 ( Scott et al., 2001 ); ppk28-Gal4 ( Cameron et al., 2010 ); Gr98d-Gal4 , Gr22f-Gal4 , Gr59c-Gal4 , and Gr47a-Gal4 ( Weiss et al., 2011 ); UAS-Kir2.1 ( Baines et al., 2001 ); UAS-GCaMP6f ( Chen et al., 2013 ); UAS-norpA RNAi ( Masek and Keene, 2013 ); poxn ∆M22-B5 and poxn ∆M22-B5 + SuperA rescue ( Boll and Noll, 2002 ); ∆8Grs ( R1, ∆Gr5a;; ∆Gr61a, ∆Gr64a-f ) and ∆8Grs with transgenes for GCaMP imaging ( R1, ∆Gr5a; Gr61a-Gal4, UAS-GCaMP6m; ∆Gr61a, ∆Gr64a-f ) ( Yavuz et al., 2014 ); IR25a 1 and IR25a 2 ( Benton et al., 2009 ); IR76b 1 and IR76b 2 ( Zhang et al., 2013 ).
PER assay
Fed flies were taken directly from food vials for testing. Starved flies were food-deprived with water (using a wet piece of Kimwipe) for the specified amount of time before testing. Flies were anesthetized on ice and immobilized on their backs with myristic acid. Unless otherwise specified, PER experiments were conducted by taste stimulation of the labellum. To ensure that we could deliver tastants to the labellum without contacting the legs, we immobilized the two anterior pairs of legs with myristic acid. For leg stimulation experiments ( Figure 1E–F , Video 1 , and Video 2 ), all legs remained free. Flies recovered from gluing for 30–60 min in a humidified chamber before testing. Before testing PER, flies were water-satiated so that thirst would not affect their responses. PER to water (the negative control) was tested after water-satiation, followed by taste stimuli in ascending order of concentration. Flies were water-satiated again before each test. Each test consisted of two trials in which the solution was briefly applied to the labellum or legs using a small piece of Kimwipe. PER on at least one of the two trials was considered a positive response. Only full proboscis extensions, not partial extensions, were counted as PER. Flies were tested in groups of 15–20, and the percent of flies showing PER to each tastant was manually observed and recorded. Flies that did not respond to any taste stimuli were tested with 500 mM sucrose at the end of the assay. For experiments using only wild-type starved flies, which should always respond to high concentrations of sugar unless they are extremely unhealthy, flies that failed to respond to 500 mM sucrose were excluded from analysis. For experiments comparing fed and starved flies or starved controls and mutants, flies were only excluded from analysis if they appeared very sick. For statistical analyses of PER, each group of 15–20 flies was considered to be a single data point (‘n’). A minimum of three groups per genotype or condition were tested for each PER experiment. Because PER can vary substantially from day to day (possibly due to changes in ambient temperature or humidity), control and experimental flies for a given experiment were always tested on the same days, and all experiments were repeated over multiple days. To test directional PER, we contacted the left or right forelegs with acetic acid, alternating between sides every 1–2 trials. Flies were filmed and the videos were analyzed later. We only analyzed trials in which flies showed full PER to the stimulus. Flies often showed repeated extension to a single stimulation; at least one proboscis extension toward the left or right side was considered to be a lateralized response. To test the role of olfaction, the third antennal segments and maxillary palps were removed with forceps while flies were anesthetized on ice. Surgery was performed prior to starvation, and after surgery flies were given ~30 min to recover in food vials before starvation. Control flies were anesthetized for the same duration as antennectomized flies.
Calcium imaging
Flies for calcium imaging were taped on their backs to a piece of clear tape in an imaging chamber (see Figure 5—figure supplement 1 ). Fine strands of tape were used to restrain the legs, secure the head, and immobilize the proboscis in an extended position for tastant stimulation. A small hole was cut into the tape to expose the anterior surface of the fly’s head. A square hole along the anterior surface of the head was then cut through the cuticle, including removal of the antennae, to expose the anterior ventral aspect of the brain that encompasses the SEZ. The esophagus was cut in order to visualize the SEZ clearly. The dissection and imaging were performed in modified artificial hemolymph in which 15 mM ribose is substituted for sucrose and trehalose ( Wang et al., 2003 ; Marella et al., 2006 ). Calcium imaging experiments were performed using a two-photon laser scanning microscope (Ultima, Bruker) equipped with an ultra-fast Ti:S laser (Chameleon Vision, Coherent) that is modulated by pockel cells (Conoptics). Emitted photons were collected with a GaAsP photodiode detector (Hamamatsu) through a 60X water-immersion objective (Olympus). A single plane through the brightest area of axonal projections was chosen for imaging. Images were acquired at 925 nm at a resolution of 256 by 256 pixels and a scanning rate of 3–4 Hz. Tastants were delivered to the labellum via a custom-built solenoid pinch valve system controlled by MATLAB software. Pinch valves were opened briefly (~10 ms) to create a small liquid drop at the end of a 5 µL glass capillary, positioned such that the drop would make contact with the labellum. Tastants were removed after a fixed duration by a vacuum line controlled by a solenoid pinch valve. Proper taste delivery was monitored using a side-mounted camera (Veho VMS-004), which allowed for visualization of the fly and tastant capillary using the light from the imaging laser. At least three trials of each stimulus were given, with at least one minute rest between trials to avoid habituation. Calcium imaging data were analyzed using custom MATLAB code based largely on the code used in Hattori et al. (2017) . Images were registered within and across trials to correct for movement in the x-y plane using a sub-pixel registration algorithm ( Guizar-Sicairos et al., 2008 ). Regions of interest (ROIs) were drawn manually around the area of axonal projections. Average pixel intensity within the ROI was calculated for each frame. The average signal for 20 frames preceding stimulus delivery was used as the baseline signal (F 0 ), and the ∆F/F 0 values for each frame were then calculated. The peak stimulus response was quantified as the average of the ∆F/F 0 values for the two highest consecutive frames during tastant presentation. No trials were excluded from analysis unless the tastant drop failed to make proper contact with the labellum. For fly by fly analyses, we defined a fly as responding to a tastant if the average peak response across at least three trials was higher than the average peak response to water by a magnitude of at least 15%. We also considered thresholds of 10% or 20% but found that 15% appeared to be a reasonable (and likely conservative) threshold for defining a fly’s response.
Statistical analyses
Statistical analyses were performed using GraphPad Prism, Version 4. The most relevant statistical results are reported in the figures and legends, and all statistical results are reported in Supplementary file 1 . All graphs represent mean ± SEM. For Gal4/UAS experiments, statistical significance was attributed only to data points for which experimental flies that differed from both the Gal4/+ and UAS/+ controls in the same direction. Sample sizes are listed in the figure legends. No explicit power analyses were used to determine sample sizes prior to experimentation. Minimum sample sizes were decided prior to experimentation based on previous experience knowing how many samples are usually sufficient to detect reasonable effect sizes. Additional samples were added if the initial results were inconclusive or more variable than expected, but never with the intent to make a non-significant p-value significant or vice versa. For experiments in which the same genotype was tested under different conditions (e.g. fed vs. starved), flies from the same vials were randomly allocated into each experimental group. In general, the experimenter was not explicitly blinded to the group or genotype.
Additional files 10.7554/eLife.47677.028 Supplementary file 1. Summary of statistical results. Summary of all statistical results from this study. 10.7554/eLife.47677.029 Transparent reporting form
📊 Figures
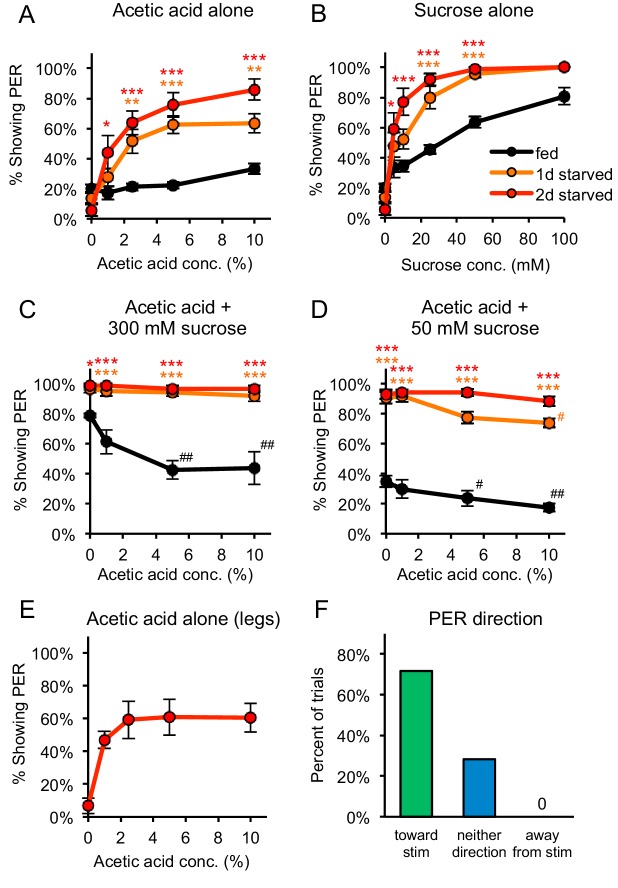
Figure 1.
Acetic acid induces aversive or appetitive taste responses depending on hunger state.
( A ) One-day or two-day starved flies, but not fed flies, showed strong PER to acetic acid applied to the labellum. PER at 0% acetic acid represents the baseline response to water. ( B ) Both fed and...
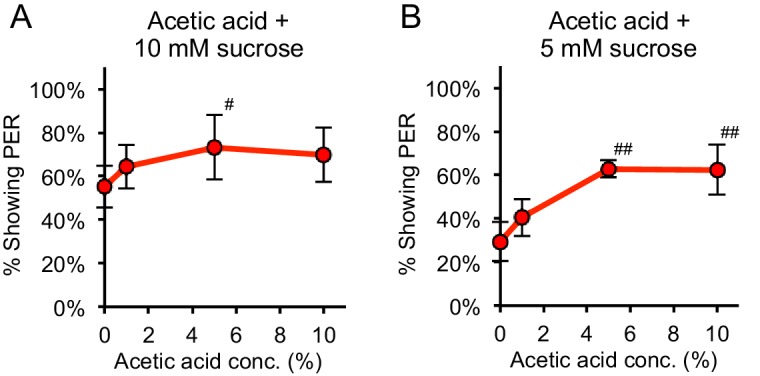
Figure 1u2014figure supplement 1.
At low sucrose concentrations acetic acid enhances sucrose-evoked PER in two-day starved flies.
( Au2013B ) When acetic acid was added to low concentrations of sucrose (10 mM in panel A and 5 mM in panel B), acetic acid enhanced sucrose-evoked PER in two-day starved flies ( # p<0.05, ## p<...
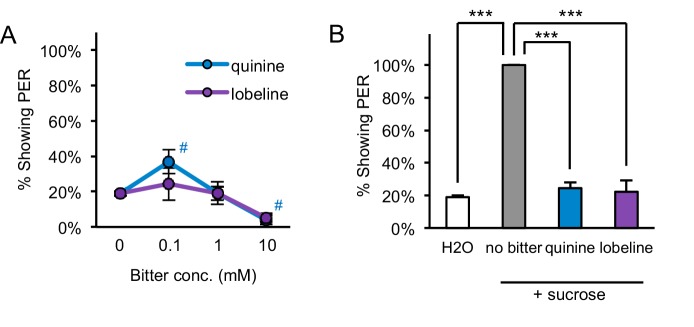
Figure 1u2014figure supplement 2.
Starved flies show aversion to bitter compounds.
( A ) Two-day starved flies did not show consistent or strong PER to the bitter compounds quinine or lobeline ( # p<0.05, one-way repeated measures ANOVA followed by Dunnett's post-tests compa...
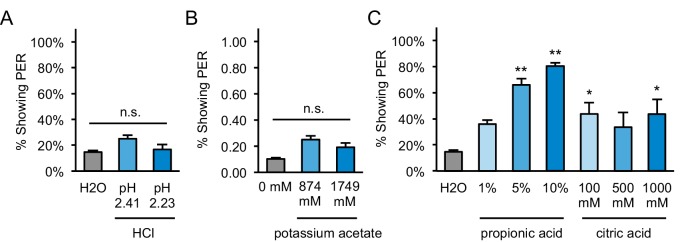
Figure 1u2014figure supplement 3.
PER to other acids and acetate in starved flies.
( A ) Two-day starved flies did not show significant PER to hydrochloric acid (HCl) solutions prepared at the same pH values as measured for 5% and 10% acetic acid (pH 2.41 and 2.23 respectively). ( B...
Video 1.
Directional PER to acetic acid.
A Kimwipe containing 5% acetic acid was alternately applied to the left or right legs of a two-day starved fly. Four trials (two left and two right) are shown in this video. In each case the fly exten...
Video 2.
Starved fly voluntarily consuming acetic acid.
A Kimwipe containing 5% acetic acid was applied to the legs of a two-day starved fly, which caused the fly to exhibit PER and ingest acetic acid from the Kimwipe for approximately 7 s.
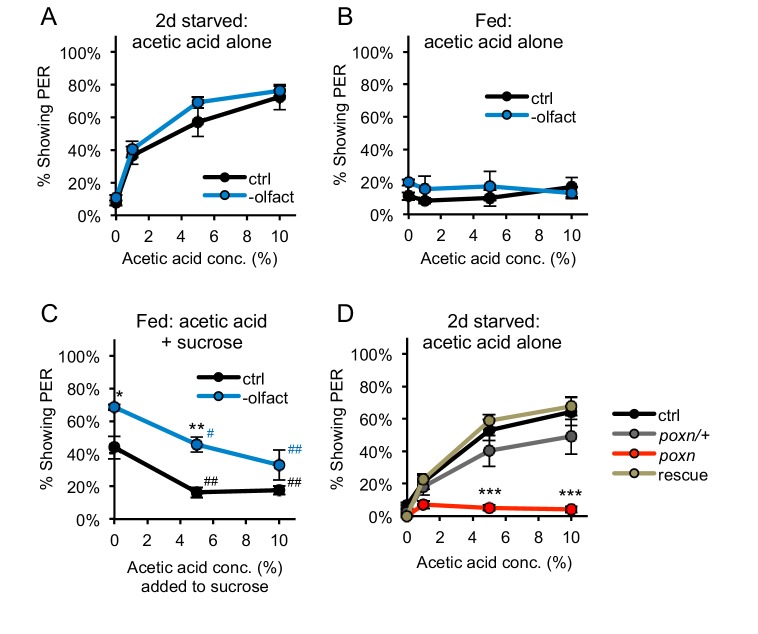
Figure 2.
PER to acetic acid is mediated by the gustatory system, not the olfactory system.
( Au2013B ) Removing the olfactory organs did not affect PER to acetic acid in two-day starved flies ( A ) or fed flies ( B ) (p>0.05). ( C ) Acetic acid aversion in fed flies, measured by suppression...
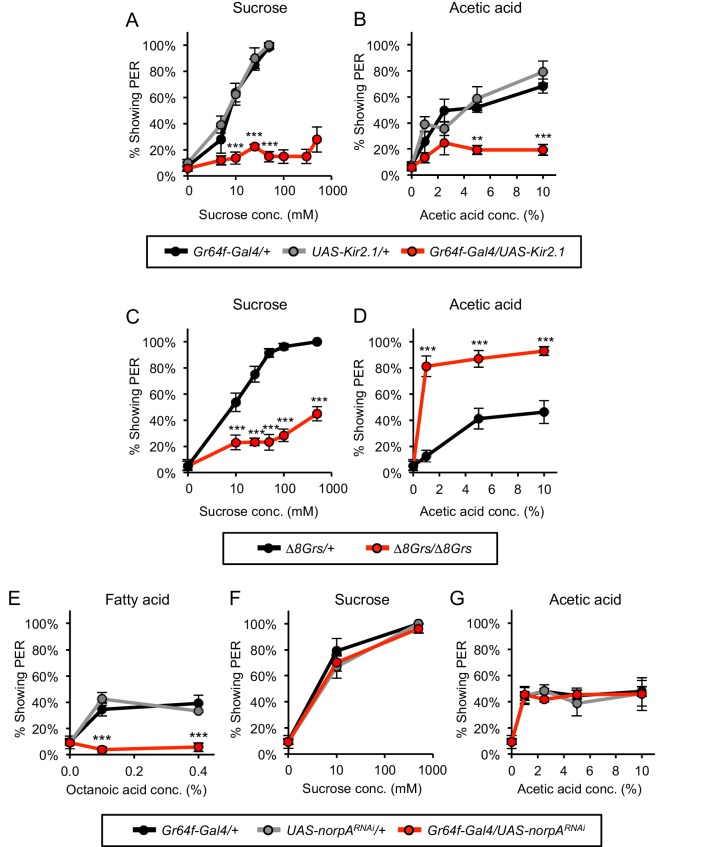
Figure 3.
Sugar-sensing neurons mediate PER to acetic acid in starved flies.
( Au2013B ) Silencing the activity of sugar-sensing neurons impaired PER to sucrose ( A ) and acetic acid ( B ) in two-day starved flies. ( Cu2013D ) One-day starved homozygous mutant flies lacking al...
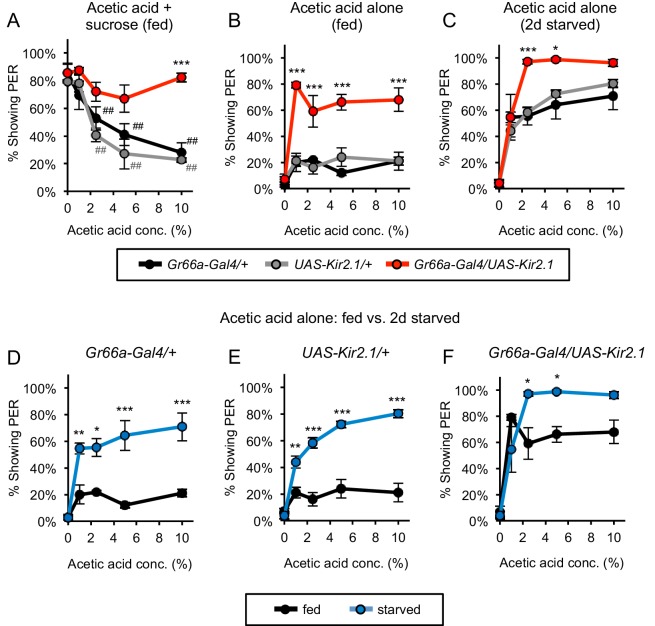
Figure 4.
Bitter-sensing neurons suppress PER to acetic acid.
( A ) Silencing bitter-sensing neurons strongly reduced aversion to acetic acid in fed flies. Aversion was measured as the suppression of PER to 100 mM sucrose containing acetic acid. Both sets of con...
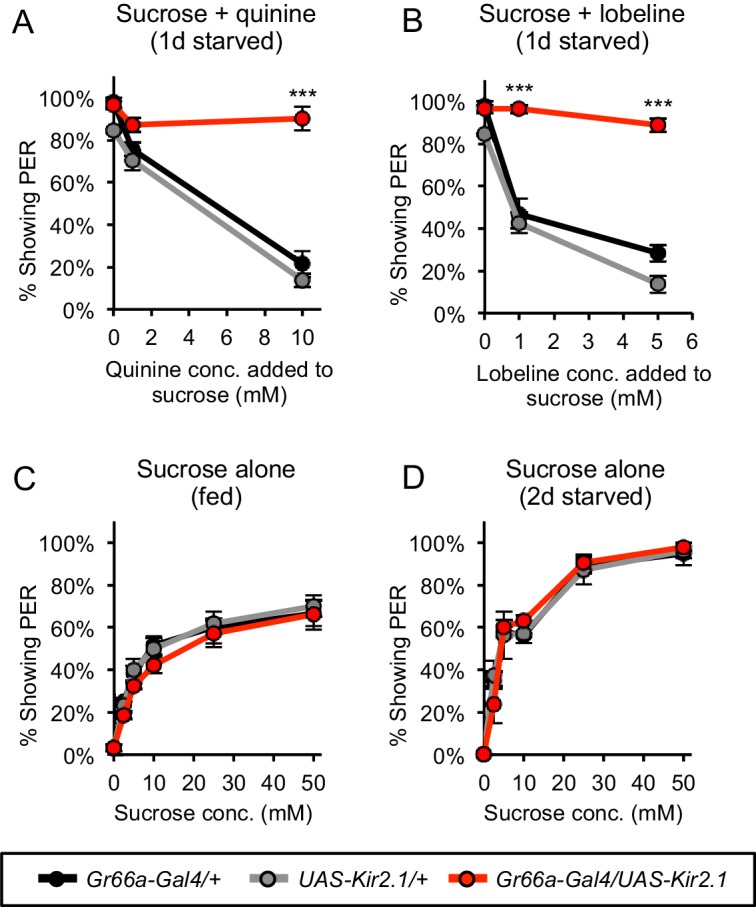
Figure 4u2014figure supplement 1.
Silencing bitter-sensing neurons impairs bitter aversion but does not affect PER to sugar.
( Au2013B ) Silencing bitter-sensing neurons strongly reduced aversion to the bitter compounds quinine ( A ) and lobeline ( B ). Aversion was measured as the suppression of PER to 100 mM sucrose conta...
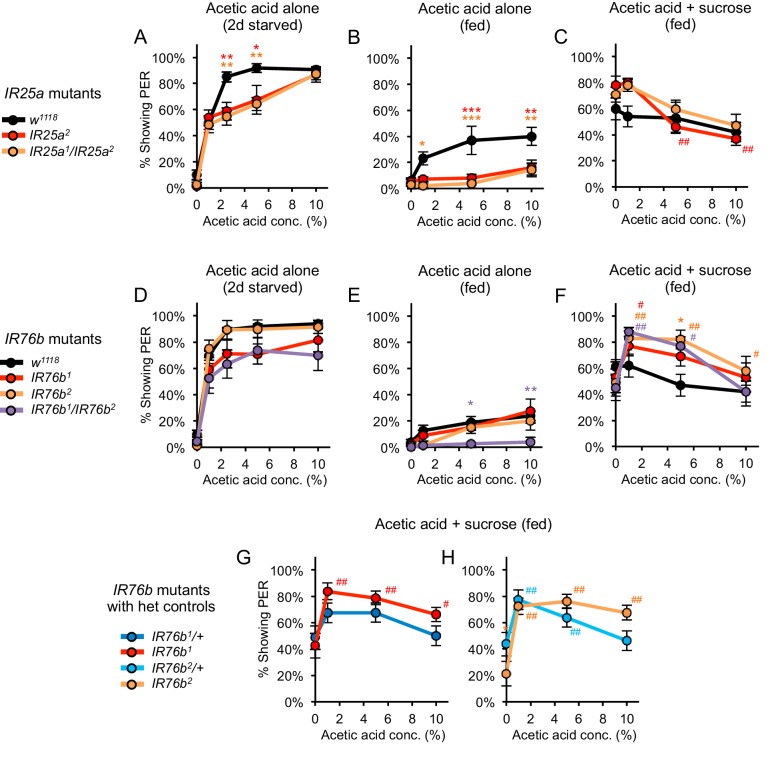
Figure 4u2014figure supplement 2.
Acetic acid responses in fed and starved flies carrying mutations in IR25a or IR76b .
Acetic acid responses in flies carrying mutations in IR25a ( Au2013C ) or IR76b ( Du2013H ). ( A, D ) Two-day starved IR25a or IR76b mutant flies showed robust PER to acetic acid, although IR25a mutan...
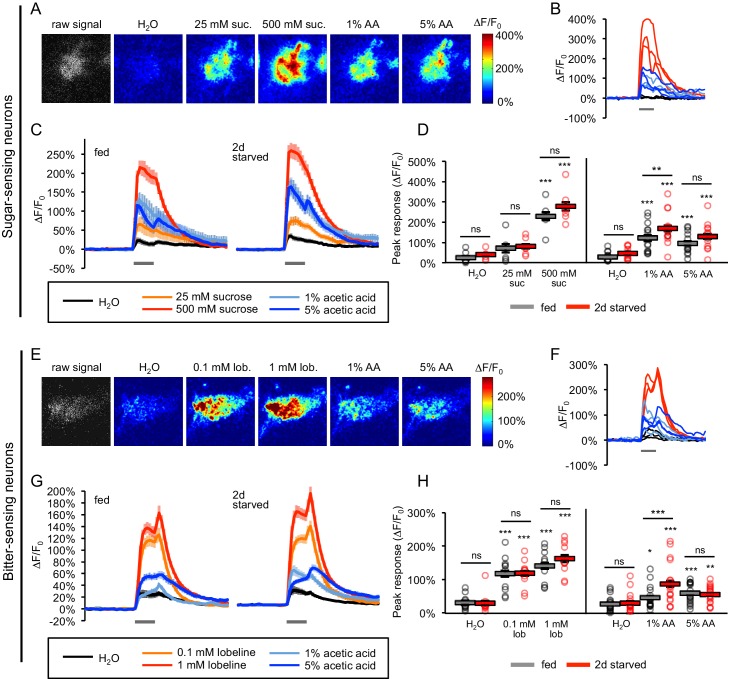
Figure 5.
Acetic acid activates sugar- and bitter-sensing neurons.
( Au2013H ) Calcium imaging of taste sensory neurons reveals that acetic acid (AA) activates sugar-sensing neurons (labeled with Gr64f-Gal4 ; panels A-D) and bitter-sensing neurons (labeled with Gr66a...
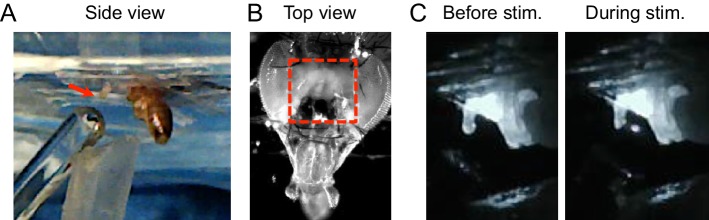
Figure 5u2014figure supplement 1.
Calcium imaging setup for taste neuron imaging.
( A ) Side view of fly. Wings and legs were taped to allow unobstructed stimulation of the labellum (arrow). Tastant droplets were delivered to the labellum via a glass microcapillary and removed by a...
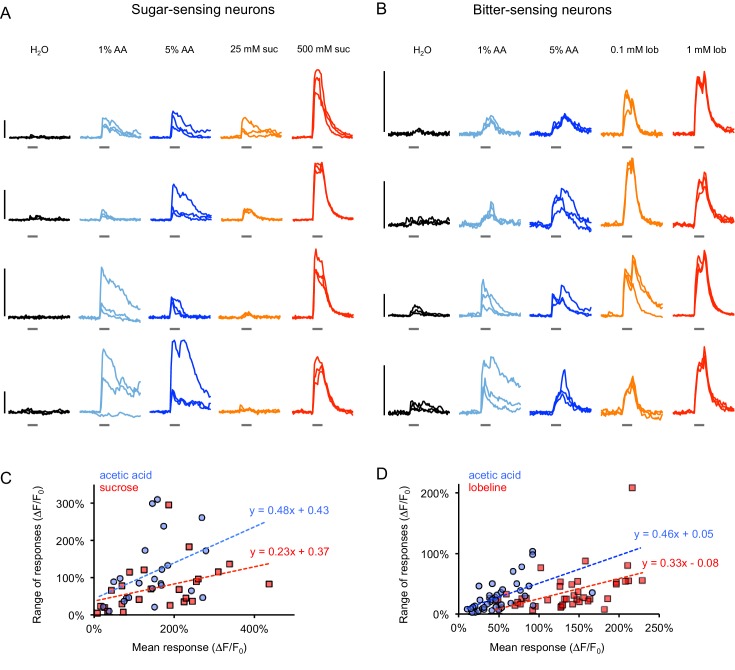
Figure 5u2014figure supplement 2.
GCaMP responses in individual flies.
( Au2013B ) Example GCaMP traces from sugar-sensing ( A ) or bitter-sensing ( B ) neurons of individual fed or starved flies for three trials of stimulation with each tastant. Sugar neurons were label...
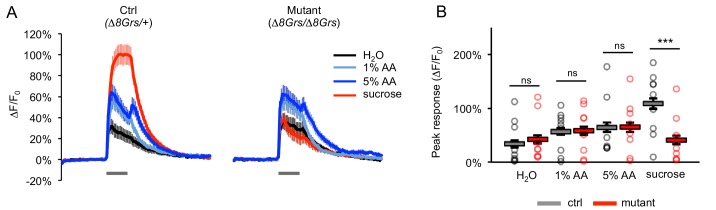
Figure 5u2014figure supplement 3.
Acetic acid responses of sugar-sensing neurons in sugar receptor mutants are not affected.
( A ) Average GCaMP activation of sugar-sensing neurons in fed control flies ( u22068Grs/+ ) and mutant flies lacking all eight sugar Grs ( u22068Grs/u22068Grs ) in response to water, 100 mM sucrose, ...
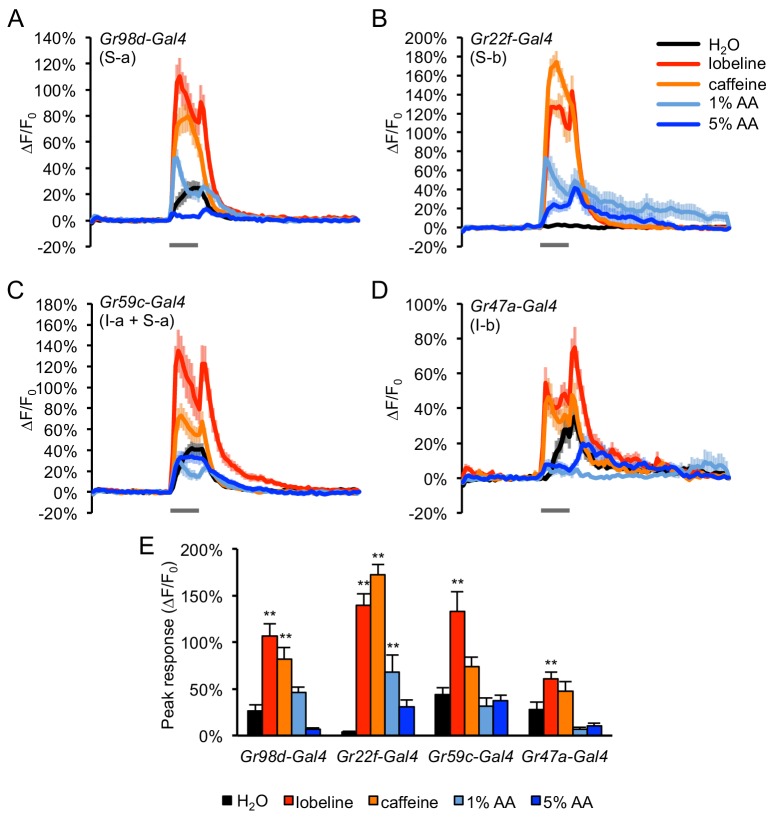
Figure 5u2014figure supplement 4.
Acetic acid activates a subset of bitter-sensing neurons.
( Au2013D ) GCaMP responses of bitter neuron subsets were imaged using Gal4 lines that label each of the four subclasses of bitter neurons (Su2013a, Su2013b, Iu2013a, Iu2013b) with complete or partial...
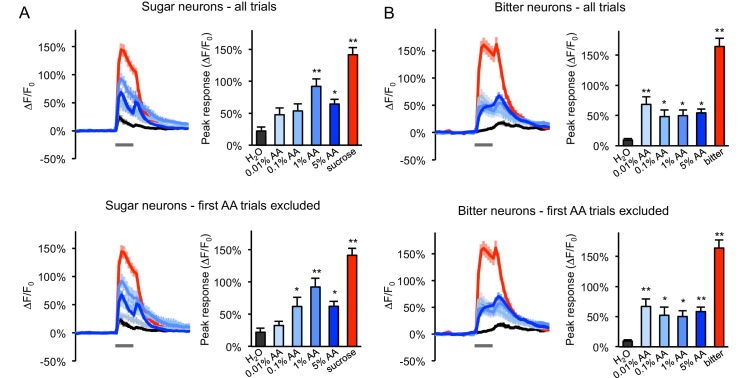
Figure 5u2014figure supplement 5.
Responses of sugar- and bitter-sensing neurons to additional acetic acid concentrations.
( Au2013B ) GCaMP responses of sugar neurons ( A ) or bitter neurons ( B ) in two-day starved flies were tested with a range of acetic acid (AA) concentrations in ascending order (nu00a0=u00a024u20133...
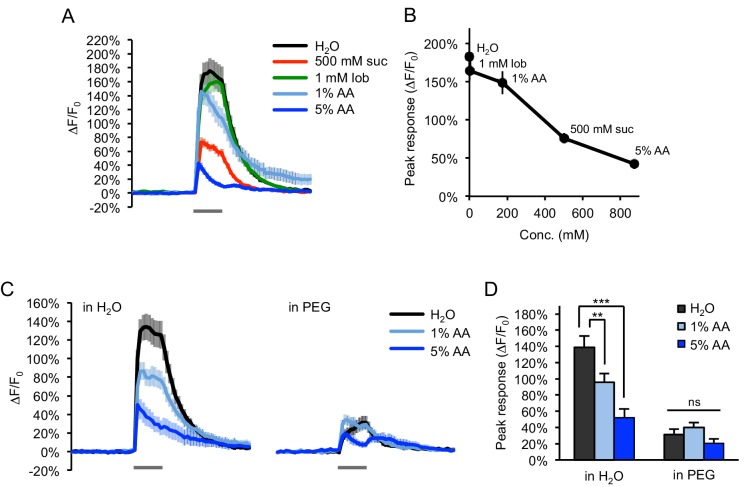
Figure 5u2014figure supplement 6.
Water-sensing neurons are activated by acetic acid only in accordance with its osmolarity.
( Au2013B ) Water-sensing neurons labeled with ppk28-Gal4 showed GCaMP responses to various taste stimuli (gray bar, 2 s), including water, sucrose (suc), lobeline (lob), and acetic acid (AA). Respons...
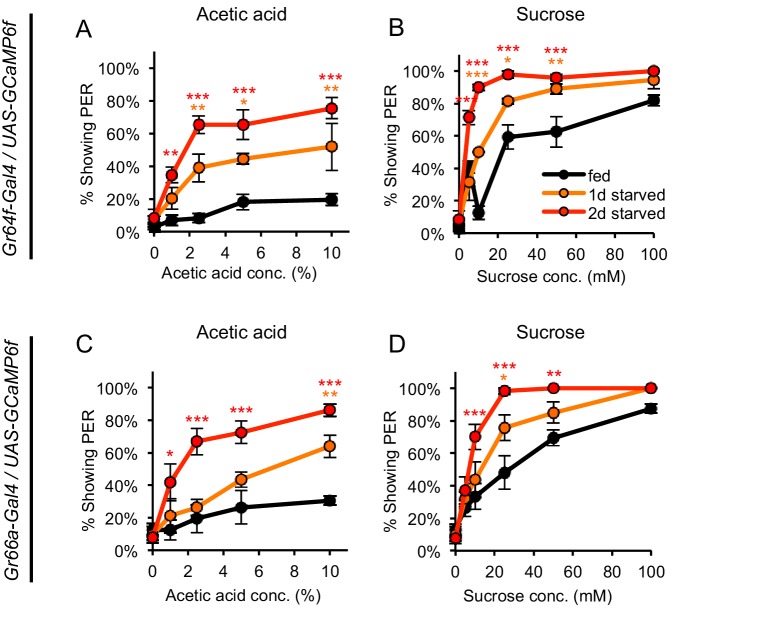
Figure 5u2014figure supplement 7.
GCaMP-expressing flies show hunger-dependent changes in PER to acetic acid and sucrose.
( Au2013D ) Fed and starved flies expressing GCaMP6f in sugar-sensing neurons ( Au2013B ) or bitter-sensing neurons ( Cu2013D ) were tested for PER to acetic acid ( A, C ) and sucrose ( B, D ). Both g...
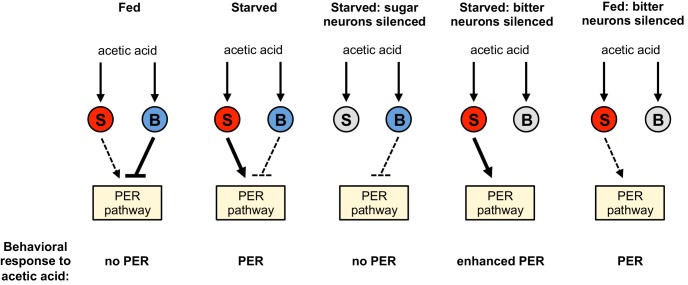
Figure 6.
Model for a hunger-dependent switch in the behavioral response to acetic acid.
Acetic acid activates both sugar- and bitter-sensing neurons (u2018Su2019 and u2018Bu2019 respectively). Sugar-sensing neurons promote PER to acetic acid whereas bitter-sensing neurons suppress PER. T...
Figure images are served from the NIH/NLM PubMed Central Open Access Subset or Europe PMC; copyright remains with the publishers and authors.
💬 Discussion
0 commentsNo comments yet. Be the first to start a discussion!
Leave a Comment