Abstract
Biosynthesis of silver nanoparticles using beneficial Trichoderma harzianum is a simple, eco-friendly and cost-effective route. Secondary metabolites secreted by T. harzianum act as capping and reducing agents that can offer constancy and can contribute to biological activity. The present study aimed to synthesize silver nanoparticles using T. harzianum cell filtrate and investigate different bioactive metabolites based on LC-MS/MS analysis. The synthesized silver nanoparticles (AgNPs) from T. harzianum were characterized by ultraviolet-visible spectrophotometry, Fourier transform infrared spectrometry (FT-IR), energy-dispersive spectroscopy (EDS), dynamic light scattering (DLS), X-ray powder diffraction (XRD) and scanning electron microscopy (SEM). The surface plasmon resonance of synthesized particles formed a peak centered near 438 nm. The DLS study determined the average size of AgNPs to be 21.49 nm. The average size of AgNPs was measured to be 72 nm by SEM. The cubic crystal structure from XRD analysis confirmed the synthesized particles as silver nanoparticles. The AgNPs exhibited remarkable antioxidant properties, as determined by DPPH and ferric reducing antioxidant power (FRAP) assay. The AgNPs also exhibited broad-spectrum antibacterial activity against two Gram-positive bacteria (S. aureus and B. subtilis) and two Gram-negative bacteria (E. coli and R. solanacearum). The minimum inhibitory concentration (MIC) of AgNPs towards bacterial growth was evaluated. The antibacterial activity of AgNPs was further confirmed by fluorescence microscopy and SEM analysis.
🔬 Techniques
🧬 Organisms
✨ Fluorophores
🔬 Cell Lines
🏭 Microscope Brands
🧪 Reagent Suppliers
🏛️ Research Organizations (ROR)
Affiliated research institutions:
📋 Methods
2.1.
Isolation of Trichoderma harzianum and Biomass Preparation
Trichoderma harzianum was isolated from rhizosphere soil on potato dextrose agar (PDA) medium at 28 °C. The isolated fungus was identified morphologically by lactophenol cotton blue mounting, and molecular identification was based on the internal transcribed spacer (ITS) sequencing. Based on the sequence, the fungus was identified as T. harzianum , and the sequence was deposited in National Center for Biotechnology Information (NCBI) under GenBank accession number MK611661 .Mycelial disks (5 mm) of T. harzianum culture were inoculated into 100 mL of potato dextrose broth (PDB) medium in 250 mL Erlenmeyer flasks and incubated at 25 ± 2 °C for 5 days on a rotary shaker at 150 rpm. After 5 days of incubation, the fungal mycelium mass was separated by filtration using Whatman No. 1 filter paper. Following harvest, the biomass was washed with distilled water to remove any media components. Later, 25 g of the fungal mycelium (wet weight) was suspended in 100 mL of Milli-Q water and incubated at 25 ± 2 °C on a rotary shaker at 150 rpm for 72 h. The fungal mycelium was filtered and the cell-free filtrate was collected for subsequent experiments. The culture filtrate of T. harzianum was extracted with ethyl acetate (EtOAc) 3 times with a final 1:1 ratio. The combined organic fraction was dried and evaporated under reduced pressure at 35 °C and used for analysis of bioactive metabolites by LC-MS/MS. 2.2.
Analysis of Bioactive Metabolites Present in T. harzianum
Filtrate by LC-MS/MS The chemical constituents from culture filtrate were determined using LC-MS/MS. First, 50 mg of T. harzianum culture filtrate extract was suspended in 2 mL of methanol and filtered through 0.22 µm nylon membrane prior to injection. HPLC was coupled with a Q-TOF mass spectrometer fitted with an ESI source. HPLC column Phenomene x 5 μ C8, (150 × 2 mm i.d.) was used for the analysis. The solvents were delivered at a total flow rate of 0.1 mL/min and run by isocratic elution. The MS spectra were acquired in the positive ion mode. The temperature of the drying gas (N2) was 350 °C, the gas flow rate was6 mL/min and the nebulizing pressure (N 2 ) was25 psi. A 20 μL volume of fungal extract was injected onto the analytical column for analysis. The mass fragmentations were identified by using a spectrum database for organic compounds. The analytical LC/MS experiment was performed using a TSQ Quantum Access MAX Triple-Stage Quadrupole Mass Spectrometer. Waters Mass Lynx and Target Lynx software were used for data acquisition and data processing, respectively. The MS analysis was performed using ESI in the positive mode. The MS parameters were curtain gas 10, gas1 20 and gas 20, needle voltage 5000 V and declustering potential 100 V. TOF was operated between 50 and 1500 m / z with low mass resolution of 4.7 and high mass resolution of 15. 2.3. Biosynthesis of Silver Nanoparticles (AgNPs) For the synthesis of AgNPs, the culture filtrate was mixed with 1 mM silver nitrate solution (AgNO 3 ) in the ratio of 1:9 ( v / v ), and the reaction mixture was incubated at 25 °C and 100 rpm overnight (to avoid photoactivation of AgNO 3 ). The change in color of the solution from yellowish-brown to dark brown indicated the reduction of silver nitrate to silver ions. The dark brown solution was subjected to centrifugation at 15,000 rpm for 25 min, the supernatant was discarded and the pellet was washed 5–6 times with sterile distilled water. The AgNPs obtained were dried at 60 °C for 24 h and then used for characterization studies. The filtrate without AgNO 3 was used as negative control. 2.4. Characterization of Synthesized Silver Nanoparticles (AgNPs) The maximum absorbance of AgNPs obtained was determined by spectral scan in the range between 200 and 800 nm using a UV–Vis spectrophotometer (Hitachi, U-2800). The reduction of pure silver ions synthesized by fungal filtrate was observed by measuring the UV–Vis spectrum of the reaction mixture. The analysis of AgNPs with Fourier transform infrared spectrometry (FT-IR) was performed by scanning in the spectral range 400–4000 cm −1 at a resolution of 4 cm −1 (Perkin Elmer Spectrum 1000). FT-IR spectra in solid phase were recorded as potassium bromide pellets to detect the possible functional groups in the fungal filtrate responsible for the reduction of ions and the capping agents responsible for the stability of nanoparticles. The energy-dispersive spectroscopy (EDS) assay was conducted using 0.2 g of AgNO 3 crystals to detect the presence of silver ions in the samples (Hitachi Noran System 7, USA). The DLS analysis was conducted to check the size and dispersal pattern of biosynthesized AgNPs existing in solution (Microtrac /FLEX 11.0.0.2).
Show full methods section
2.1.
Isolation of Trichoderma harzianum and Biomass Preparation
Trichoderma harzianum was isolated from rhizosphere soil on potato dextrose agar (PDA) medium at 28 °C. The isolated fungus was identified morphologically by lactophenol cotton blue mounting, and molecular identification was based on the internal transcribed spacer (ITS) sequencing. Based on the sequence, the fungus was identified as T. harzianum , and the sequence was deposited in National Center for Biotechnology Information (NCBI) under GenBank accession number MK611661 .Mycelial disks (5 mm) of T. harzianum culture were inoculated into 100 mL of potato dextrose broth (PDB) medium in 250 mL Erlenmeyer flasks and incubated at 25 ± 2 °C for 5 days on a rotary shaker at 150 rpm. After 5 days of incubation, the fungal mycelium mass was separated by filtration using Whatman No. 1 filter paper. Following harvest, the biomass was washed with distilled water to remove any media components. Later, 25 g of the fungal mycelium (wet weight) was suspended in 100 mL of Milli-Q water and incubated at 25 ± 2 °C on a rotary shaker at 150 rpm for 72 h. The fungal mycelium was filtered and the cell-free filtrate was collected for subsequent experiments. The culture filtrate of T. harzianum was extracted with ethyl acetate (EtOAc) 3 times with a final 1:1 ratio. The combined organic fraction was dried and evaporated under reduced pressure at 35 °C and used for analysis of bioactive metabolites by LC-MS/MS. 2.2.
Analysis of Bioactive Metabolites Present in T. harzianum
Filtrate by LC-MS/MS The chemical constituents from culture filtrate were determined using LC-MS/MS. First, 50 mg of T. harzianum culture filtrate extract was suspended in 2 mL of methanol and filtered through 0.22 µm nylon membrane prior to injection. HPLC was coupled with a Q-TOF mass spectrometer fitted with an ESI source. HPLC column Phenomene x 5 μ C8, (150 × 2 mm i.d.) was used for the analysis. The solvents were delivered at a total flow rate of 0.1 mL/min and run by isocratic elution. The MS spectra were acquired in the positive ion mode. The temperature of the drying gas (N2) was 350 °C, the gas flow rate was6 mL/min and the nebulizing pressure (N 2 ) was25 psi. A 20 μL volume of fungal extract was injected onto the analytical column for analysis. The mass fragmentations were identified by using a spectrum database for organic compounds. The analytical LC/MS experiment was performed using a TSQ Quantum Access MAX Triple-Stage Quadrupole Mass Spectrometer. Waters Mass Lynx and Target Lynx software were used for data acquisition and data processing, respectively. The MS analysis was performed using ESI in the positive mode. The MS parameters were curtain gas 10, gas1 20 and gas 20, needle voltage 5000 V and declustering potential 100 V. TOF was operated between 50 and 1500 m / z with low mass resolution of 4.7 and high mass resolution of 15. 2.3. Biosynthesis of Silver Nanoparticles (AgNPs) For the synthesis of AgNPs, the culture filtrate was mixed with 1 mM silver nitrate solution (AgNO 3 ) in the ratio of 1:9 ( v / v ), and the reaction mixture was incubated at 25 °C and 100 rpm overnight (to avoid photoactivation of AgNO 3 ). The change in color of the solution from yellowish-brown to dark brown indicated the reduction of silver nitrate to silver ions. The dark brown solution was subjected to centrifugation at 15,000 rpm for 25 min, the supernatant was discarded and the pellet was washed 5–6 times with sterile distilled water. The AgNPs obtained were dried at 60 °C for 24 h and then used for characterization studies. The filtrate without AgNO 3 was used as negative control. 2.4. Characterization of Synthesized Silver Nanoparticles (AgNPs) The maximum absorbance of AgNPs obtained was determined by spectral scan in the range between 200 and 800 nm using a UV–Vis spectrophotometer (Hitachi, U-2800). The reduction of pure silver ions synthesized by fungal filtrate was observed by measuring the UV–Vis spectrum of the reaction mixture. The analysis of AgNPs with Fourier transform infrared spectrometry (FT-IR) was performed by scanning in the spectral range 400–4000 cm −1 at a resolution of 4 cm −1 (Perkin Elmer Spectrum 1000). FT-IR spectra in solid phase were recorded as potassium bromide pellets to detect the possible functional groups in the fungal filtrate responsible for the reduction of ions and the capping agents responsible for the stability of nanoparticles. The energy-dispersive spectroscopy (EDS) assay was conducted using 0.2 g of AgNO 3 crystals to detect the presence of silver ions in the samples (Hitachi Noran System 7, USA). The DLS analysis was conducted to check the size and dispersal pattern of biosynthesized AgNPs existing in solution (Microtrac /FLEX 11.0.0.2).
Scanning electron microscopy
(SEM) analysis was carried out using a tiny film of AgNPs placed on carbon-coated copper grid film and dried using a mercury lamp for 5 min. The morphological structure obtained from the biosynthesized AgNPs was determined (Hitachi, S-3400N, Tokyo, Japan). The X-ray powder diffraction (XRD) patterns of synthesized AgNPs were detected using a X-ray powder diffractometer (Rigaku Desktop Miniflex II) with Cu Kα radiation (λ = 1.5406 A°) as the energy source. The diffracted intensities were recorded at 2 θ angles from 10–80°. The location of the highest peak was compared with standard libraries to detect crystal-like phases. The size and nature of biosynthesized nanoparticles were obtained by XRD. The size of the NPs was determined by the Debye–Sherrer equation given as follows: D = Kλ/ β cos θ (1) where λ is the X-ray wavelength, D is the particle size (nm), β is the full line width at half maximum (FWHM) elevation of the important peak, K is the shape factor and θ is the refractive (Bragg) angle. 2.5. Determination of Antioxidant Activities 2.5.1. 2,2-Diphenyl-1-picryl-hydrazyl-hydrate (DPPH) Scavenging Activity Assay The biosynthesized AgNPs and the culture filtrate were used to assess the antioxidant property by DPPH radical scavenging assay [ 25 ]. First, 1.5 mL of freshly prepared DPPH (4 mg of DPPH in 100 mL of 95% ethyl alcohol) was added to 1.5 mL of culture filtrate and AgNPs samples (0.20–1.0 mg/mL). After incubation at room temperature in the dark for 30 min, reduction of DPPH was determined spectrophotometrically at 517 nm against the blank (1.5 mL of DPPH solution and 1 mL of 95% ethanol); gallic acid was used as standard (0.2–1.0 mg/mL in 95% ethyl alcohol). The blank consisted of 1.5 mL of DPPH solution containing the filtrate. The experiments were repeated thrice. The percent activity and IC 50 (concentration of sample needed to inhibit 50% DPPH) were determined. Percent activity (%) = [(Ac − As) /Ac] × 100 (2) where Ac is the absorbance of control or blank and As is the absorbance of the AgNP mixture or standard. 2.5.2. Ferric Reducing Antioxidant Power (FRAP) Assay The antioxidant potential of AgNPs and the culture filtrate was analyzed by ferric reducing antioxidant power (FRAP) assay [ 26 ]. The FRAP reagent (4.5 mL) was prepared by mixing 2.5 mL of TPTZ (2,4,6-tripyridyl-striazine) solution (10 mM TPTZ in 40 mM HCl) and 20 mM FeCl 3 in 25 mL of acetate buffer (0.3 M, pH 3.6) with 0.5 mL of test samples at different concentrations (0.2–1.0 mg/mL). Deionized water and ethanol were used as blank. The reaction mixture was incubated at 37 °C for 30 min, and the absorbance was recorded at 593 nm. A dark blue color formed as Fe 3+ –TPTZ complex was reduced to Fe 2+ –TPTZ. Freshly prepared aqueous ascorbic acid solution (0.2–1.0 mg/mL) was used as standard. 2.6.
Determination of Antibacterial
Activity by Disc Diffusion Method 2.6.1.
Microbial Cultures
Used for Antibacterial Activity Escherichia coli (NCIM–2256), Staphylococcus aureus (NCIM–2079) and Bacillus subtilis (NCIM–2724) obtained from the National Collection of Industrial Microorganisms (NCIM), Pune, India, were used in this study. Ralstonia solanacearum (RS5- KF924743 ) bacterium was isolated from rhizospheric soil. 2.6.2. Antibacterial Activity of Synthesized AgNPs The antibacterial efficacy of the synthesized AgNPs was evaluated by disc diffusion method using two Gram-positive bacteria, namely S. aureus and B. subtilis , and two Gram-negative bacteria, namely E. coli and R. solanacearum . Briefly, the bacterial cultures were inoculated into 5 mL of sterile nutrient broth and incubated at 37 °C until the turbidity matched the 0.5 McFarland standard. The bacterial broth was swabbed onto sterile Mueller Hinton agar (MHA) plates to obtain lawn culture. The sterile discs (6 mm) soaked overnight in 25 μL of AgNPs (0.25 mg/mL) were placed at equidistance on MHA plates and allowed to diffuse at 4 °C for 4–5 h. Streptomycin (25 μg/disc) was used as the positive control and the culture filtrate served as a negative control. The plates were then incubated at 37 °C overnight and the zone of inhibition was measured. The experiments were repeated thrice and mean values were recorded. 2.7. Minimum Inhibitory Concentration (MIC) The MIC of AgNPs was determined by the dilution plate method. Various dilutions of AgNPs were prepared, ranging from 4096 to 8 μg/mL. One hundred microliters of nutrient broth was added to the micro wells of an ELISA plate, and an equal volume of AgNPs ranging from 4096 to 8 μg/mL was added to each well. Ten microliters of bacteria (1 × 10 5 CFU/mL) was added to each well before incubation at 37 °C for 24 h, and absorbance was measured at 620 nm using an ELISA plate reader. Streptomycin was used as the positive control. The MIC was also observed by the addition of 10 μL (2 mg/mL) of 2,3,5-triphenyl tetrazolium chloride (TZC), incubated at room temperature for 30 min. The lowest concentration of AgNPs that significantly inhibited the growth of bacteria in comparison with the positive control was recorded as the MIC [ 27 ]. The experiments were repeated thrice and mean values were recorded. 2.8. Fluorescence Microscopy and Scanning Electron Microscopy (SEM) Analysis The growth of S. aureus (Gram-positive bacteria) and R. solanacearum (Gram-negative bacteria) was inhibited by AgNPs at a concentration of 0.25 mg/mL, as determined by the disc diffusion assay. Hence, 0.25 mg/mL of AgNPs was used for the detection of both dead and live cells by fluorescent microscopy. S. aureus and R. solanacearum were treated with AgNPs (0.25 mg/mL) and incubated for 24 h; then, dyes acridine orange (1 μL) and ethidium bromide (1 μL) were added before further incubation in dark condition for 10–15 min. Acridine orange invades bacterial cells and stains the nuclei green, whereas ethidium bromide invades the cell-membrane-disrupted bacteria and stains the nuclei orange [ 28 ]. Ten microliters of bacteria culture treated with fluorescent stains was placed on a slide to observe the stained nuclei under fluorescence microscope at 40× magnification. The morphological features of treated bacterial cells were further assessed by SEM.
2.6.
Determination of Antibacterial
Activity by Disc Diffusion Method 2.6.1.
Microbial Cultures
Used for Antibacterial Activity Escherichia coli (NCIM–2256), Staphylococcus aureus (NCIM–2079) and Bacillus subtilis (NCIM–2724) obtained from the National Collection of Industrial Microorganisms (NCIM), Pune, India, were used in this study. Ralstonia solanacearum (RS5- KF924743 ) bacterium was isolated from rhizospheric soil. 2.6.2. Antibacterial Activity of Synthesized AgNPs The antibacterial efficacy of the synthesized AgNPs was evaluated by disc diffusion method using two Gram-positive bacteria, namely S. aureus and B. subtilis , and two Gram-negative bacteria, namely E. coli and R. solanacearum . Briefly, the bacterial cultures were inoculated into 5 mL of sterile nutrient broth and incubated at 37 °C until the turbidity matched the 0.5 McFarland standard. The bacterial broth was swabbed onto sterile Mueller Hinton agar (MHA) plates to obtain lawn culture. The sterile discs (6 mm) soaked overnight in 25 μL of AgNPs (0.25 mg/mL) were placed at equidistance on MHA plates and allowed to diffuse at 4 °C for 4–5 h. Streptomycin (25 μg/disc) was used as the positive control and the culture filtrate served as a negative control. The plates were then incubated at 37 °C overnight and the zone of inhibition was measured. The experiments were repeated thrice and mean values were recorded.
3.1.
Analysis of Bioactive Metabolites from Fungal
Filtrate by LC-MS/MS Method The HPLC chromatogram showed several minor peaks at various retention times ranging from 0.20 to 2.20 min. The prominent peak with an area of 246,184.42 was obtained at the retention time of 1.33 min ( Figure 1 A). The LC-MS/MS spectra of the filtrate showed the presence of five different compounds with varied mass obtained at different retention times ( Figure 1 B–D). The compounds were tentatively identified based on the mass obtained from LC-MS/MS by comparison with the previously reported compounds documented in databases. The compounds were identified as 1-benzoyl-3-[( S )-((2 S ,4 R ,8 R )-8-ethylquinuclidin-2-yl](6-methoxyquinolin-4-yl)methyl)thiourea ( m / z 489.2323), puerarin ( m / z 416.2064), genistein ( m / z 432.2986), isotalatizidine ( m / z 407.2975) and ginsenoside ( m / z 800.5387) ( Table 1 ). These compounds were previously reported to exhibit antimicrobial, antibacterial, antioxidant and anticancer properties.
📊 Figures
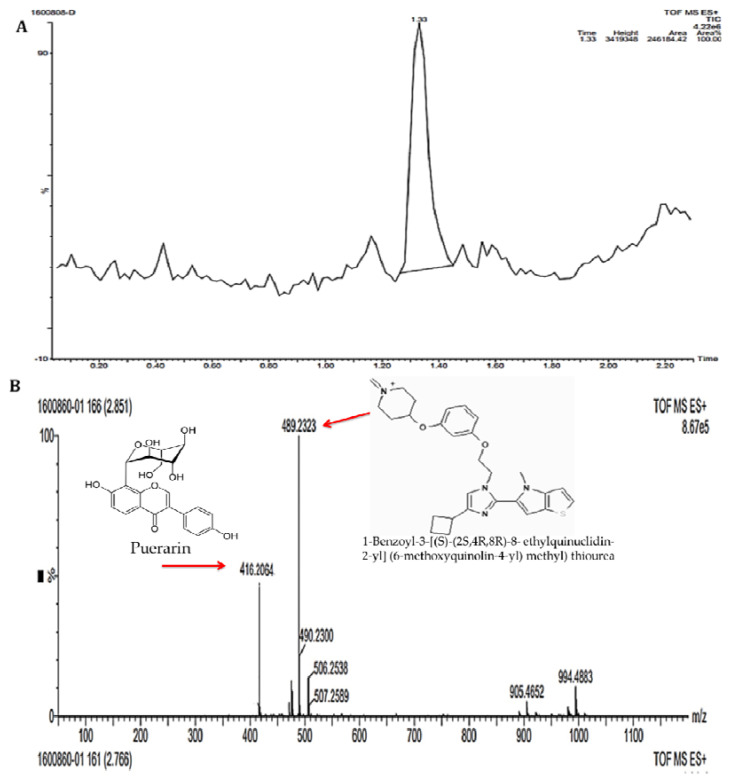
Figure 1
( A ) HPLC chromatograms of the Trichoderma harzianum filtrate. ( B ) LC-MS/MS spectra of antibacterial compounds from Trichoderma harzianum filtrate: 1-benzoyl-3-[( S )-((2 S ,4 R ,8 R )-8-ethylquinu...
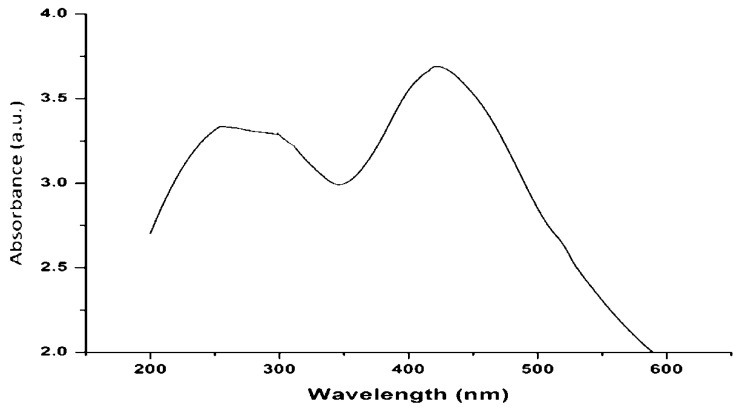
Figure 2
UVu2013visible spectra of silver nanoparticles synthesized using Trichoderma harzianum filtrate.
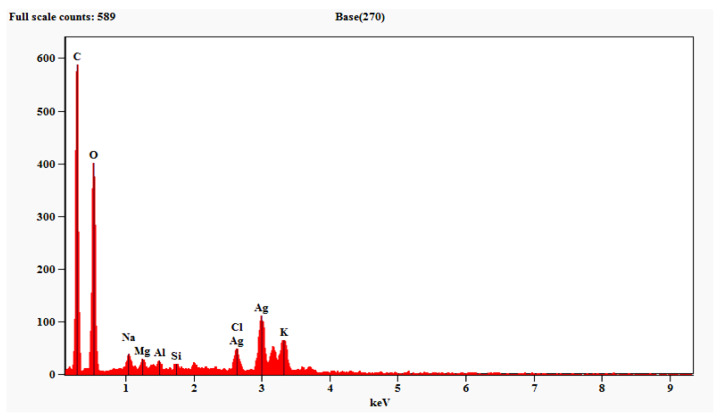
Figure 3
EDS spectra of silver nanoparticles synthesized using Trichoderma harzianum filtrate.
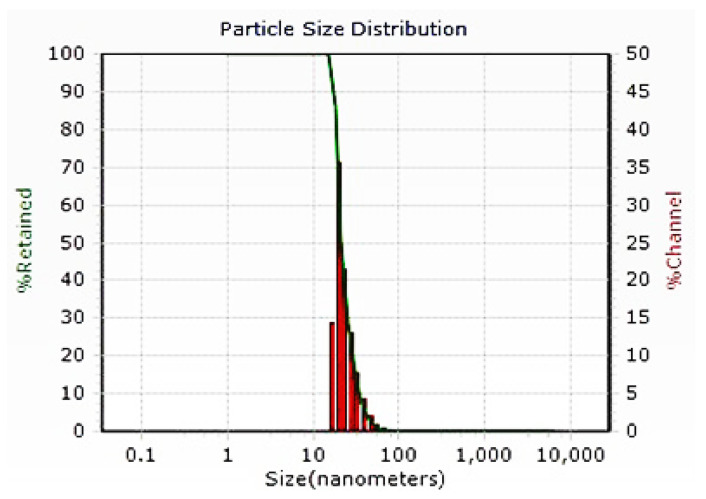
Figure 4
DLS analysis of silver nanoparticles synthesized using Trichoderma harzianum filtrate.
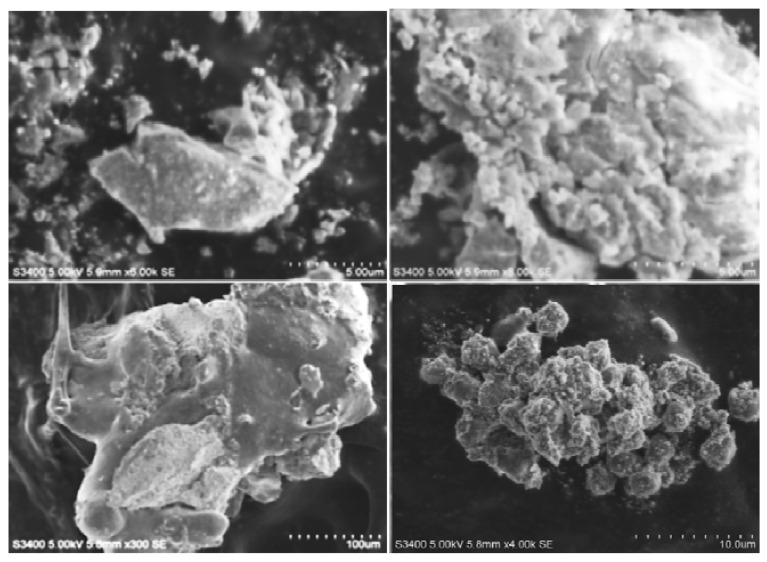
Figure 5
Scanning electron microscopy analysis of silver nanoparticles synthesized using Trichoderma harzianum filtrate.
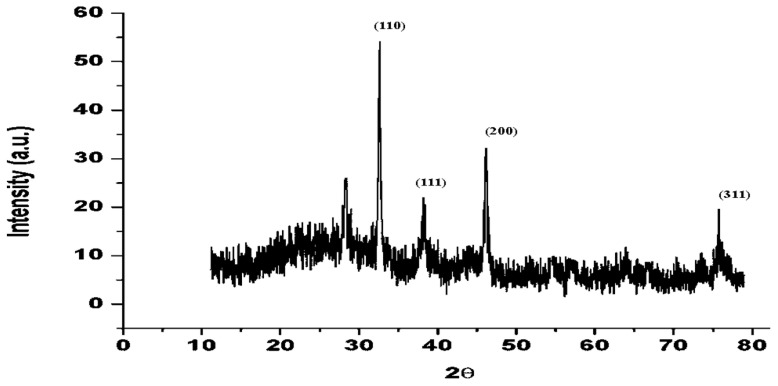
Figure 6
XRD analysis of silver nanoparticles synthesized using Trichoderma harzianum filtrate.
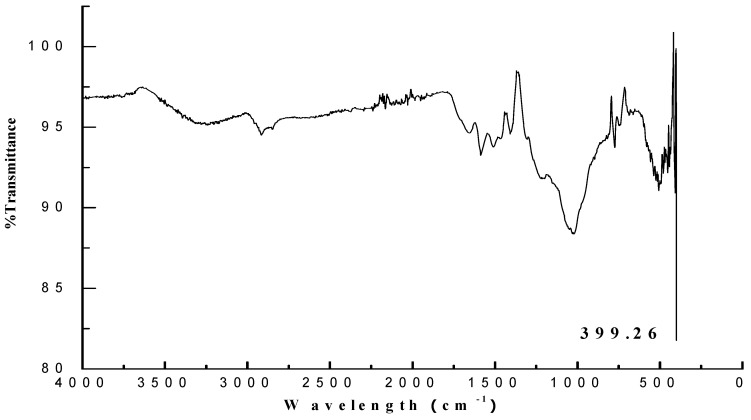
Figure 7
FT-IR spectra of silver nanoparticles synthesized from Trichoderma harzianum filtrate.
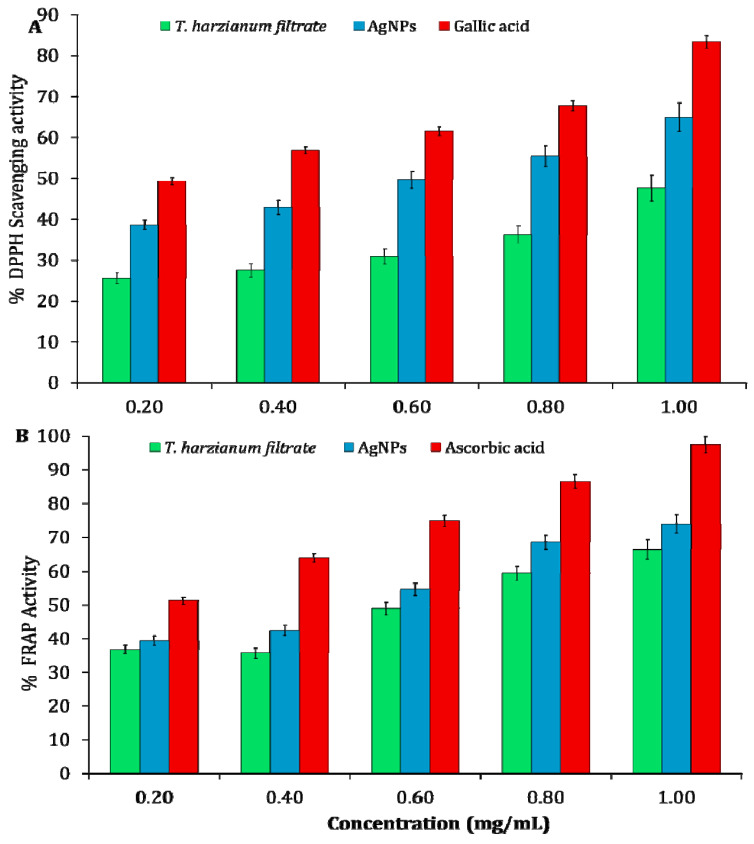
Figure 8
( A ) Estimation of DPPH radical scavenging activity and ( B ) ferric reducing antioxidant power activity from different concentrations of silver nanoparticles synthesized using Trichoderma harzianum ...
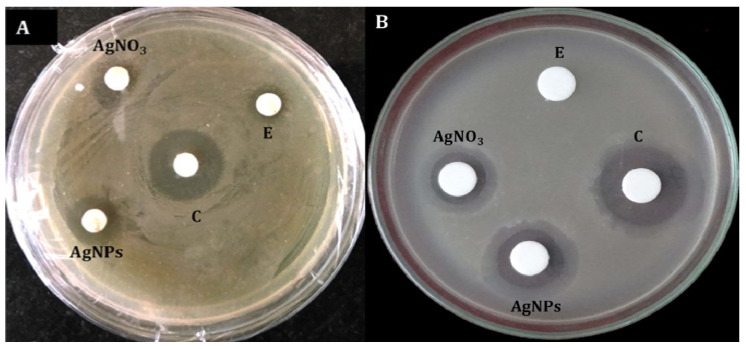
Figure 9
Antibacterial activity of silver nanoparticles synthesized using Trichoderma harzianum filtrate, as determined by disc diffusion method. ( A ) Staphylococcus aureus (Gram-positive); ( B ) Ralstonia so...
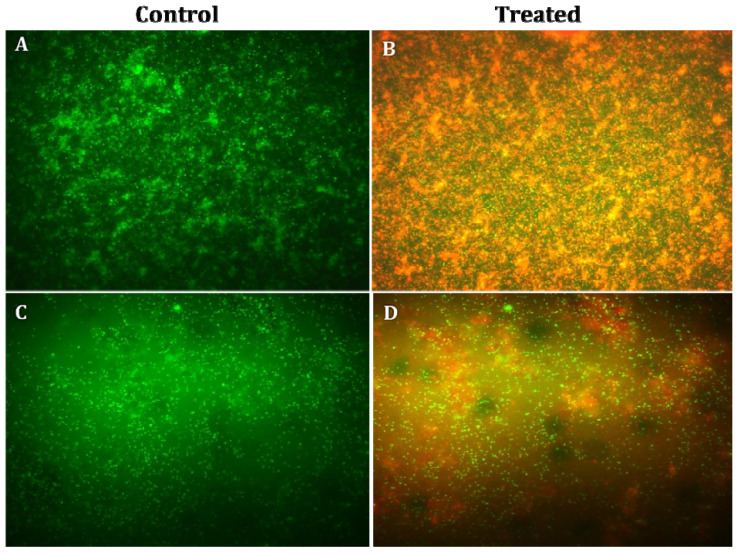
Figure 10
Fluorescence microscopy images of control and AgNP-treated Staphylococcus aureus and Ralstonia solanacearum : ( A ) control S. aureus ; ( B ) S. aureus treated with silver nanoparticles; ( C ) control...
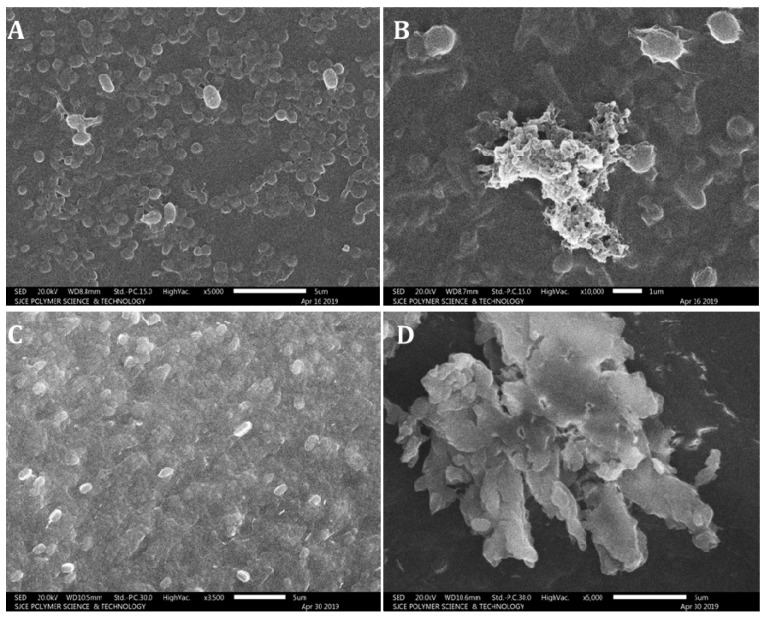
Figure 11
Scanning electron microscopy images of control and AgNP-treated Staphylococcus aureus and Ralstonia solanacearum : ( A ) control S. aureus ; ( B ) S. aureus treated with silver nanoparticles; ( C ) co...
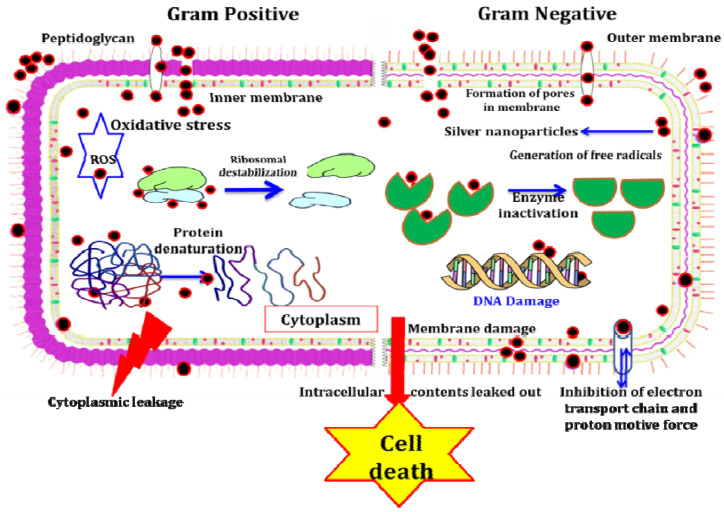
Figure 12
Proposed various modes of action of silver nanoparticles against bacterial growth/proliferation.
Figure images are served from the NIH/NLM PubMed Central Open Access Subset or Europe PMC; copyright remains with the publishers and authors.
💬 Discussion
0 commentsNo comments yet. Be the first to start a discussion!
Leave a Comment