Abstract
Abstract In this work, we present a proof‐of‐principle experiment that extends advanced live cell microscopy to the scale of pool‐generated strain libraries. We achieve this by identifying the genotypes for individual cells in situ after a detailed characterization of the phenotype. The principle is demonstrated by single‐molecule fluorescence time‐lapse imaging of Escherichia coli strains harboring barcoded plasmids that express a sgRNA which suppresses different genes in the E. coli genome through dCas9 interference. In general, the method solves the problem of characterizing complex dynamic phenotypes for diverse genetic libraries of cell strains. For example, it allows screens of how changes in regulatory or coding sequences impact the temporal expression, location, or function of a gene product, or how the altered expression of a set of genes impacts the intracellular dynamics of a labeled reporter.
🔬 Techniques
🧬 Organisms
✨ Fluorophores
🧪 Sample Preparation
🔬 Cell Lines
🏭 Microscope Brands
🧪 Reagent Suppliers
📷 Detectors
💻 Software Details
💾 Data Repositories
🏛️ Research Organizations (ROR)
Affiliated research institutions:
📋 Methods
Design and construction of the DuMPLING screening strain The dCas9 expression cassette from Qi et al ( 2013 ), which includes the TetR repressor and the bidirectional PRPA promoter that regulates both tetR and dcas9 , was introduced into the chromosome of E. coli and optimized for low leakage of dCas9 under non‐induced conditions. Briefly, the dCas9 expression cassette (plasmid pdcas9 Addgene 44249) and a spectinomycin resistance (SpecR) cassette were separately amplified using Phusion polymerase (Thermo Scientific, all PCRs were performed with Phusion unless otherwise specified) (primers: revL3S2P11‐tetR‐f1, olp‐rrnBTwP(SpR)‐r1; olp‐rrnBTwP(SpR)‐f1, L3S2P55‐SpR‐r1) and fused together via overlap PCR. Fragments from intC were separately amplified and fused together via overlap PCR to enable chromosomal recombination (primers revIntC‐f1, olp‐smaI‐revIntC‐r1; olp‐smaI‐revIntC‐f2, revIntC‐r2). The fusion was digested with SmaI, and the dCas9‐SpecR cassette was inserted [cloning steps were performed in the pGEM‐T easy (Promega) vector and confirmed with Sanger sequencing (Eurofins Genomics)]. The construct was subcloned into the NotI site of pKO3 (Link et al , 1997 ), inserted into intC of E. coli BW25993 using double recombination as previously described (Link et al , 1997 ), and sequence‐verified. Finally, the complete, integrated construct was transferred by P1 phage generalized transduction to a BW25993 strain carrying a translational fusion of ypet to lacY in the native lacZYA operon, generating strain BW25993 intC::tetR‐dcas9‐aadA lacY::ypet‐cat . The TetR and dCas9 promoters were optimized to minimize non‐induction leakage First, the PRPA bidirectional promoter, driving the expression of both TetR and dCas9, was replaced with two separate promoters driving each gene. The PLtetO‐1 promoter (Lutz & Bujard, 1997 ) and a strong synthetic RBS designed using the RBS calculator (Salis et al , 2009 ; Espah Borujeni et al , 2014 ) were used for regulating the expression of dCas9. For driving the expression of TetR, the combined promoter and RBS sequence element PN25 was used (Lutz & Bujard, 1997 ). However, the dCas9 leakage levels were not sufficiently low, so PN25 was switched out for the stronger proB TetR expression elements (Rogers et al , 2015 ) in a second step. The dCas9 and TetR promoter engineering was made in the BW25993 intC::tetR‐dcas9‐aadA lacY::ypet‐cat strain with λ‐RED recombination using the pKD46 plasmid (Datsenko & Wanner, 2000 ). The PRPA promoter region was exchanged with a kanamycin resistance (kanR)‐sacB cassette produced using Phusion polymerase and primers URStetR‐kanRsacR‐f1 and DRSdcas9‐kanRsacR‐r1. For producing the PN25‐PLtetO‐1 recombination fragment, oligonucleotides PN25‐SpOLP and SpOLP‐PLtet‐strRBS were fused using PrimeSTAR polymerase (Takara) overlap extension, and the product was used in a PrimeSTAR PCR with primers URStetR‐PN25‐f1 and DRSdcas9‐strRBS‐r1. The integrated kanR‐sacB cassette was exchanged with the PN25‐PLtetO‐1 recombination fragment. To engineer stronger TetR expression, the PN25 expression region was first exchanged with a kanR‐sacB cassette amplified using primers URStetR‐kanRsacR‐f1 and DRS‐spacer‐kanRsacR‐r1. The proB recombination fragment was generated by fusing the two oligonucleotides tetR‐Rogers‐spac‐oligo1 and tetR‐Rogers‐spac‐oligo2 using PrimeSTAR. Finally, the integrated kanR‐sacB cassette was exchanged with the proB recombination fragment to produce the final dCas9 construct, and all modified regions were confirmed by sequencing. The completed dCas9 construct was transduced to a fresh lacY::ypet‐cat strain. To complete the DuMPLING screening strain, the T7 RNA polymerase gene regulated by the araBAD promoter was P1 phage transduced from the BL21 AI strain (Invitrogen), producing the final BW25993 intC::tetR‐dcas9‐aadA lacY::ypet‐cat araB::T7 RNAP‐tetA Δ araB strain with the new name EL101. All oligonucleotides used for cloning are available in Table EV1 . Design and construction of the CRISPRi/RNA barcode plasmid library To directly connect each unique sgRNA spacer with a specific barcode, the sgRNA and the barcode were placed in close proximity and expressed from divergent promoters (Fig EV1 ). This makes it possible to fit both the variable part of the sgRNA and the barcode within the current commercial synthesis limit. The sgRNA and the barcode RNA are driven by a constitutive sigma70 promoter and a T7 promoter, respectively. The two expression units are separated by a spacer that positions the UP‐element of the sgRNA promoter in the constant region of the RNA barcode promoter. The final construct, including flanking priming regions to facilitate cloning, came to 167 nt. Each of the three library oligonucleotides (probe1‐lacY‐spacer (P1‐lacY), probe2‐lacI‐spacer (P2‐lacI), and probe3‐control‐spacer (P3‐control)) consists of a unique FISH RNA barcode sequence paired with a unique sgRNA spacer targeting lacY , lacI, and a control spacer with five mismatches toward ypet , respectively. To avoid the formation of chimeras, emulsion PCR, with library oligos sufficiently diluted to ensure that each droplet at most contains one template, was used (Williams et al , 2006 ; Shao et al , 2011 ; Fig EV1 ). The PCR was performed with DreamTaq on templates in a 1:5 ratio with the expected number of emulsion droplets (primers library‐fw and library‐rv). The emulsion PCR product was recovered (Shao et al , 2011 ) and then purified using a commercial kit (Purelink Quick PCR Purification Kit, Invitrogen). The pGuide backbone was PCR‐amplified to introduce GG adapters with Q5 DNA polymerase (primers forward pGuide3‐early and BpiI‐pG7‐d0‐rv). The PCR product was DpnI‐treated and gel‐purified (Purelink Quick Gel Extraction Kit, Invitrogen). The Golden Gate assembly was carried out using BpiI and an approximately 1:1 molecular ratio of amplified pooled library DNA and pGuide backbone product (Engler & Marillonnet, 2013 ). The assembled pGuide plasmid library was purified (PCR Purification Kit, Invitrogen) and electroporated into the DuMPLING screening strain. After recovery, the cell library was either selected in liquid media (LB + 50 μg/ml kanamycin at 37°C for 3 h) to make cryostocks or plated on LB agar + 50 μg/ml kanamycin plates for estimating library construction accuracy and diversity. Library colony PCR was carried out using DreamTaq polymerase and the seq‐pguide‐f1 and r1 primers. Sequence verification of 24 colonies confirmed the absence of library chimeras. Golden Gate assembly (Engler & Marillonnet, 2013 ) was used to combine the variable RNA barcode and sgRNA spacer sequences (flanked by GG priming sequences) with the plasmid backbone. For specific amplification of library subpools, the Golden Gate adaptors are flanked by 20‐nt primer binding sequences (see upper section of Fig EV1 ). The RNA barcode is expressed from the strong T7 promoter and transcriptionally fused to the 5′ end of the stable structural d0 RNA (Delebecque et al , 2011 ). The first two guanines of the consensus T7 transcript were kept fixed to ensure strong expression (Imburgio et al , 2000 ). The expression of the sgRNA is driven by the synthetic constitutive promoter J23101 (iGEM Registry of Standard Biological Parts). The putative transcriptional start site of J23101 was kept fixed with an adenine, which was found to be favored (Vvedenskaya et al , 2015 ). The pGuide plasmid backbone, which provides kanamycin resistance (kanR) and contains a high copy number pUC origin of replication, was designed to contain the minimal sequences required for selecting and replicating the dual RNA expression cassette (Fig EV2 ).
Show full methods section
Design and construction of the DuMPLING screening strain The dCas9 expression cassette from Qi et al ( 2013 ), which includes the TetR repressor and the bidirectional PRPA promoter that regulates both tetR and dcas9 , was introduced into the chromosome of E. coli and optimized for low leakage of dCas9 under non‐induced conditions. Briefly, the dCas9 expression cassette (plasmid pdcas9 Addgene 44249) and a spectinomycin resistance (SpecR) cassette were separately amplified using Phusion polymerase (Thermo Scientific, all PCRs were performed with Phusion unless otherwise specified) (primers: revL3S2P11‐tetR‐f1, olp‐rrnBTwP(SpR)‐r1; olp‐rrnBTwP(SpR)‐f1, L3S2P55‐SpR‐r1) and fused together via overlap PCR. Fragments from intC were separately amplified and fused together via overlap PCR to enable chromosomal recombination (primers revIntC‐f1, olp‐smaI‐revIntC‐r1; olp‐smaI‐revIntC‐f2, revIntC‐r2). The fusion was digested with SmaI, and the dCas9‐SpecR cassette was inserted [cloning steps were performed in the pGEM‐T easy (Promega) vector and confirmed with Sanger sequencing (Eurofins Genomics)]. The construct was subcloned into the NotI site of pKO3 (Link et al , 1997 ), inserted into intC of E. coli BW25993 using double recombination as previously described (Link et al , 1997 ), and sequence‐verified. Finally, the complete, integrated construct was transferred by P1 phage generalized transduction to a BW25993 strain carrying a translational fusion of ypet to lacY in the native lacZYA operon, generating strain BW25993 intC::tetR‐dcas9‐aadA lacY::ypet‐cat . The TetR and dCas9 promoters were optimized to minimize non‐induction leakage First, the PRPA bidirectional promoter, driving the expression of both TetR and dCas9, was replaced with two separate promoters driving each gene. The PLtetO‐1 promoter (Lutz & Bujard, 1997 ) and a strong synthetic RBS designed using the RBS calculator (Salis et al , 2009 ; Espah Borujeni et al , 2014 ) were used for regulating the expression of dCas9. For driving the expression of TetR, the combined promoter and RBS sequence element PN25 was used (Lutz & Bujard, 1997 ). However, the dCas9 leakage levels were not sufficiently low, so PN25 was switched out for the stronger proB TetR expression elements (Rogers et al , 2015 ) in a second step. The dCas9 and TetR promoter engineering was made in the BW25993 intC::tetR‐dcas9‐aadA lacY::ypet‐cat strain with λ‐RED recombination using the pKD46 plasmid (Datsenko & Wanner, 2000 ). The PRPA promoter region was exchanged with a kanamycin resistance (kanR)‐sacB cassette produced using Phusion polymerase and primers URStetR‐kanRsacR‐f1 and DRSdcas9‐kanRsacR‐r1. For producing the PN25‐PLtetO‐1 recombination fragment, oligonucleotides PN25‐SpOLP and SpOLP‐PLtet‐strRBS were fused using PrimeSTAR polymerase (Takara) overlap extension, and the product was used in a PrimeSTAR PCR with primers URStetR‐PN25‐f1 and DRSdcas9‐strRBS‐r1. The integrated kanR‐sacB cassette was exchanged with the PN25‐PLtetO‐1 recombination fragment. To engineer stronger TetR expression, the PN25 expression region was first exchanged with a kanR‐sacB cassette amplified using primers URStetR‐kanRsacR‐f1 and DRS‐spacer‐kanRsacR‐r1. The proB recombination fragment was generated by fusing the two oligonucleotides tetR‐Rogers‐spac‐oligo1 and tetR‐Rogers‐spac‐oligo2 using PrimeSTAR. Finally, the integrated kanR‐sacB cassette was exchanged with the proB recombination fragment to produce the final dCas9 construct, and all modified regions were confirmed by sequencing. The completed dCas9 construct was transduced to a fresh lacY::ypet‐cat strain. To complete the DuMPLING screening strain, the T7 RNA polymerase gene regulated by the araBAD promoter was P1 phage transduced from the BL21 AI strain (Invitrogen), producing the final BW25993 intC::tetR‐dcas9‐aadA lacY::ypet‐cat araB::T7 RNAP‐tetA Δ araB strain with the new name EL101. All oligonucleotides used for cloning are available in Table EV1 . Design and construction of the CRISPRi/RNA barcode plasmid library To directly connect each unique sgRNA spacer with a specific barcode, the sgRNA and the barcode were placed in close proximity and expressed from divergent promoters (Fig EV1 ). This makes it possible to fit both the variable part of the sgRNA and the barcode within the current commercial synthesis limit. The sgRNA and the barcode RNA are driven by a constitutive sigma70 promoter and a T7 promoter, respectively. The two expression units are separated by a spacer that positions the UP‐element of the sgRNA promoter in the constant region of the RNA barcode promoter. The final construct, including flanking priming regions to facilitate cloning, came to 167 nt. Each of the three library oligonucleotides (probe1‐lacY‐spacer (P1‐lacY), probe2‐lacI‐spacer (P2‐lacI), and probe3‐control‐spacer (P3‐control)) consists of a unique FISH RNA barcode sequence paired with a unique sgRNA spacer targeting lacY , lacI, and a control spacer with five mismatches toward ypet , respectively. To avoid the formation of chimeras, emulsion PCR, with library oligos sufficiently diluted to ensure that each droplet at most contains one template, was used (Williams et al , 2006 ; Shao et al , 2011 ; Fig EV1 ). The PCR was performed with DreamTaq on templates in a 1:5 ratio with the expected number of emulsion droplets (primers library‐fw and library‐rv). The emulsion PCR product was recovered (Shao et al , 2011 ) and then purified using a commercial kit (Purelink Quick PCR Purification Kit, Invitrogen). The pGuide backbone was PCR‐amplified to introduce GG adapters with Q5 DNA polymerase (primers forward pGuide3‐early and BpiI‐pG7‐d0‐rv). The PCR product was DpnI‐treated and gel‐purified (Purelink Quick Gel Extraction Kit, Invitrogen). The Golden Gate assembly was carried out using BpiI and an approximately 1:1 molecular ratio of amplified pooled library DNA and pGuide backbone product (Engler & Marillonnet, 2013 ). The assembled pGuide plasmid library was purified (PCR Purification Kit, Invitrogen) and electroporated into the DuMPLING screening strain. After recovery, the cell library was either selected in liquid media (LB + 50 μg/ml kanamycin at 37°C for 3 h) to make cryostocks or plated on LB agar + 50 μg/ml kanamycin plates for estimating library construction accuracy and diversity. Library colony PCR was carried out using DreamTaq polymerase and the seq‐pguide‐f1 and r1 primers. Sequence verification of 24 colonies confirmed the absence of library chimeras. Golden Gate assembly (Engler & Marillonnet, 2013 ) was used to combine the variable RNA barcode and sgRNA spacer sequences (flanked by GG priming sequences) with the plasmid backbone. For specific amplification of library subpools, the Golden Gate adaptors are flanked by 20‐nt primer binding sequences (see upper section of Fig EV1 ). The RNA barcode is expressed from the strong T7 promoter and transcriptionally fused to the 5′ end of the stable structural d0 RNA (Delebecque et al , 2011 ). The first two guanines of the consensus T7 transcript were kept fixed to ensure strong expression (Imburgio et al , 2000 ). The expression of the sgRNA is driven by the synthetic constitutive promoter J23101 (iGEM Registry of Standard Biological Parts). The putative transcriptional start site of J23101 was kept fixed with an adenine, which was found to be favored (Vvedenskaya et al , 2015 ). The pGuide plasmid backbone, which provides kanamycin resistance (kanR) and contains a high copy number pUC origin of replication, was designed to contain the minimal sequences required for selecting and replicating the dual RNA expression cassette (Fig EV2 ).
Bulk growth rate and CRISPRi repression assay
To investigate the bulk growth and CRISPRi characteristics of the DuMPLING proof‐of‐principle system, the P1‐lacY, P2‐lacI, and P3‐control pGuide plasmids in the BW25993 intC::tetR‐dcas9‐aadA lacY::ypet‐cat araB::T7 RNAP‐tetA Δ araB screening strain were assayed for growth (OD 600 ) and YPet fluorescence using an Infinite M200 plate reader (Tecan).
Cultures
Overnight cultures of the wild‐type BW25993 strain with the empty pGuide plasmid, the DuMPLING screening strain with the empty pGuide plasmid, the P1‐lacY, P2‐lacI, and P3‐control pGuide plasmids were grown in LB + 50 μg/ml kanamycin at 37°C shaking at 200 rpm. Pre‐plate In the morning, overnight cultures were diluted 1:400 into 200 μl supplemented M9 medium [100 μM CaCl 2 , 2 mM MgSO 4 , 1× M9 salts, 0.8% v/v glycerol, 1× RPMI amino acid mix (Sigma)] + 50 μg/ml kanamycin + 0.85 g/l Pluronic F108 in a transparent 96‐well plate with lid (Costar Assay Plate, REF 3370, Corning). LacY‐Ypet and dCas9 were induced by adding isopropyl β‐D‐1‐thiogalactopyranoside (IPTG) (1 mM final concentration) and anhydrotetracycline (aTc) (1 ng/μl final concentration), respectively. To control for the EtOH in the aTc stock, 100 ppm EtOH was added to media without aTc. Plate reader cultures were grown at 37°C, with shaking (1 min, 4.5 mm amplitude) and measurements (OD 600 and fluorescence with 510 ± 9 nm excitation and 540 ± 20 nm emission) every 5 min. Experiment run The pre‐plate cultures were diluted 1:200 once they hit exponential phase and run for 20 h as described above (Costar Assay Plate, REF 3904, Corning).
Analysis
The raw data were analyzed using custom MATLAB scripts. The maximum growth rates were converted to minimum doubling times (Fig EV3 A). After subtracting the medium background absorption and fluorescence, the fluorescence was normalized with OD 600 (Fig EV3 B) and these values were used for calculating CRISPRi repression ratios. Results P1‐lacY sgRNA: LacY‐YPet was repressed 19.8‐fold upon dCas9 induction. The leakage repression was negligible compared with the empty vector control. P2‐lacI sgRNA: LacY‐YPet expression was activated to 24.1‐fold over the cell background level and 0.43‐fold of the maximal IPTG induction levels in the empty vector control, due to suppression of LacI expression. P3‐control strain: The ratio of LacY‐YPet expression with the empty vector culture was close to 1 (1.04 for induction with both IPTG and aTc, 0.90 for just aTc). These data illustrate the low leakage of dCas9 expression in the DuMPLING screening strain, which is important to avoid biasing the screening population before phenotyping. The microfluidic chip The microfluidic chip is a PDMS (Polydimethylsiloxane)–glass hybrid disposable device where the flow is driven by pressure. We describe the microfluidic chip design, production, and operation in Baltekin et al ( 2017 ). The chip is designed to rapidly capture individual bacterial cells from liquid growth cultures and exchange the liquid media around the cells effectively while keeping the captured cells in place throughout the experiment. Here, the chip design enables effective delivery and exchange of different media, probes, and buffers during the genotyping.
Microscope setup
All imaging were carried out using a Nikon Ti‐E setup for both phase contrast and epifluorescence microscopy. The microscope was equipped with 100× CPI Plan Apo Lambda (Nikon). Phase contrast images were acquired using a dmk23u274 (The Imaging Source). Bright‐field and fluorescence images were acquired using a Zyla 4.2 PLUS sCMOS (Andor). For wide‐field epifluorescence‐based phenotyping, a 300 ms excitation [shuttered using an AOTFnC (AA Opto Electronics)] from a 514‐nm CW‐laser at 415 W/cm 2 (Fandango, Cobolt) was used. The laser light was reflected on a zt514.5rdc (Chroma) dichroic before hitting the sample. The Ypet emitted light was transmitted through the above dichroic and filtered through a BrightLine Fluorescence 542/27 (Semrock) before hitting the sCMOS camera. The genotyping and DAPI imaging were carried out using LED white light source (Sola, Lumencore) together with the appropriate filter cubes. Filter cube for Cy3 detection: excitation filter: FF01‐543/22 (Semrock), dichroic mirror: FF562‐Di03 (Semrock), emission filter: FF01‐586/20 (Semrock). Filter cube for Cy5 detection: excitation filter: FF01‐635/18 (Semrock), dichroic mirror: FF652‐Di01 (Semrock), emission filter: FF01‐680/42 (Semrock). Loading cells into the microfluidic chip Overnight cultures of the strains to be loaded were grown in LB + 50 μg/ml kanamycin at 37°C shaking at 200 rpm. In the morning, cells were diluted 1:200 in M9 + 0.2% Glucose + 1× RPMI + 50 μg/ml kanamycin + 0.85 g/l Pluronic F108 and grown for 2 h at 37°C shaking at 200 rpm, at which point cells were flown into the chip and into the cell channels where they are caught by the 300 nm constriction at the end of the cell channels [as described in (Baltekin et al , 2017 )]. The cells were grown in the chip overnight in M9 + 0.2% Glucose + 1× RPMI + 50 μg/ml kanamycin + 0.85 g/l Pluronic + 0.1 ng/μl aTc at 30°C, and then imaged. Imaging phenotypes Cells were imaged for 272 min in the same conditions as overnight growth. Phase contrast images were taken every minute. Bright‐field images and epifluorescence images were taken every 13 min. Microscope and accessory equipment were controlled using micro‐manager (version 1.4.20) (Edelstein et al , 2010 ). Genotyping by sequential FISH After phenotype imaging was complete, the media was switched to LB + 20% arabinose + 50 μg/ml kanamycin + 0.85 g/l Pluronic, and the cells were grown 3 h further at 30°C. After arabinose induction, the cells were fixed in a solution of 1× PBS + 4% formaldehyde for 10 min at room temperature (all steps from this point forward were carried out at room temperature). The cells were then washed with 1× PBS + Ribolock (Thermo Scientific). The cells were then permeabilized with 70% EtOH for 45 min. The 70% EtOH was washed away with 50% EtOH, then 25% EtOH, and finally with 1× PBS + Ribolock. For each round of FISH, the appropriate probe pool was flowed into the chip [30 μl hybridization probes + 7.5 μl Ribolock (Thermo Scientific) + 30 μl E. coli tRNA (0.65 mg/ml) + 233 μl (0.05 g/ml Dextran sulfate sodium salt, 20% formamide and 2× SSC)]. Hybridization was allowed to proceed overnight (~16 h). The excess probes were washed away with PBS + DAPI stain + Ribolock and then imaged in DAPI, Cy3, and Cy5 using the white light source (SOLA). After imaging, the cells were incubated in a solution of 90% formamide + 2× SSC for 1 h to wash away bound probes and then washed again in PBS + DAPI stain + Ribolock to remove the previous reagents. The cells were again imaged as before to ensure that the probes were fully removed. This was the completion of one round of probing, and at this point, the next pool of probes was flowed into the chip.
Fluorescent in situ hybridization probe production
The steps for probe production, adapted from Beliveau et al and Chen et al (Beliveau et al , 2012 ; Chen et al , 2015 ), are seen in Fig EV5 . Sequences can be found in Table EV2 . Templates for FISH probe elongation rounds 1 and 2 (P1 R1 E0, P2 R1 E1, P3 R1 E0 or P1 R2 E1, P2 R2 E0, P3 R2 E0) were pooled separately and PCR‐amplified with DreamTaq polymerase using phosphorylated forward primers and phosphorothioate‐modified reverse primers (R1 FWD and R1 REV or R2 FWD and R2 REV). The PCR product was purified using the PureLink quick PCR purification kit (Invitrogen). The phosphorylated strand was selectively digested by lambda exonuclease (Thermo Scientific) treatment for 30 min at 37°C followed by heat inactivation at 80°C for 10 min. The ssDNA was purified using the MinElute PCR purification kit (Qiagen). The ssDNA template was elongated by hybridization of the corresponding phosphorothioate‐modified Cy3 or Cy5 elongation probes (E0 Cy3 and E1 Cy5) at 55°C for 5 min after an initial heating step at 96°C for 3 min. Elongation was performed with DreamTaq polymerase and dNTP in DreamTaq buffer at 72°C for 15 min. The elongated product was purified using the PureLink quick PCR purification kit (Invitrogen) and cleaved by the SchI FD enzyme for 30 min at 37°C. After this step, lambda exonuclease was added directly to the SchI digestion for an additional 30 min at 37°C. The processed FISH probes were purified using phenol/chloroform/isoamylalcohol (VWR), washed with chloroform (Sigma‐Aldrich), and extracted by means of centrifugation after precipitation with EtOH and sodium acetate. The DNA pellet was washed once in 70% EtOH and dried at room temperature before being resolved in water. To remove any additional undesirable DNA, the probe mixture was purified on a 4% agarose gel. The expected DNA band was excised from the gel, sliced in small pieces, and incubated overnight in water. The extracted probe was phenol/chloroform/isoamylalcohol‐purified, washed, and extracted as previously described followed by filtration in Ultrafree‐MC microcentrifuge filters (Sigma‐Aldrich) before being used in the microfluidic experiment. Figure EV5 Schematic overview of the enzymatic steps of the probe generation protocol Templates were amplified from the template library pool by PCR using primers specific for each FISH genotyping round. Lambda exonuclease selectively digested the 5′‐phosphorylated strand, leaving only the 5′‐phosphorothioate strand. Fluorescently labeled and phosphorothioate‐modified elongation probes were hybridized to the ssDNA template and elongated with DreamTaq polymerase. The dsDNA product was digested with restriction enzyme SchI, removing the phosphorothioate bonds from the unlabeled strand. Lambda exonuclease digestion produced the final FISH probe.
Polyacrylamide gel analysis of produced probes
Samples were collected throughout the probe production protocol, mixed with 10× FD green buffer, and loaded on a 10% polyacrylamide gel (Bio‐Rad). As size references, Cy3 and Cy5 39‐nt ssDNA probes with two phosphodiester bonds, and also the Cy3 and Cy5 19‐nt probes used for elongation, were loaded onto the gel. The gel was run in 1× TBE buffer in a Mini‐PROTEAN system (Bio‐Rad) and analyzed with a Chemidoc system (Bio‐Rad) (Fig EV6 ). Figure EV6 Products from the different steps of the FISH probe production protocol A, B Products were run on a 10% polyacrylamide gel and imaged in (A) Cy3 and (B) Cy5 channels. (M): Cy3‐ and Cy5‐labeled 39‐nt and 19‐nt ssDNA probes were used as size references. (1) and (2): the initial fluorescent elongation product for the two rounds of FISH probe generation, respectively. (3) and (4): SchI digestion of the elongation products for rounds one and two, respectively. (5) and (6): Lambda exonuclease treatment and gel‐purified product for rounds one and two, respectively.
Image analysis Phenotyping
Cell outlines were identified using cell segmentation (Ranefall et al , 2016 ) of phase contrast images. Before segmentation, the image of a trap designed to be without cells was deducted from all traps imaged in phase contrast as described in Baltekin et al ( 2017 ). Using the detected cell outlines, lineages were constructed using the Baxter algorithm (Magnusson et al , 2015 ) where Jaccard indices between consecutive cell outlines were used to score migration and division events. The division event scores were calculated to require binary fission. Cell lineages from Baxter were filtered based on the following criteria: (i) Cell outlines where the size transiently dropped or increased by large amounts were deemed as missegmentation and not used in further analysis. (ii) Lineages from one cell generation with large shifts in size (non‐transient) were excluded from further analysis. (iii) Lineages from one cell generation with large center of mass movements of the cell outlines were excluded from further analysis. Finally (iv), lineages from one cell generation with very short life span were excluded from further analysis unless they contained both a mother and two daughter cells. Fluorescently labeled LacY‐YPet molecules were localized using the dot detection algorithm suggested by Loy and Zelinsky (Loy & Zelinsky, 2003 ). Given that phase contrast and fluorescence images were acquired using different cameras, a transformation was required to place dots inside segmented cell outlines. This transformation was estimated before the start of the experiment using landmarks in images captured on the two different cameras. Genotyping DAPI, Cy3, and Cy5 images were summed vertically (see Fig 3 B). The locations of the cell traps were determined using the vertically summed DAPI signal. The log ratio of vertically summed Cy3 and Cy5 signals was used to call a 1 or 0. The genotype of the trap was then associated with all cells in that trap. Sensitivity and specificity The bright fluorescent phenotype is easy to identify, which makes it possible to use this as a reference when calculating sensitivity and specificity for the genotyping in our experiment. There were 74 traps with bright cells and 159 with the other strains. One of the 1,398 attempts to read a barcode gave the wrong answer, which would lead to a misclassification of a bright trap as a non‐bright trap. However, this could be corrected since only two rounds of probing are needed to call the genotype and we probed six rounds. This implies that each genotype has been determined 6/2 = 3 times. In terms of sensitivity and specificity, the true‐positive identifications of the bright genotype was made (74 × 3) − 1 = 224 times. The true‐negative identifications of the bright genotype was made 159 × 3 = 477 times. There is one false negative and 0 false positive. Based on this, we calculated the 95% Clopper–Pearson confidence intervals for the sensitivity to be 97.55–99.99% and for specificity to be 99.23–100.00% (Clopper & Pearson, 1934 ). If this experiment is used as a proxy for a library that requires six rounds of probing to identify each genotype, then the true‐positive identification of the bright genotype was made 74 − 1 = 73 times. The true‐negative identification of the bright genotype was made 159 times. There is one false negative and 0 false positives. Based on this, we calculated the 95% confidence intervals for the sensitivity to be 92.7–99.97% and for specificity to be 97.71% to 100%. Note on chemicals and reagents All chemicals were acquired from Sigma‐Aldrich unless otherwise stated. All synthetic DNAs are from Integrated DNA Technologies, and unlabeled DNA oligonucleotides above 100 nt were bought as Ultramers. DreamTaq DNA polymerase (Thermo Scientific) was used for colony PCRs, PCRs for sequencing reactions, preparative PCRs of small fragments (< 200 bp), and emulsion PCR. Phusion DNA polymerase (Thermo Scientific) was used for preparative PCRs. For difficult preparative PCRs, PrimeSTAR DNA polymerase (Takara) was used. For preparative PCRs requiring extra high accuracy, Q5 RNA polymerase was used (NEB). Restriction enzymes, ligases, and other cloning‐related enzymes were procured from Thermo Scientific unless otherwise stated.
Data availability
The code used for analyzing the data and generating images is provided as Code EV1 . Raw images can be downloaded from BioStudies https://www.ebi.ac.uk/biostudies/ (accession code: S‐BSST37).
Supporting information Expanded View Figures PDF Click here for additional data file. Table EV1 Click here for additional data file. Table EV2 Click here for additional data file. Movie EV1 Click here for additional data file. Movie EV2 Click here for additional data file. Code EV1 Click here for additional data file. Review Process File Click here for additional data file.
📊 Figures
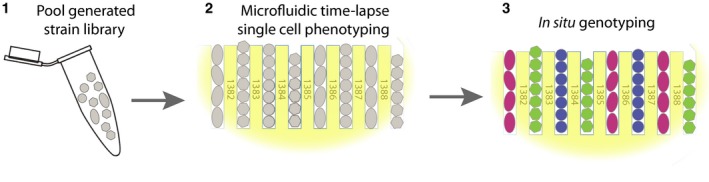
Figure 1
The DuMPLING strategy
(1) Pooled strain library generation. (2) Live single cell phenotyping using microscopy. (3) Genotypes recovered by in situ genotyping.

Figure 2
Three strain lac operon knockdown library: Repression network for the three different plasmids used
lacY knockdown (lowest LacYu2010YPet expression, purple). No knockdown (low LacYu2010YPet expression, green). lacI knockdown (high LacYu2010YPet expression, blue). Data information: Color scheme holds...
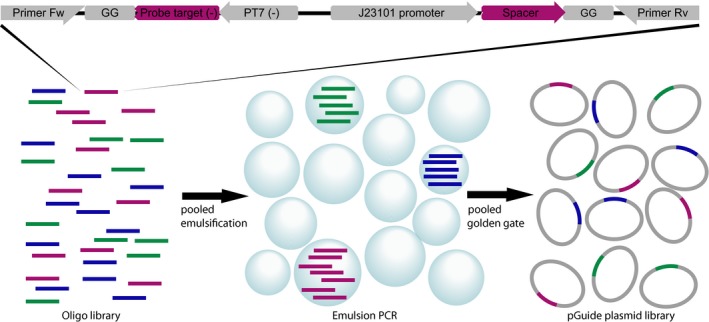
Figure EV1
Du MPLING oligonucleotide plasmid library design and production
Each member of the oligonucleotide library for plasmid construction contains two divergent promoters: a constitutive promoter toward the spacer and PT7 toward the barcode RNA (top). The oligonucleotid...
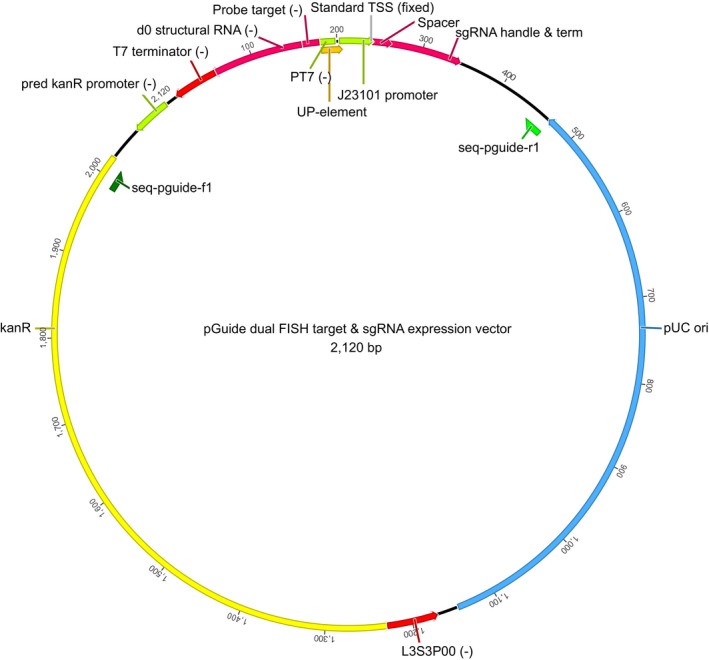
Figure EV2
Sequence elements of the dual RNA barcode FISH target and sg RNA expression pG uide vector
Minus (u2212) signs indicate antiu2010sense direction of genetic element.
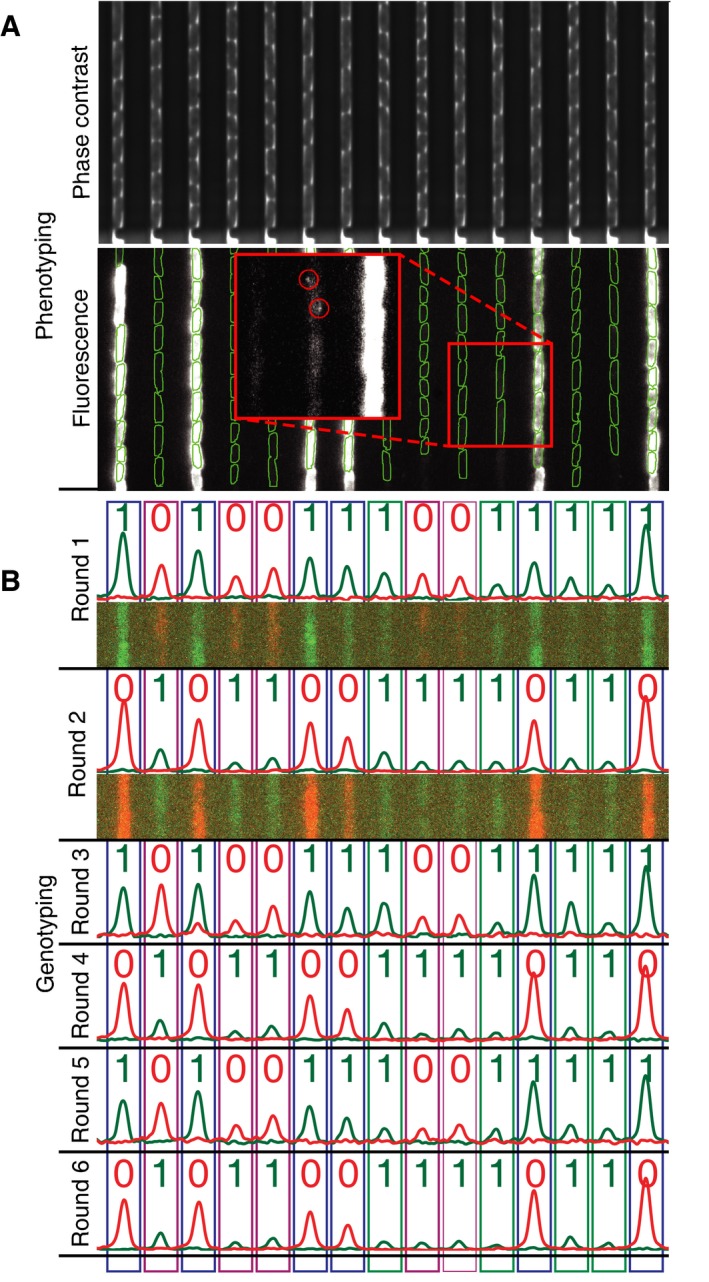
Figure 3
Mapping phenotypes to genotypes
Examples of channels and cells in the customu2010made microfluidic device which are imaged in both phase contrast (top) and fluorescence microscopy (bottom). Phase contrast is used to segment the cell...
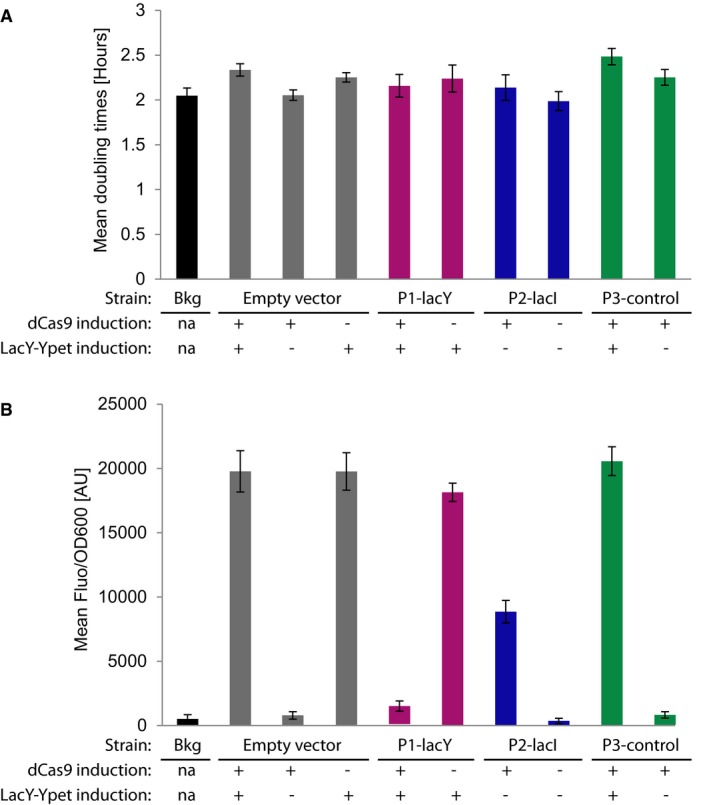
Figure EV3
Bulk growth rate and CRISPR i repression assay results of the Du MPLING screening strain with different pG uide constructs
Mean doubling times of the different strains under the indicated conditions. Steadyu2010state mean fluorescence normalized by cell density (Fluo/OD 600 ) of the different strains under the indicated c...
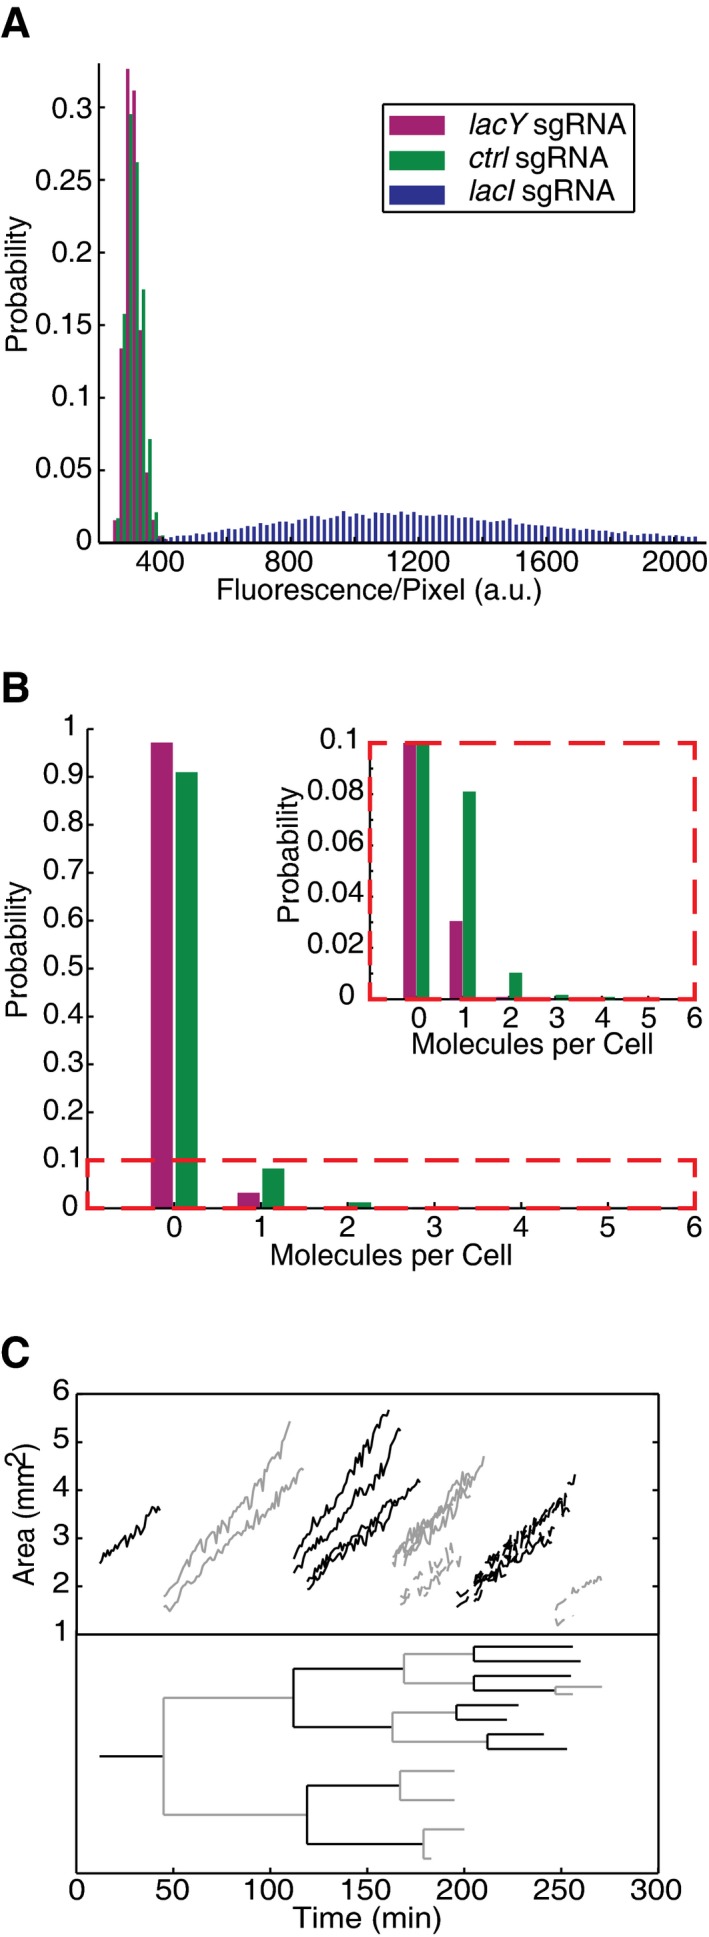
Figure 4
Phenotype data
Gene expression categorized by assigned genotype. Singleu2010molecule counting of expression from the two lowu2010expression genotypes. Top growth curves for one cell lineage (from one channel). Dashe...
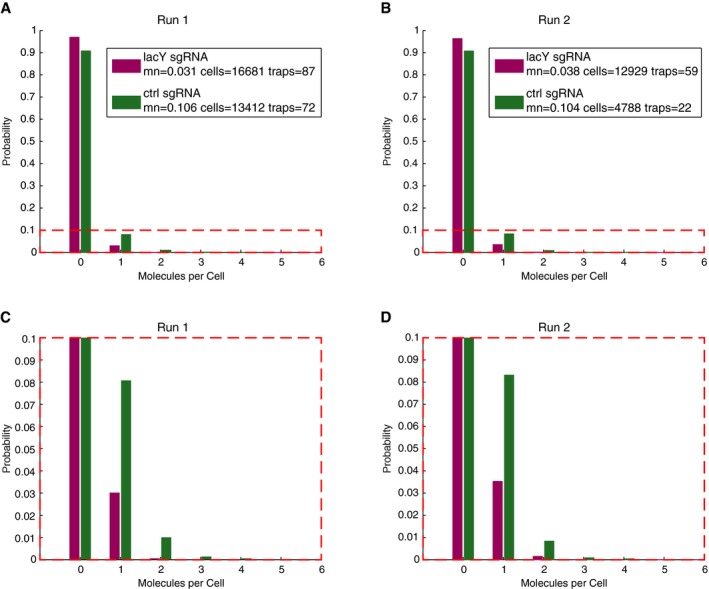
Figure EV4
Reproducibility of dot detection results
Au2013D Normalized histograms of singleu2010molecule counting of expression from the two lowu2010expression genotypes (strain definitions are given in the Materials and Methods section u201cDesign and...
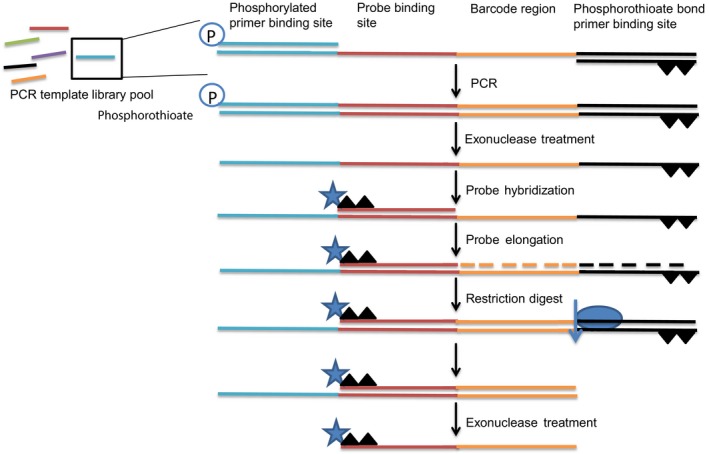
Figure EV5
Schematic overview of the enzymatic steps of the probe generation protocol
Templates were amplified from the template library pool by PCR using primers specific for each FISH genotyping round. Lambda exonuclease selectively digested the 5u2032u2010phosphorylated strand, leav...
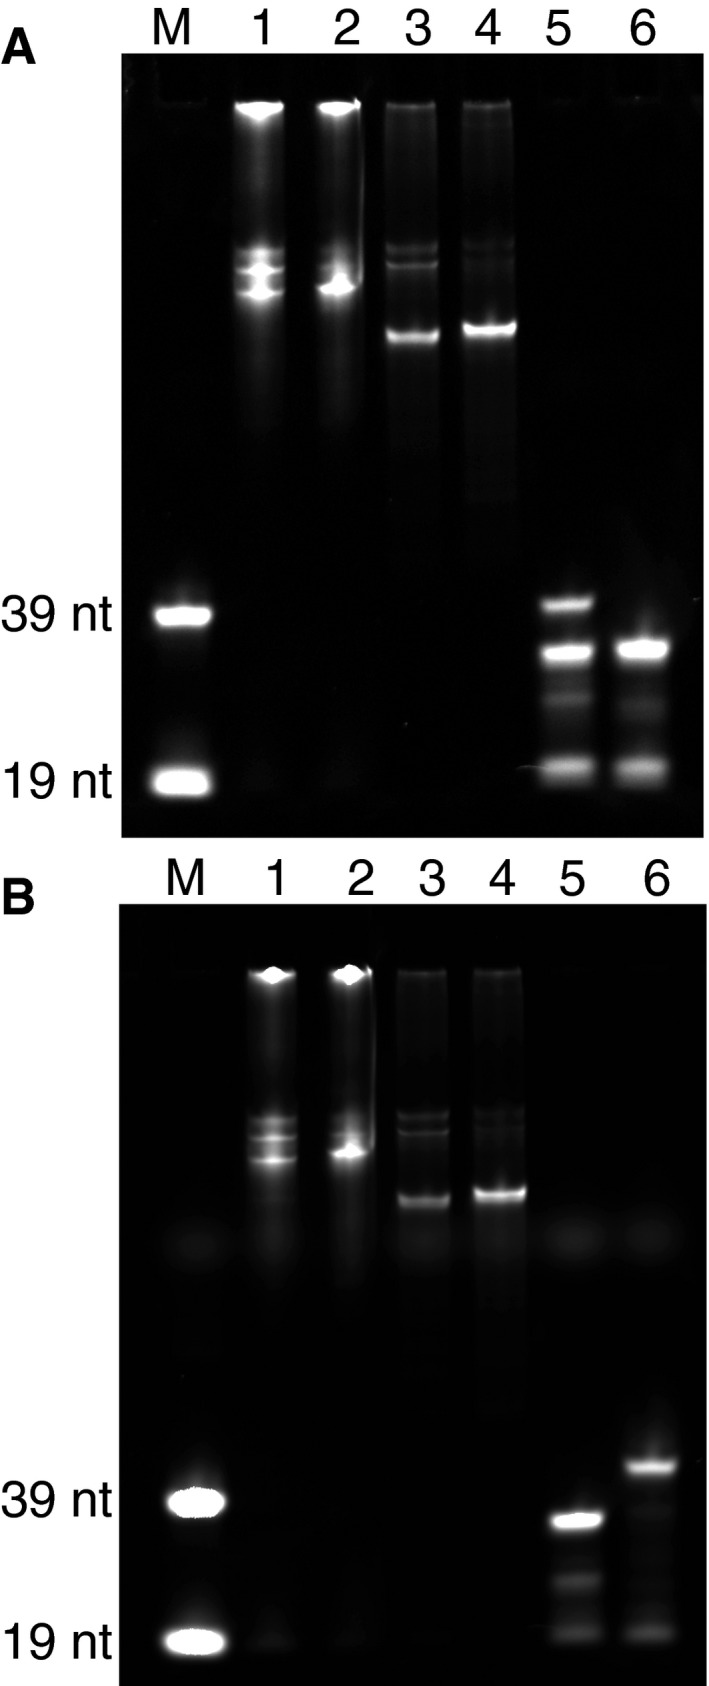
Figure EV6
Products from the different steps of the FISH probe production protocol
A, B Products were run on a 10% polyacrylamide gel and imaged in (A) Cy3 and (B) Cy5 channels. (M): Cy3u2010 and Cy5u2010labeled 39u2010nt and 19u2010nt ssDNA probes were used as size references. (1) ...
Figure images are served from the NIH/NLM PubMed Central Open Access Subset or Europe PMC; copyright remains with the publishers and authors.
💬 Discussion
0 commentsNo comments yet. Be the first to start a discussion!
Leave a Comment