Abstract
The protein disaggregase ClpB hexamer is conserved across evolution and has two AAA+-type nucleotide-binding domains, NBD1 and NBD2, in each protomer. In M. tuberculosis (Mtb), ClpB facilitates asymmetric distribution of protein aggregates during cell division to help the pathogen survive and persist within the host, but a mechanistic understanding has been lacking. Here we report cryo-EM structures at 3.8- to 3.9-Å resolution of Mtb ClpB bound to a model substrate, casein, in the presence of the weakly hydrolyzable ATP mimic adenosine 5'-[γ-thio]triphosphate. Mtb ClpB existed in solution in two closed-ring conformations, conformers 1 and 2. In both conformers, the 12 pore-loops on the 12 NTDs of the six protomers (P1-P6) were arranged similarly to a staircase around the bound peptide. Conformer 1 is a low-affinity state in which three of the 12 pore-loops (the protomer P1 NBD1 and NBD2 loops and the protomer P2 NBD1 loop) are not engaged with peptide. Conformer 2 is a high-affinity state because only one pore-loop (the protomer P2 NBD1 loop) is not engaged with the peptide. The resolution of the two conformations, along with their bound substrate peptides and nucleotides, enabled us to propose a nucleotide-driven peptide translocation mechanism of a bacterial ClpB that is largely consistent with several recent unfoldase structures, in particular with the eukaryotic Hsp104. However, whereas Hsp104's two NBDs move in opposing directions during one step of peptide translocation, in Mtb ClpB the two NBDs move only in the direction of translocation.
🔬 Techniques
🔭 Microscopes
🧬 Organisms
💻 Software
✨ Fluorophores
🏭 Microscope Brands
🧪 Reagent Suppliers
💻 Software Details
💾 Data Repositories
🏛️ Research Organizations (ROR)
Affiliated research institutions:
📋 Methods
Overexpression and Purification of Mtb ClpB. The construct of Mtb ClpB with an N-terminal His-SUMO tag was from a previous study ( 4 ). A similar sample preparation procedure was used with some modifications. Briefly, E. coli Rosetta2 cells (Novagen) transformed with the N-terminal His-SUMO–tagged Mtb ClpB were cultured in LB medium supplemented with 100 μg/mL ampicillin and 34 μg/mL chloramphenicol at 37°C and were grown to OD 600 ∼0.5–0.6 before cooling to 25 °C. Protein expression was induced with 1 mM isopropyl β- d -1-thiogalactopyranoside for 5 h. Collected frozen cells were lysed in buffer containing 20 mM Tris (pH 8.0) and 300 mM NaCl. After centrifugation, the protein was purified from the supernatant using nickel-nitrilotriacetic acid (Ni-NTA) affinity chromatography. During dialysis into buffer A [20 mM Hepes (pH 7.5), 40 mM NaCl, and 10 mM MgCl 2 ], the His-SUMO tag was cleaved by incubation with His-tagged protease Ulp1 at a 10:1 ClpB:Ulp1 weight:weight ratio. The protease and cleaved His-SUMO tag were removed by Ni-NTA affinity chromatography, and the flow-through was concentrated and subjected to a gel-filtration purification step (Superose 6; GE Healthcare) in buffer A. The fractions corresponding to the estimated hexamer elution peak were pooled for further use. The protein concentration at this stage was ∼1 mg/mL. Cryo-EM Data Acquisition. Purified ClpB diluted to ∼0.8 mg/mL was saturated with excessive substrates including 2 mM ADP, 2 mM AMPNP, 2 mM ATPγS, or 2 mM ATPγS, and κ-casein (catalog no. C0406; Sigma) in twofold molar excess to ClpB hexamer. The mixtures were subsequently incubated at 4 °C for 1 h. Three-microliter aliquots of the incubated sample were applied to glow-discharged holey carbon grids (C-Flat Cu CF-1.2/1.3, 300 or 400 mesh). The grids were blotted for 4 s at 4 °C with 95% humidity and were flash-frozen in liquid ethane using an FEI Vitrobot Mark IV device. For initial evaluation, cryo-EM data were recorded on a Falcon II detector operated in linear mode in a 200-kV FEI Arctica Talos electron microscope. Automated data acquisition was performed with the FEI EPU software package. For each sample, 300–400 movies were recorded at a nominal magnification of 120,000×, in a physical pixel size of 1.21 Å per pixel. Defocus values varied from −1.5 μm to −3 μm. Two samples, ClpB + AMP-PNP and ClpB + ATPγS + casein, were subjected to high-resolution cryo-EM data acquisition in a 300-kV FEI Titan Krios electron microscope with a K2 camera positioned after a GIF quantum energy filter (Gatan), yielding 2,535 and 3,537 movies, respectively. The FEI EPU package was used for automated data acquisition. Micrographs were collected in the superresolution counting mode at a nominal magnification of 130,000×, resulting in a physical pixel size of 1.07 Å. Defocus values varied from −1.1 μm to −3.0 μm. The dose rate was 10.0 electrons per pixel per second. A total exposure of 6 s was dose-fractionated into 30 frames, resulting in a total accumulated dose of 52 electrons/Å 2 . Image Processing and 3D Reconstruction. The movies collected on Arctica Talos were motion-corrected with MotionCor2 ( 25 ). Dose-fractionated movies collected on Titan Krios were also motion-corrected, dose-weighted, and binned by a factor of 2 with MotionCor2 ( 25 , 26 ), resulting in summed micrographs with a physical pixel size of 1.07 Å. CTFFIND4 was used to estimate the contrast transfer function (CTF) parameters for individual micrographs ( 27 ). Subsequent image-processing steps were performed using RELION 2.0 ( 28 ). For each dataset, a set of manually picked particles was first subjected to 2D classification to generate a set of templates. These templates were used for reference-based automatic particle picking. The picked particles were subject to particle sorting and subsequent reference-free 2D classification. For the two high-resolution datasets collected in Titan Krios, we first removed contaminants and noisy particles by 2D classification as described above and carried out further processing on the cleaned-up datasets. For the ClpB+AMP-PNP data from 2,535 micrographs, 3D classification was performed using a map generated by cryoSPARC as the initial reference model ( 29 ). The dominant 3D class with 112,043 particles was subjected to the final 3D autorefinement with a soft mask. This generated a 3D reconstruction at an overall resolution of 6.3 Å, suggesting substantial flexibility of this structure. For the ClpB+ATPγS+casein dataset from 3,537 micrographs, a map generated by cryoSPARC was used as the initial model for 3D classification. The two most populated 3D classes were combined. 3D autorefinement of this dataset of 354,656 particles with a soft mask resulted in a 3D map with an overall resolution of 3.8 Å. We found that the density for protomer P1 was very weak in this map, indicating substantial flexibility in the region. Therefore, a second round of 3D classification with six classes was carried out, resulting in two different conformations in the protomer P1 region. The most populated 3D class of each conformation was subject to another round of 3D autorefinement, generating two 3D reconstructions, conformer 1 at 3.8-Å resolution, from 108,111 selected particles, and conformer 2 at 3.9-Å resolution, from 76,666 particles. Finally, the particles corresponding to conformers 1 and 2 were combined, and another 3D autorefinement was performed, resulting in a combined map at 3.6-Å overall resolution. The respective resolutions of the three 3D reconstructions were estimated based on the gold standard Fourier shell correlation 0.143 criterion ( 30 ). The final maps were corrected for the modulation transfer function (MTF) of the detector and were sharpened by applying a negative B-factor, estimated by the postprocessing procedure in RELION 2.0. Local resolution distribution was estimated using ResMap ( 31 ). Atomic Model Building. Modeling of conformers 1 and 2 (ClpB+ATPγS+Casein) was based on the crystal structure of E. coli ClpB [Protein Data Bank (PDB) ID code 4CIU] ( 8 ). Using this structure, an initial Mtb ClpB protomer model was generated with the SWISS-MODEL server ( 32 ). The protomer model was split into two separate domains: NBD1 (amino acids 159–545) and NBD2 (amino acids 546–848). We rigid-body docked NBD1 and NBD2 domains into the 3.6-Å average 3D map using the Fit-in-map function in Chimera (University of California, San Francisco) ( 33 ). The docked models were improved by manual adjustments and rebuilding in Coot ( 34 ). The rebuilding process was guided by visible densities of many bulky residues such as Trp, Tyr, Arg, and Phe. For the modeling of conformer 1 and conformer 2, six copies of the built models of NBD1 and NBD2 domains were then docked into their corresponding maps, at 3.8-Å resolution for conformer 1 and 3.9-Å resolution for conformer 2. After slight manual adjustments and rebuilding in Coot, the real-space refinement of the atomic models of conformers 1 and 2 against their respective cryo-EM 3D maps was done using the phenix.real_space_refine in PHENIX ( 35 ). In the last step, to model the MD domain in a lower-density threshold, the initial motif 1 atomic model was obtained from the crystal structure of E. coli ClpB (PDB ID code 4CIU) and was directly rigid body-docked into the EM densities without further refinement. The model of the tight protomer P5 of conformer 1 was used for modeling the ClpB-AMP-PNP structure. After removal of the side-chain information, six NBD1 and NBD2 domains were rigid-body fitted into the EM map using Chimera. Then some manual adjustments were performed in Coot to correct the large model deviations from the densities. Because of the low resolution, this model was not subjected to further refinement. MolProbity (Duke University) was used to assess the final models ( 36 ). PyMOL (Schrödinger, LLC.) and Chimera were used to prepare the figures. Statistics of the 3D reconstruction and model refinement are provided in SI Appendix , Table S1 . Protein Reactivation Assay Using Denatured Firefly Luciferase. This protocol was modified from other reports ( 37 – 39 ) and has been described with M. tuberculosis chaperones ( 4 ), which were purified as detailed in that report. Luciferase (100 nM) was heated with Hsp20 (400 nM) in 5-μL aliquots for 5 min at 42 °C in 50 mM Tris(hydroxymethyl)aminomethane (pH 7.5), 150 mM KCl, 20 mM MgCl 2 , and 2 mM DTT (buffer B) in nonstick tubes and then was cooled on ice for 5 min (to give 2–4% luciferase activity relative to native). Protein disaggregation/refolding reactions were performed by adding the indicated amounts of chaperones and/or cofactors (DnaK: 6 μM; remaining chaperone/cofactor: 2 μM each) in buffer B plus 1 mg/mL BSA and were initiated by adding 2 mM ATP to a final reaction volume of 20 μL and placing tubes at 25 °C for 30 min. Luminescence was measured by placing 2-μL samples into black 96-well polystyrene plates (Costar) and adding 100 μL of luciferase reagent (Promega). Light emission was measured using a SpectraMax L microplate reader luminometer (Molecular Devices) within the linear range of the instrument, and analysis was performed with SoftMax Pro software (Molecular Devices). An integration time of 10 s was used for all measurements. One hundred percent native luciferase activity was measured using luciferase + Hsp20 prepared in the same manner without the denaturation step, diluted in buffer B plus 1 mg/mL BSA, and incubated for the same period of time at the same temperature. Reactions with ClpB and mutants were done in triplicate in two independent experiments and are shown compared with the same reactions lacking ClpB done in at least triplicate. Percent luciferase activity was determined using Prism software as percent of reaction luminescence relative to native luminescence for each and then normalized relative to reactions containing wild-type ClpB measured in the same experiment.
Show full methods section
Overexpression and Purification of Mtb ClpB. The construct of Mtb ClpB with an N-terminal His-SUMO tag was from a previous study ( 4 ). A similar sample preparation procedure was used with some modifications. Briefly, E. coli Rosetta2 cells (Novagen) transformed with the N-terminal His-SUMO–tagged Mtb ClpB were cultured in LB medium supplemented with 100 μg/mL ampicillin and 34 μg/mL chloramphenicol at 37°C and were grown to OD 600 ∼0.5–0.6 before cooling to 25 °C. Protein expression was induced with 1 mM isopropyl β- d -1-thiogalactopyranoside for 5 h. Collected frozen cells were lysed in buffer containing 20 mM Tris (pH 8.0) and 300 mM NaCl. After centrifugation, the protein was purified from the supernatant using nickel-nitrilotriacetic acid (Ni-NTA) affinity chromatography. During dialysis into buffer A [20 mM Hepes (pH 7.5), 40 mM NaCl, and 10 mM MgCl 2 ], the His-SUMO tag was cleaved by incubation with His-tagged protease Ulp1 at a 10:1 ClpB:Ulp1 weight:weight ratio. The protease and cleaved His-SUMO tag were removed by Ni-NTA affinity chromatography, and the flow-through was concentrated and subjected to a gel-filtration purification step (Superose 6; GE Healthcare) in buffer A. The fractions corresponding to the estimated hexamer elution peak were pooled for further use. The protein concentration at this stage was ∼1 mg/mL. Cryo-EM Data Acquisition. Purified ClpB diluted to ∼0.8 mg/mL was saturated with excessive substrates including 2 mM ADP, 2 mM AMPNP, 2 mM ATPγS, or 2 mM ATPγS, and κ-casein (catalog no. C0406; Sigma) in twofold molar excess to ClpB hexamer. The mixtures were subsequently incubated at 4 °C for 1 h. Three-microliter aliquots of the incubated sample were applied to glow-discharged holey carbon grids (C-Flat Cu CF-1.2/1.3, 300 or 400 mesh). The grids were blotted for 4 s at 4 °C with 95% humidity and were flash-frozen in liquid ethane using an FEI Vitrobot Mark IV device. For initial evaluation, cryo-EM data were recorded on a Falcon II detector operated in linear mode in a 200-kV FEI Arctica Talos electron microscope. Automated data acquisition was performed with the FEI EPU software package. For each sample, 300–400 movies were recorded at a nominal magnification of 120,000×, in a physical pixel size of 1.21 Å per pixel. Defocus values varied from −1.5 μm to −3 μm. Two samples, ClpB + AMP-PNP and ClpB + ATPγS + casein, were subjected to high-resolution cryo-EM data acquisition in a 300-kV FEI Titan Krios electron microscope with a K2 camera positioned after a GIF quantum energy filter (Gatan), yielding 2,535 and 3,537 movies, respectively. The FEI EPU package was used for automated data acquisition. Micrographs were collected in the superresolution counting mode at a nominal magnification of 130,000×, resulting in a physical pixel size of 1.07 Å. Defocus values varied from −1.1 μm to −3.0 μm. The dose rate was 10.0 electrons per pixel per second. A total exposure of 6 s was dose-fractionated into 30 frames, resulting in a total accumulated dose of 52 electrons/Å 2 . Image Processing and 3D Reconstruction. The movies collected on Arctica Talos were motion-corrected with MotionCor2 ( 25 ). Dose-fractionated movies collected on Titan Krios were also motion-corrected, dose-weighted, and binned by a factor of 2 with MotionCor2 ( 25 , 26 ), resulting in summed micrographs with a physical pixel size of 1.07 Å. CTFFIND4 was used to estimate the contrast transfer function (CTF) parameters for individual micrographs ( 27 ). Subsequent image-processing steps were performed using RELION 2.0 ( 28 ). For each dataset, a set of manually picked particles was first subjected to 2D classification to generate a set of templates. These templates were used for reference-based automatic particle picking. The picked particles were subject to particle sorting and subsequent reference-free 2D classification. For the two high-resolution datasets collected in Titan Krios, we first removed contaminants and noisy particles by 2D classification as described above and carried out further processing on the cleaned-up datasets. For the ClpB+AMP-PNP data from 2,535 micrographs, 3D classification was performed using a map generated by cryoSPARC as the initial reference model ( 29 ). The dominant 3D class with 112,043 particles was subjected to the final 3D autorefinement with a soft mask. This generated a 3D reconstruction at an overall resolution of 6.3 Å, suggesting substantial flexibility of this structure. For the ClpB+ATPγS+casein dataset from 3,537 micrographs, a map generated by cryoSPARC was used as the initial model for 3D classification. The two most populated 3D classes were combined. 3D autorefinement of this dataset of 354,656 particles with a soft mask resulted in a 3D map with an overall resolution of 3.8 Å. We found that the density for protomer P1 was very weak in this map, indicating substantial flexibility in the region. Therefore, a second round of 3D classification with six classes was carried out, resulting in two different conformations in the protomer P1 region. The most populated 3D class of each conformation was subject to another round of 3D autorefinement, generating two 3D reconstructions, conformer 1 at 3.8-Å resolution, from 108,111 selected particles, and conformer 2 at 3.9-Å resolution, from 76,666 particles. Finally, the particles corresponding to conformers 1 and 2 were combined, and another 3D autorefinement was performed, resulting in a combined map at 3.6-Å overall resolution. The respective resolutions of the three 3D reconstructions were estimated based on the gold standard Fourier shell correlation 0.143 criterion ( 30 ). The final maps were corrected for the modulation transfer function (MTF) of the detector and were sharpened by applying a negative B-factor, estimated by the postprocessing procedure in RELION 2.0. Local resolution distribution was estimated using ResMap ( 31 ). Atomic Model Building. Modeling of conformers 1 and 2 (ClpB+ATPγS+Casein) was based on the crystal structure of E. coli ClpB [Protein Data Bank (PDB) ID code 4CIU] ( 8 ). Using this structure, an initial Mtb ClpB protomer model was generated with the SWISS-MODEL server ( 32 ). The protomer model was split into two separate domains: NBD1 (amino acids 159–545) and NBD2 (amino acids 546–848). We rigid-body docked NBD1 and NBD2 domains into the 3.6-Å average 3D map using the Fit-in-map function in Chimera (University of California, San Francisco) ( 33 ). The docked models were improved by manual adjustments and rebuilding in Coot ( 34 ). The rebuilding process was guided by visible densities of many bulky residues such as Trp, Tyr, Arg, and Phe. For the modeling of conformer 1 and conformer 2, six copies of the built models of NBD1 and NBD2 domains were then docked into their corresponding maps, at 3.8-Å resolution for conformer 1 and 3.9-Å resolution for conformer 2. After slight manual adjustments and rebuilding in Coot, the real-space refinement of the atomic models of conformers 1 and 2 against their respective cryo-EM 3D maps was done using the phenix.real_space_refine in PHENIX ( 35 ). In the last step, to model the MD domain in a lower-density threshold, the initial motif 1 atomic model was obtained from the crystal structure of E. coli ClpB (PDB ID code 4CIU) and was directly rigid body-docked into the EM densities without further refinement. The model of the tight protomer P5 of conformer 1 was used for modeling the ClpB-AMP-PNP structure. After removal of the side-chain information, six NBD1 and NBD2 domains were rigid-body fitted into the EM map using Chimera. Then some manual adjustments were performed in Coot to correct the large model deviations from the densities. Because of the low resolution, this model was not subjected to further refinement. MolProbity (Duke University) was used to assess the final models ( 36 ). PyMOL (Schrödinger, LLC.) and Chimera were used to prepare the figures. Statistics of the 3D reconstruction and model refinement are provided in SI Appendix , Table S1 . Protein Reactivation Assay Using Denatured Firefly Luciferase. This protocol was modified from other reports ( 37 – 39 ) and has been described with M. tuberculosis chaperones ( 4 ), which were purified as detailed in that report. Luciferase (100 nM) was heated with Hsp20 (400 nM) in 5-μL aliquots for 5 min at 42 °C in 50 mM Tris(hydroxymethyl)aminomethane (pH 7.5), 150 mM KCl, 20 mM MgCl 2 , and 2 mM DTT (buffer B) in nonstick tubes and then was cooled on ice for 5 min (to give 2–4% luciferase activity relative to native). Protein disaggregation/refolding reactions were performed by adding the indicated amounts of chaperones and/or cofactors (DnaK: 6 μM; remaining chaperone/cofactor: 2 μM each) in buffer B plus 1 mg/mL BSA and were initiated by adding 2 mM ATP to a final reaction volume of 20 μL and placing tubes at 25 °C for 30 min. Luminescence was measured by placing 2-μL samples into black 96-well polystyrene plates (Costar) and adding 100 μL of luciferase reagent (Promega). Light emission was measured using a SpectraMax L microplate reader luminometer (Molecular Devices) within the linear range of the instrument, and analysis was performed with SoftMax Pro software (Molecular Devices). An integration time of 10 s was used for all measurements. One hundred percent native luciferase activity was measured using luciferase + Hsp20 prepared in the same manner without the denaturation step, diluted in buffer B plus 1 mg/mL BSA, and incubated for the same period of time at the same temperature. Reactions with ClpB and mutants were done in triplicate in two independent experiments and are shown compared with the same reactions lacking ClpB done in at least triplicate. Percent luciferase activity was determined using Prism software as percent of reaction luminescence relative to native luminescence for each and then normalized relative to reactions containing wild-type ClpB measured in the same experiment.
📊 Figures
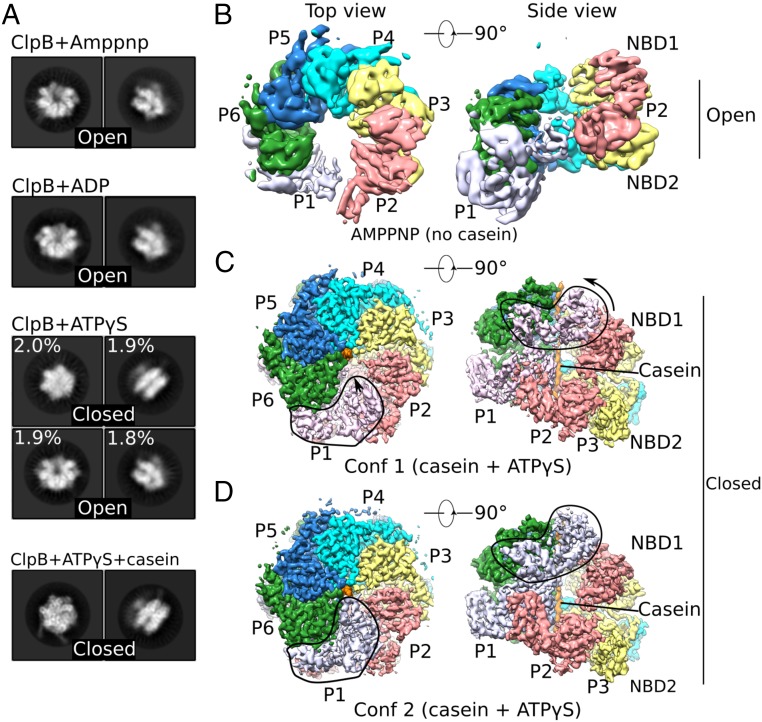
Fig. 1.
Cryo-EM analyses of multiple states of Mtb ClpB disaggregase. ( A ) Representative 2D images of the ClpB asymmetric hexamer ( Left : top view; Right : side view) in the presence of different nucleotid...
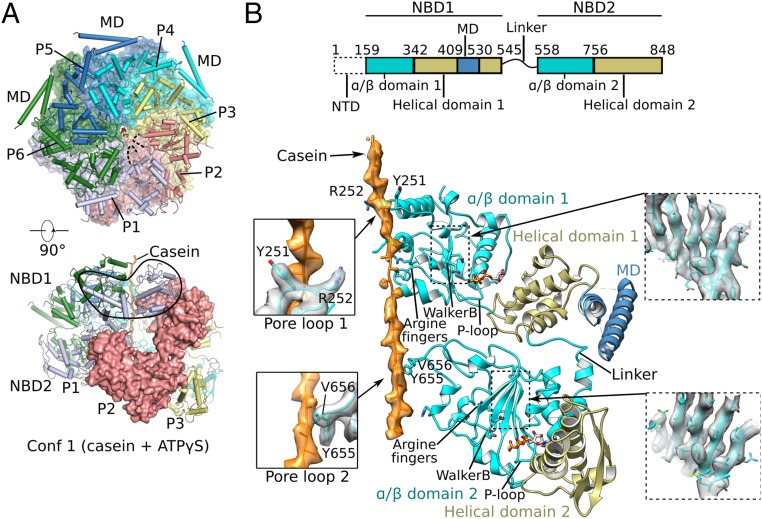
Fig. 2.
Cryo-EM structure of conformer 1 of Mtb ClpB complexed with ATPu03b3S and casein. ( A ) Two orthogonal views of the atomic model of conformer 1 (corresponding to Fig. 1 C ). ( Upper ) The NBD2 ring is...
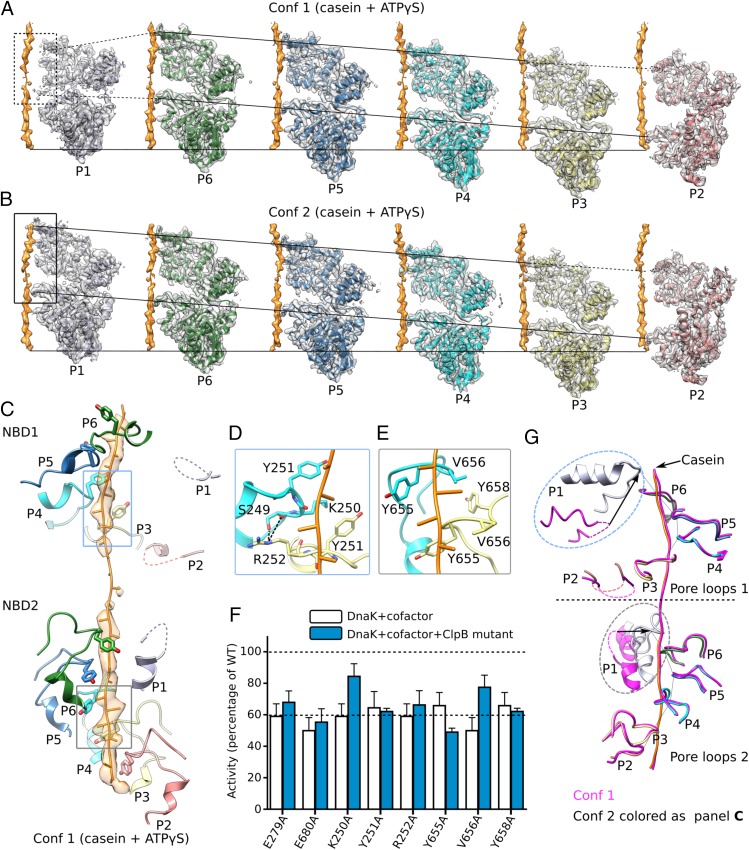
Fig. 3.
Interactions between ClpB and bound substrate mimic casein. ( A and B ) Individual protomers within conformer 1 (Conf 1) ( A ) and conformer 2 (Conf 2) ( B ) are shown separately with a 60u00b0 rotati...
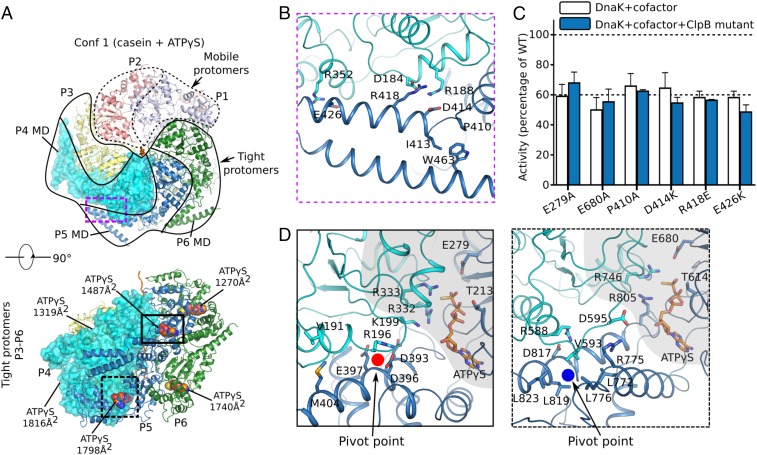
Fig. 4.
Protomer organization in conformer 1 (Conf 1) of Mtb ClpB bound to casein. ( A ) Mobile (protomers P1 and P2; dashed protomer boundary) vs. tightly packed protomers (protomers P3u2013P6; solid boundar...
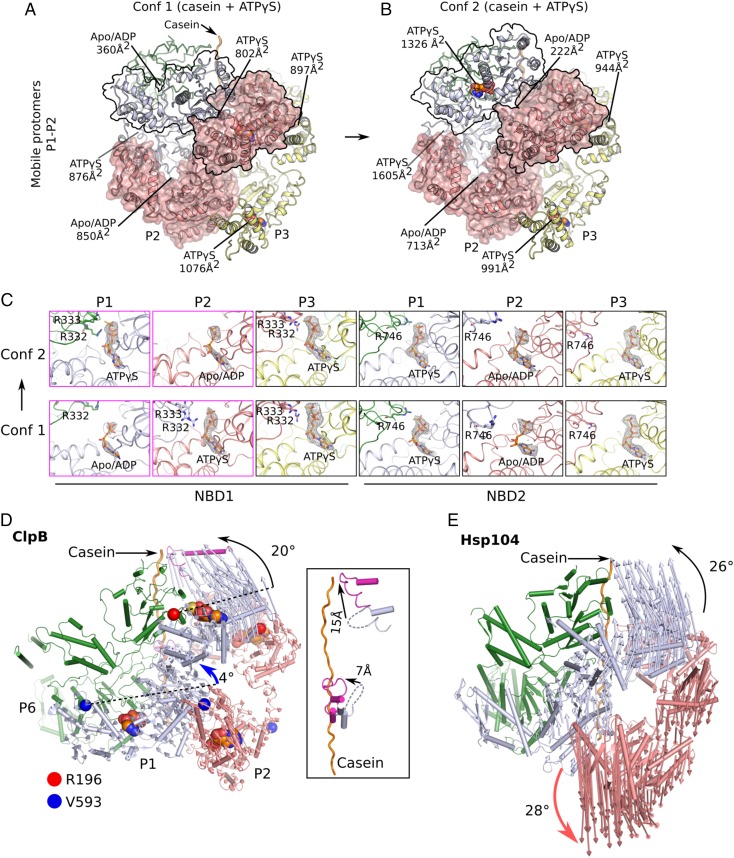
Fig. 5.
Nucleotide states and structural changes between conformers 1 and 2 of Mtb ClpB bound to casein. ( A and B ) The different arrangement of the mobile protomers P1 and P2 in conformer 1 (Conf 1) ( A ) a...
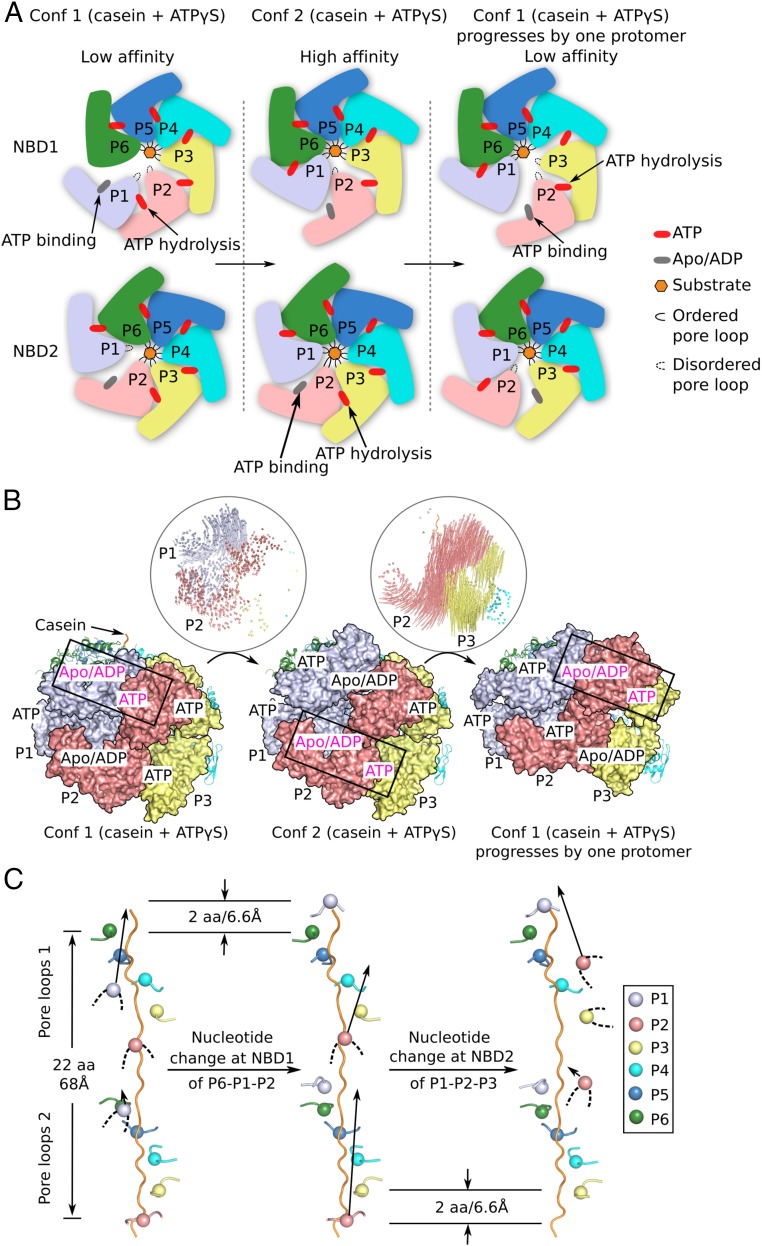
Fig. 6.
A putative three-stage, rotary sequential nucleotide-driven substrate translocation mechanism of Mtb ClpB. ( A ) A sketch of the proposed mechanism in which the hexamer progresses from stage 1 (confor...
Figure images are served from the NIH/NLM PubMed Central Open Access Subset or Europe PMC; copyright remains with the publishers and authors.
💬 Discussion
0 commentsNo comments yet. Be the first to start a discussion!
Leave a Comment