Abstract
Quantitative colocalization studies suffer from the lack of unified approach to interpret obtained results. We developed a tool to characterize the results of colocalization experiments in a way so that they are understandable and comparable both qualitatively and quantitatively. Employing a fuzzy system model and computer simulation, we produced a set of just five linguistic variables tied to the values of popular colocalization coefficients: "Very Weak", "Weak", "Moderate", "Strong", and "Very Strong". The use of the variables ensures that the results of colocalization studies are properly reported, easily shared, and universally understood by all researchers working in the field. When new coefficients are introduced, their values can be readily fitted into the set.
🔬 Techniques
💻 Software
✨ Fluorophores
🧪 Sample Preparation
🏭 Microscope Brands
🧪 Reagent Suppliers
💻 Software Details
🏛️ Research Organizations (ROR)
Affiliated research institutions:
📋 Methods
Design of a fuzzy system
The design of a fuzzy system started from a crisp system, such as a variable called "colocalization value" that can take any precise values on (0, 1). Then, we introduced fuzzy values, such as "Weak", "Moderate" and "Strong". A crisp proposition like "colocalization value is x" is either true (truth value 1) or false (truth value 0), whereas a fuzzy proposition like "colocalization value is Strong" has a truth value between 0 and 1, which was calculated by a membership function μ STRONG (x). The fuzzy proposition with the largest truth value was then used as the output of the fuzzy system. Fuzzy values were modified using an adverb “Very”. The value “Very Strong” differs from “Strong” in that its membership function is μ STRONG 2 (x).
Generation of synthetic computer-simulated images
Images with predefined values of colocalization were generated by merging pairs of green and red computer-simulated images for the red/green pair of channels. With the help of BioSim simulation computer software (MATLAB source code is available at www.anes.ucla.edu/~wuyong/biosim.zip ), virtual “molecules” were placed in a synthetic image 7 . The number of colocalized molecules was precisely controlled via the software. The images were free of background noise. The degree of colocalization in the images ranged from 0 to 0.9 (according to 0 to 1.0 scale) ( Figure 3 ). The images can be downloaded and used to obtain the ranges of values of newly-introduced colocalization coefficients, which can then be fitted into the set of linguistic variables shown on Table 4 .
Show full methods section
Design of a fuzzy system
The design of a fuzzy system started from a crisp system, such as a variable called "colocalization value" that can take any precise values on (0, 1). Then, we introduced fuzzy values, such as "Weak", "Moderate" and "Strong". A crisp proposition like "colocalization value is x" is either true (truth value 1) or false (truth value 0), whereas a fuzzy proposition like "colocalization value is Strong" has a truth value between 0 and 1, which was calculated by a membership function μ STRONG (x). The fuzzy proposition with the largest truth value was then used as the output of the fuzzy system. Fuzzy values were modified using an adverb “Very”. The value “Very Strong” differs from “Strong” in that its membership function is μ STRONG 2 (x).
Generation of synthetic computer-simulated images
Images with predefined values of colocalization were generated by merging pairs of green and red computer-simulated images for the red/green pair of channels. With the help of BioSim simulation computer software (MATLAB source code is available at www.anes.ucla.edu/~wuyong/biosim.zip ), virtual “molecules” were placed in a synthetic image 7 . The number of colocalized molecules was precisely controlled via the software. The images were free of background noise. The degree of colocalization in the images ranged from 0 to 0.9 (according to 0 to 1.0 scale) ( Figure 3 ). The images can be downloaded and used to obtain the ranges of values of newly-introduced colocalization coefficients, which can then be fitted into the set of linguistic variables shown on Table 4 .
Generation of computer-simulated images modeled after a real biological image
Original images were acquired as described in the fluorescence microscopy section below. Prior to be used for modeling, they were processed for background correction using “Average Contrast and Fluorescence” settings with the help of CoLocalizer Pro software. Protein clusters, treated as point sources, were randomly positioned in a representative image according to biological structures. Each of the clusters generated an intensity distribution according to a Gaussian point spread function (PSF). The degree of colocalization was precisely controlled by knowing the exact number of clusters generated by BioSim software. Specifically labeled clusters were distinguishable from nonspecifically labeled ones by being significantly brighter. The degree of colocalization in the images ranged from 0 to 0.9 (according to the 0 to 1.0 scale).
Fluorescence microscopy
Images of fluorescence of liver bile canaliculi stained for multidrug resistance protein 2 (Mrp2) (red fluorescence) and bile salt export pump (Bsep) (green fluorescence), known to be colocalized 15 were acquired using a confocal microscope LSM 410 (Carl Zeiss). Primary anti-Mrp2 and anti-Bsep antibodies were obtained commercially. Alexa 488 and Alexa 594 secondary antibodies (Invitrogen) were used for labeling Bsep and Mrp2, respectively. Dual-stained images were obtained using an immersion-oil Plan-Neofluar 40/0.75 objective and acquired by sequential laser scanning to minimize bleedthrough. Images were saved in lossless TIFF format to ensure reliability of quantification with a dimension of 512 × 512 pixels.
Quantification of colocalization
Colocalization was quantified using protein proximity index (PPI) and various coefficients.
Protein proximity analysis
(PPA) software ( www.anes.ucla.edu/~wuyong/ ) was used to estimate PPI 7 . Coefficients included Pearson's correlation coefficient (Rr), overlap coefficient (R), overlap coefficients k 1 (k 2 ), and colocalization coefficients m 1 (m 2 ) and were calculated using CoLocalizer Pro 2.7.1 software (CoLocalization Research Software, www.colocalizer.com ) 8 .
📊 Figures
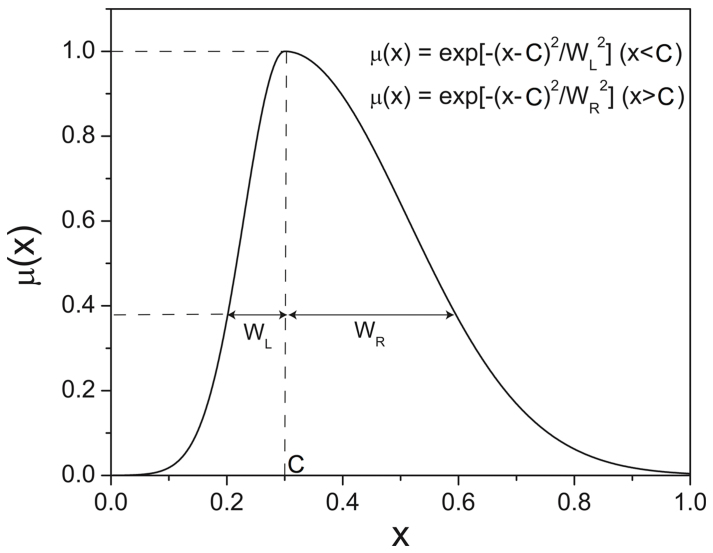
Figure 1
Gaussian membership function u03bc(x) centered at C with unequal left and right width W L and W R , respectively.
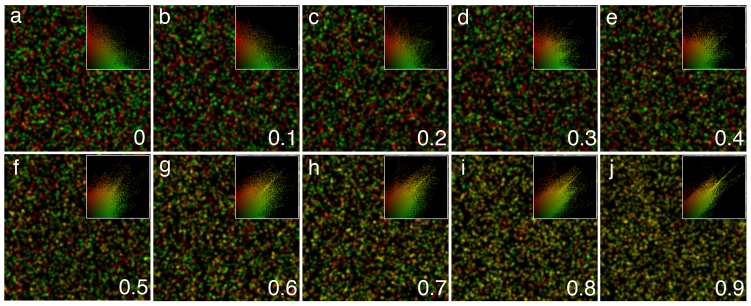
Figure 2
Computer-simulated images with predefined values of colocalization demonstrating its gradual increase (from 0 to 0.9 according to the 0 to 1.0 scale) as indicated by respective scatter grams at the upper right corner showing pixels concentrating along their diagonals as the degree of colocalization rises (au2013j).
Images were generated by merging pairs of single-channel red and single-channel green computer-simulated images for the respective pair of channels. Then, they were used to adjust the widths of Gaussi...
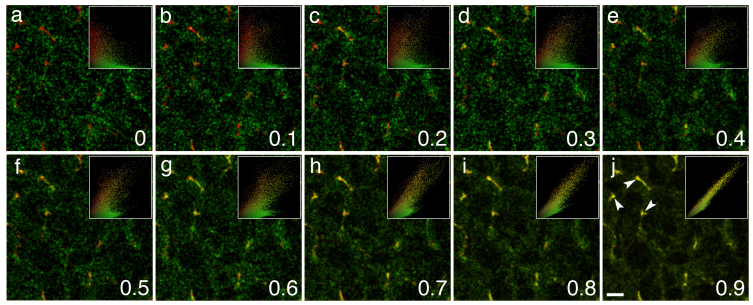
Figure 3
Computer-simulated images with predefined values of colocalization demonstrating its gradual increase (from 0 to 0.9 according to the 0 to 1.0 scale) as indicated by respective scatter grams at the upper right corner showing pixels concentrating along their diagonals as the degree of colocalization rises (au2013j).
Images are modeled after a real biological image of liver stained for multidrug resistance protein 2 (Mrp2) (red fluorescence) and bile salt export pump (Bsep) (green fluorescence). Overlap of colours...
Figure images are served from the NIH/NLM PubMed Central Open Access Subset or Europe PMC; copyright remains with the publishers and authors.
💬 Discussion
0 commentsNo comments yet. Be the first to start a discussion!
Leave a Comment