Abstract
AbstractSevere acute respiratory syndrome coronavirus 2 (SARS-CoV-2), the causative agent of the recent pandemic COVID-19, is reported to have originated from bats, with its intermediate host unknown to date. Here, we screened 26 animal counterparts of the human ACE2 (hACE2), the receptor for SARS-CoV-2 and SARS-CoV, and found that the ACE2s from various species, including pets, domestic animals and multiple wild animals, could bind to SARS-CoV-2 receptor binding domain (RBD) and facilitate the transduction of SARS-CoV-2 pseudovirus. Comparing to SARS-CoV-2, SARS-CoV seems to have a slightly wider range in choosing its receptor. We further resolved the cryo-electron microscopy (cryo-EM) structure of the cat ACE2 (cACE2) in complex with the SARS-CoV-2 RBD at a resolution of 3 Å, revealing similar binding mode as hACE2 to the SARS-CoV-2 RBD. These results shed light on pursuing the intermediate host of SARS-CoV-2 and highlight the necessity of monitoring susceptible hosts to prevent further outbreaks.
🔬 Techniques
🔭 Microscopes
🧬 Organisms
💻 Software
✨ Fluorophores
🧪 Sample Preparation
🔬 Cell Lines
🏭 Microscope Brands
🧪 Reagent Suppliers
📷 Detectors
💻 Software Details
🏛️ Research Organizations (ROR)
Affiliated research institutions:
📋 Methods
Gene cloning
The full-length ACE2 coding sequences of 26 animals (accession numbers are shown in Supplementary Table S1 ) were synthesized and respectively cloned into pEGFP-N1 vector used for flow cytometry. The ectodomains of the 26 ACE2s fused with the Fc domain of mouse IgG (mFc) were individually cloned into pCAGGS vector using Eco RI and Xho I restriction sites used for SPR. The pFastBac plasmids expressing SARS-CoV-2 RBD (residues 319–541, GISAID: EPI_ISL_402119), SARS-CoV-2 NTD (residues 20–286, GISAID: EPI_ISL_402119) and SARS-CoV RBD (residues 306–527, GenBank: NC_004718 ) used for both flow cytometry and SPR were constructed in our previous work 24 . The coding sequence of cACE2 (residues 18–740) was synthesized and cloned into pET21a vector (pET21a-cACE2) used for protein expression and purification. Protein expression and purification The SARS-CoV-2 RBD, SARS-CoV-2 NTD, and SARS-CoV RBD proteins used for flow cytometry and SPR experiments were expressed and purified using Bac-to-Bac baculovirus expression system (Invitrogen) as described in our previous work 24 . To prepare the mFc-tagged ACE2 proteins, the pCAGGS plasmids containing the coding sequences of ACE2s were transiently transfected into HEK293T cells. 48 h later, supernatant containing the indicated protein were collected, concentrated and then used for SPR assays. The pET21a-cACE2 was transformed into Escherichia coli ( E. coli ) strain BL21 (DE3) for protein expression. cACE2 was over expressed in E. coli as inclusion bodies and refolded as previously 37 . Briefly, the dissolved cACE2 inclusion bodies were diluted dropwise in a refolding buffer (100 mM Tris-HCl, pH 8.0, 2 mM EDTA, 400 mM L-arginine, 0.5 mM oxidized glutathione and 5 mM reduced glutathione) at 4 °C overnight. The refolded cACE2 proteins were concentrated using an Amicon 8400 concentrator with 10 kDa cutoff membrane and changed into 20 mM Tris-HCl (pH 8.0) and 150 mM NaCl buffer and subsequently purified by gel-filtration chromatography with a HiLoad 16/600 SuperdexTM 200 pg column (GE Healthcare) using ÄKTA System. To obtain the cACE2 and SARS-CoV-2 RBD complex, purified cACE2 and SARS-CoV-2 RBD proteins were mixed in a 1:2 molar ratio and incubated for 1 h on ice. The mixture was then purified with a HiLoad 16/600 SuperdexTM 200 pg column (GE Healthcare) in 20 mM Tris-HCl (pH 8.0) and 150 mM NaCl buffer. The complex peak of the cACE2 with the SARS-CoV-2 RBD was collected and concentrated to ~0.2 mg/mL for cryo-EM.
Show full methods section
Gene cloning
The full-length ACE2 coding sequences of 26 animals (accession numbers are shown in Supplementary Table S1 ) were synthesized and respectively cloned into pEGFP-N1 vector used for flow cytometry. The ectodomains of the 26 ACE2s fused with the Fc domain of mouse IgG (mFc) were individually cloned into pCAGGS vector using Eco RI and Xho I restriction sites used for SPR. The pFastBac plasmids expressing SARS-CoV-2 RBD (residues 319–541, GISAID: EPI_ISL_402119), SARS-CoV-2 NTD (residues 20–286, GISAID: EPI_ISL_402119) and SARS-CoV RBD (residues 306–527, GenBank: NC_004718 ) used for both flow cytometry and SPR were constructed in our previous work 24 . The coding sequence of cACE2 (residues 18–740) was synthesized and cloned into pET21a vector (pET21a-cACE2) used for protein expression and purification. Protein expression and purification The SARS-CoV-2 RBD, SARS-CoV-2 NTD, and SARS-CoV RBD proteins used for flow cytometry and SPR experiments were expressed and purified using Bac-to-Bac baculovirus expression system (Invitrogen) as described in our previous work 24 . To prepare the mFc-tagged ACE2 proteins, the pCAGGS plasmids containing the coding sequences of ACE2s were transiently transfected into HEK293T cells. 48 h later, supernatant containing the indicated protein were collected, concentrated and then used for SPR assays. The pET21a-cACE2 was transformed into Escherichia coli ( E. coli ) strain BL21 (DE3) for protein expression. cACE2 was over expressed in E. coli as inclusion bodies and refolded as previously 37 . Briefly, the dissolved cACE2 inclusion bodies were diluted dropwise in a refolding buffer (100 mM Tris-HCl, pH 8.0, 2 mM EDTA, 400 mM L-arginine, 0.5 mM oxidized glutathione and 5 mM reduced glutathione) at 4 °C overnight. The refolded cACE2 proteins were concentrated using an Amicon 8400 concentrator with 10 kDa cutoff membrane and changed into 20 mM Tris-HCl (pH 8.0) and 150 mM NaCl buffer and subsequently purified by gel-filtration chromatography with a HiLoad 16/600 SuperdexTM 200 pg column (GE Healthcare) using ÄKTA System. To obtain the cACE2 and SARS-CoV-2 RBD complex, purified cACE2 and SARS-CoV-2 RBD proteins were mixed in a 1:2 molar ratio and incubated for 1 h on ice. The mixture was then purified with a HiLoad 16/600 SuperdexTM 200 pg column (GE Healthcare) in 20 mM Tris-HCl (pH 8.0) and 150 mM NaCl buffer. The complex peak of the cACE2 with the SARS-CoV-2 RBD was collected and concentrated to ~0.2 mg/mL for cryo-EM.
Flow cytometry analysis
To test the binding between the ACE2s and SARS-CoV-2 RBD or SARS-CoV RBD, the 27 ACE2s fused with eGFP were expressed on the cell surface by transfecting each of the 27 pEGFP-N1-ACE2s plasmids into HEK293T cells using PEI (Alfa). In total, 6 h later, the cell culture was replaced with fresh DMEM with 10% FBS (Gibco). In total, 24 h post transfection, 2 × 10⁵ cells were collected, resuspended in PBS and incubated with SARS-CoV-2 RBD, SARS-CoV RBD and SARS-CoV-2 NTD proteins at a concentration of 1 μg/mL at 37 °C for 30 min. Subsequently cells were washed twice with PBS and further stained with anti-His/APC antibody (1:500, Miltenyi Biotec) for another 30 min at 37 °C. After washing, the cells were analyzed using BD FACSCanto. The cells transfected with pEGFP-N1-hACE2 were used as positive control. To evaluate the binding between SARS-CoV-2 RBD and cACE2 (WT), hACE2 (WT) or mutants containing D355A, we expressed GFP-tagged cACE2, hACE2, or the mutants on the cell surface, and then stained the cells with His-tagged SARS-CoV-2 RBD protein. Anti-His/APC antibody was used to detect the His-tagged protein binding to the cells. The percentage of the indicated ACE2-expressing cells that were bound to SARS-CoV-2 RBD were shown as a histogram. The assays were independently performed twice. One representative data displayed in Fig. 4e was the mean of triplicates ( n = 3), and the bar represented the SD value.
SPR analysis
We tested the binding affinities between the mFc-tagged ACE2s and SARS-CoV-2 RBD or SARS-CoV RBD proteins by SPR using a BIAcore 8K (GE Healthcare) carried out at 25 °C in single-cycle mode. SARS-CoV-2 NTD protein was used as negative control. The HBS-EP buffer (20 mM HEPES, pH 7.4, 150 mM NaCl, and 0.005% (v/v) Tween 20) was used as the running buffer, and SARS-CoV-2 RBD, SARS-CoV RBD and SARS-CoV-2 NTD proteins were changed into this buffer by gel filtration before use. First, the anti-mFc antibodies were immobilized on the CM5 biosensor chip (GE Healthcare) using amine-coupling chemistry protocol (GE Healthcare). Then, the supernatants containing mFc-tagged ACE2s were injected and captured respectively at ~100–700 response units. SARS-CoV-2 RBD, SARS-CoV RBD or SARS-CoV-2 NTD protein was serially diluted and flowed through the chip surface and the binding response was measured. Briefly, 100, 50, 25, 12.5, and 6.25 nM of SARS-CoV-2 RBD, SARS-CoV RBD, or SARS-CoV-2 NTD protein were used to test the binding to dog or pig ACE2. 200, 100, 50, 25, and 12.5 nM of SARS-CoV-2 RBD, SARS-CoV RBD or SARS-CoV-2 NTD protein were used to guinea pig, civet, greater horseshoe bat, Chinese horseshoe bat, least horseshoe bat, goat, fox, European hedgehog, lesser hedgehog tenrec, or chicken ACE2. In total, 400, 200, 100, 50, and 25 nM of SARS-CoV-2 RBD, SARS-CoV RBD or SARS-CoV-2 NTD protein were used to monkey, mouse, rat, cat, bovine, horse, sheep, rabbit, raccoon dog, or hACE2. In total, 800, 400, 200, 100, and 50 nM of SARS-CoV-2 RBD, SARS-CoV RBD, or SARS-CoV-2 NTD protein were used to Malayan pangolin, wild Bactrian camel or alpaca ACE2. In total, 1600, 800, 400, 200, and 100 nM of SARS-CoV-2 RBD, SARS-CoV RBD or SARS-CoV-2 NTD protein were used to little brown bat or fulvous fruit bat ACE2. The anti-mFc antibody was regenerated with 10 mM Glycine-HCl (pH 1.7). The equilibrium dissociation constants ( K D ) of each pair of interaction were calculated using BIAcore ® 8K Evaluation Software (GE Healthcare) by fitting to a 1:1 Langmuir binding model. The supernatant containing hACE2-mFc protein was used as positive control. Pseudovirus transduction Pseudotyped SARS-CoV-2 particles were obtained from National Institutes for Food and Drug Control of China. Pseudotyped SARS-CoV particles were produced in HEK293T cells as previously described 38 . In brief, cells were co-transfected with pNL4-3.luc.R-E- and pCAGGS-SARS-CoV-S plasmids with a 1:2 ratio. In total, 6 h later, the cell culture was replaced with fresh DMEM. In total, 48 h later, the supernatant containing the pseudotyped SARS-CoV were harvested, aliquoted and stored at −80 °C until use. BHK21 cells were transfected with each of the 27 pEGFP-N1-ACE2s plasmids. 24 h later, eGFP-positive cells were sorted, reseeded in 96-well plates at 4 × 10 4 cells/well and cultivated for another 24 h. The BHK21 cells were washed with PBS before the addition of the supernatant containing pseudovirus particles. Cells were lysed using the lysis buffer in the Luciferase Assay Systems (Promega) at 24 h post infection. In total, 10 μL of lysis supernatant was reacted with 50 μL of luciferase assay substrate and the luciferase activity was determined using a GloMax 96 Microplate luminometer (Promega). The BHK21 cells transfected with pEGFP-N1-hACE2 were used as positive control. Cryo-EM sample preparation, data collection, image processing, and model fitting The complex protein of the cACE2 and the SARS-CoV-2 RBD (~0.2 mg/mL) was placed on a glow-discharged home-made graphene grid (Quantifiol Au 1.2/1.3, 300 mesh), stood for 10 s, blotted for 0.5 s with filter paper, and then the grid was plunged into liquid ethane using a FEI Vitrobot Mark IV. The cryo-specimens were loaded on a 300 kV Titan Krios transmission electron microscope equipped with a GIF-Quantum energy filter and a Gatan K3 direct electron detector. Images were captured after 1.68 s exposure at a normal magnification of 130k and an electron dose rate of ~12.9 e − pixel −1 s −1 using the counting mode, which resulted in a total dose of ~50 e − Å −2 fractionated into 32 movie frames. The final defocus range of the datasets was roughly −1.8 to −2.2 μm. The raw dose-fractionated images stacks were 3× Fourier binned, aligned, dose-weighted and summed using MotionCor2 39 . The initial contrast transfer function (CTF) parameters were estimated with CTFFIND4 40 . Then, 1551 good micrographs were manually selected from 1748 raw micrographs based on the Thon ring. All of the subsequent image processing and reconstruction were performed using Relion-3.1 41 . Briefly, a set of ~5000 particles was manually picked and subjected to 2D classification to generate templates for reference-based particle picking. A total of 1,500,357 automatically picked particles were extracted with a box size of 160 pixels and rescaled to 80 pixels in Relion-3.1 for the following 2D and 3D classification. One round of reference-free 2D classification was performed to remove the heterogeneous particles. A clean dataset with 837,848 particles from good 2D classes was selected and subjected to a second round 3D classification. After the second round of 3D classification, the predominant class containing a subset of 195,370 best particles shows the best structural features and the highest accuracy of particle alignment. The coordinates of these particles were exported in order to extract the full-size images for final reconstruction. The resulting density map at a resolution of 3 Å was determined by the Fourier shell correlation with a cutoff value of 0.143. For the model of the cACE2 and SARS-CoV-2 RBD complex, the atomic model of hACE2 with the SARS-CoV-2 RBD (PBD 6LZG) was fit into the electron density map using Chimera 42 . The initial structure model was refined against the cryo-EM density map in real space using Phenix 43 with secondary structure restraints. Automatic real-space and reciprocal-space refinements were performed using COOT 44 , and the stereochemical quality of the final model was assessed by MolProbity 45 .
Supplementary information Supplementary Information
📊 Figures
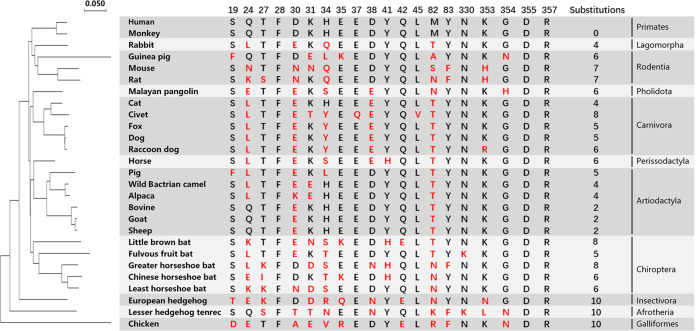
Fig. 1
Phylogenetic analysis of 26 animals based on ACE2 and characteristics of the SARS-CoV-2 RBD-binding residues of ACE2s.
Phylogenetic tree based on ACE2 amino acid sequences was generated using MEGA X. The 27 species (including human) belonging to 11 orders are shown in the right column. 20 residues of hACE2 which are c...
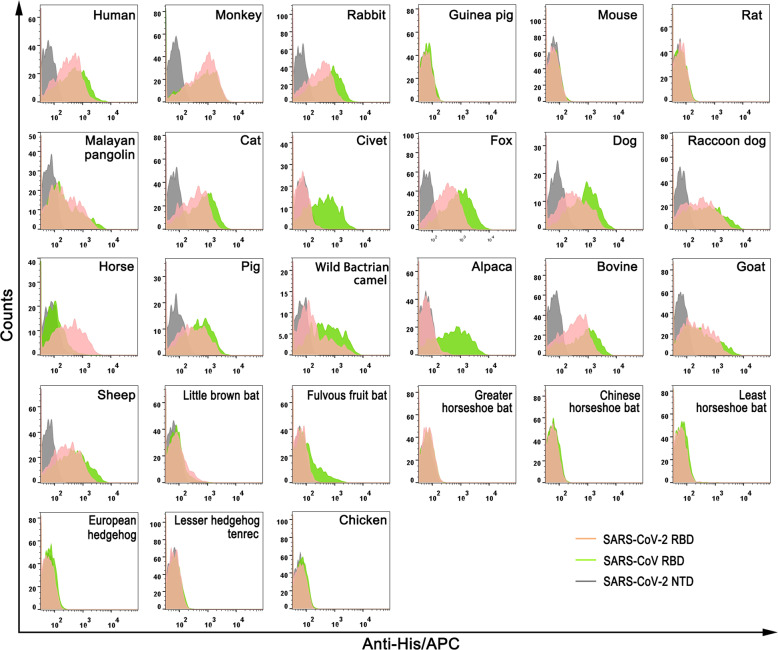
Fig. 2
Flow cytometric characterization of the binding between ACE2s and SARS-CoV-2 RBD or SARS-CoV RBD.
His-tagged SARS-CoV-2 RBD, SARS-CoV RBD and SARS-CoV-2 NTD proteins were incubated with HEK293T cells expressing eGFP-tagged ACE2s, respectively. Anti-His/APC antibody was used to detect the His-tagge...
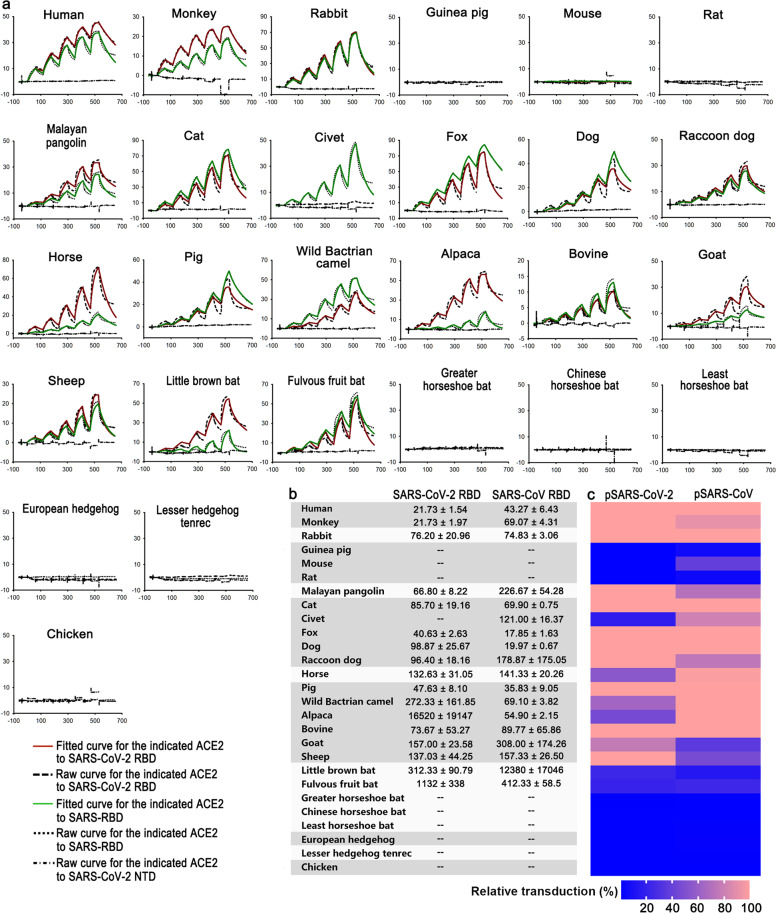
Fig. 3
SPR characterization of the binding between ACE2s and SARS-CoV-2 RBD or SARS-CoV RBD, and ACE2s mediated pseudoviruses transduction.
a The mFc-tagged ACE2s in supernatants were captured by anti-mIgG Fc antibodies immobilized on the CM5 chip, and sequentially tested the binding with serially diluted SARS-CoV-2 RBD or SARS-CoV RBD. T...
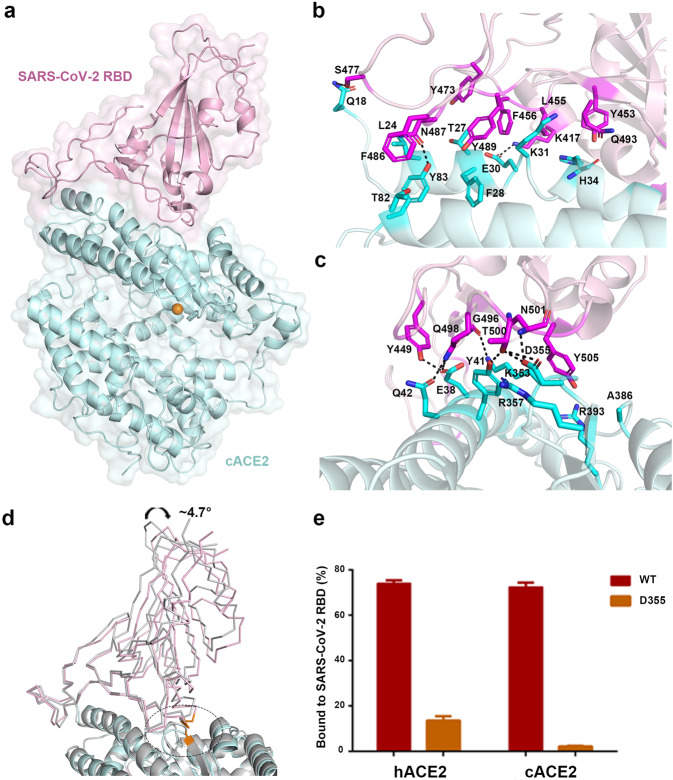
Fig. 4
The complex structure between cACE2 and SARS-CoV-2 RBD.
a The overall complex structure of cACE2 bound to SARS-CoV-2 RBD. cACE2 and SARS-CoV-2 RBD were colored in lightpink and palecyan, respectively. b , c The detailed interaction between cACE2 and the SA...
Figure images are served from the NIH/NLM PubMed Central Open Access Subset or Europe PMC; copyright remains with the publishers and authors.
💬 Discussion
0 commentsNo comments yet. Be the first to start a discussion!
Leave a Comment