Abstract
RATIONALE: Cardiomyocytes generated from human induced pluripotent stem cells (hiPSCs) are suggested as the most promising candidate to replenish cardiomyocyte loss in regenerative medicine. Little is known about their calcium homeostasis, the key process underlying excitation-contraction coupling. OBJECTIVE: We investigated the calcium handling properties of hiPSC-derived cardiomyocytes and compared with those from human embryonic stem cells (hESCs). METHODS AND RESULTS: We differentiated cardiomyocytes from hiPSCs (IMR90 and KS1) and hESCs (H7 and HES3) with established protocols. Beating outgrowths from embryoid bodies were typically observed 2 weeks after induction. Cells in these outgrowths were stained positively for tropomyosin and sarcomeric alpha-actinin. Reverse-transcription polymerase chain reaction studies demonstrated the expressions of cardiac-specific markers in both hiPSC- and hESC-derived cardiomyocytes. Calcium handling properties of 20-day-old hiPSC- and hESC-derived cardiomyocytes were investigated using fluorescence confocal microscopy. Compared with hESC-derived cardiomyocytes, spontaneous calcium transients from both lines of hiPSC-derived cardiomyocytes were of significantly smaller amplitude and with slower maximal upstroke velocity. Better caffeine-induced calcium handling kinetics in hESC-CMs indicates a higher sacroplasmic recticulum calcium store. Furthermore, in contrast with hESC-derived cardiomyocytes, ryanodine did not reduce the amplitudes, maximal upstroke and decay velocity of calcium transients of hiPSC-derived cardiomyocytes. In addition, spatial inhomogeneity in temporal properties of calcium transients across the width of cardiomyocytes was more pronounced in hiPSC-derived cardiomyocytes than their hESC counterpart as revealed line-scan calcium imaging. Expressions of the key calcium-handling proteins including ryanodine recptor-2 (RyR2), sacroplasmic recticulum calcium-ATPase (SERCA), junction (Jun) and triadin (TRDN), were significantly lower in hiPSC than in hESCs. CONCLUSIONS: The results indicate the calcium handling properties of hiPSC-derived cardiomyocytes are relatively immature to hESC counterparts.
🔬 Techniques
💻 Software
✨ Fluorophores
🧪 Sample Preparation
🔬 Cell Lines
🏭 Microscope Brands
🧪 Reagent Suppliers
💻 Software Details
🏛️ Research Organizations (ROR)
Affiliated research institutions:
📋 Methods
Methods and Results We differentiated cardiomyocytes from hiPSCs (IMR90 and KS1) and hESCs (H7 and HES3) with established protocols. Beating outgrowths from embryoid bodies were typically observed 2 weeks after induction. Cells in these outgrowths were stained positively for tropomyosin and sarcomeric alpha-actinin. Reverse-transcription polymerase chain reaction studies demonstrated the expressions of cardiac-specific markers in both hiPSC- and hESC-derived cardiomyocytes. Calcium handling properties of 20-day-old hiPSC- and hESC-derived cardiomyocytes were investigated using fluorescence confocal microscopy. Compared with hESC-derived cardiomyocytes, spontaneous calcium transients from both lines of hiPSC-derived cardiomyocytes were of significantly smaller amplitude and with slower maximal upstroke velocity. Better caffeine-induced calcium handling kinetics in hESC-CMs indicates a higher sacroplasmic recticulum calcium store. Furthermore, in contrast with hESC-derived cardiomyocytes, ryanodine did not reduce the amplitudes, maximal upstroke and decay velocity of calcium transients of hiPSC-derived cardiomyocytes. In addition, spatial inhomogeneity in temporal properties of calcium transients across the width of cardiomyocytes was more pronounced in hiPSC-derived cardiomyocytes than their hESC counterpart as revealed line-scan calcium imaging. Expressions of the key calcium-handling proteins including ryanodine recptor-2 (RyR2), sacroplasmic recticulum calcium-ATPase (SERCA), junction (Jun) and triadin (TRDN), were significantly lower in hiPSC than in hESCs.
Show full methods section
Methods and Results We differentiated cardiomyocytes from hiPSCs (IMR90 and KS1) and hESCs (H7 and HES3) with established protocols. Beating outgrowths from embryoid bodies were typically observed 2 weeks after induction. Cells in these outgrowths were stained positively for tropomyosin and sarcomeric alpha-actinin. Reverse-transcription polymerase chain reaction studies demonstrated the expressions of cardiac-specific markers in both hiPSC- and hESC-derived cardiomyocytes. Calcium handling properties of 20-day-old hiPSC- and hESC-derived cardiomyocytes were investigated using fluorescence confocal microscopy. Compared with hESC-derived cardiomyocytes, spontaneous calcium transients from both lines of hiPSC-derived cardiomyocytes were of significantly smaller amplitude and with slower maximal upstroke velocity. Better caffeine-induced calcium handling kinetics in hESC-CMs indicates a higher sacroplasmic recticulum calcium store. Furthermore, in contrast with hESC-derived cardiomyocytes, ryanodine did not reduce the amplitudes, maximal upstroke and decay velocity of calcium transients of hiPSC-derived cardiomyocytes. In addition, spatial inhomogeneity in temporal properties of calcium transients across the width of cardiomyocytes was more pronounced in hiPSC-derived cardiomyocytes than their hESC counterpart as revealed line-scan calcium imaging. Expressions of the key calcium-handling proteins including ryanodine recptor-2 (RyR2), sacroplasmic recticulum calcium-ATPase (SERCA), junction (Jun) and triadin (TRDN), were significantly lower in hiPSC than in hESCs.
Electronic supplementary material The online version of this article (doi:10.1007/s12015-011-9273-3) contains supplementary material, which is available to authorized users.
Methods hiPSC and hESC Culture and Cardiac Differentiation
We used hiPSC line, IMR90-iPSCs (iPS (IMR90)-1, clone 1, WiCell) (WiCell Research Institute, Madison, Wisconsin), KS1-iPSCs as generated by our group in feeder-free condition [ 19 ], and human embryonic stem cell (hESC) line H7- and HES3-hESCs (National Institutes of Health, NIH code WA07 & ES03 respectively) (WiCell Research Institute, Madison, Wisconsin) for these following experiments. Undifferentiated cells were cultured on Matrigel™ (BD Biosciences, MA)-coated dishes with mTeSR™ medium (Stem Cell Technologies, BC, Canada). Cardiac differentiation was performed according to a published protocol [ 20 ]. Briefly, cells were dissociated into clumps using 1 mg/ml Dispase (Invitrogen, CA, USA) and cultured in suspension using low attachment plates to form embryoid bodies. The embryoid bodies were transferred onto gelatin-coated plates in StemPro®-34 medium (Invitrogen, CA, USA) supplemented with 2 mM glutamine (Gibco, CA, USA), 4 mM monothioglycerol (Sigma-Aldrich, St. Louis, MO), 50 μg/ml ascorbic acid (Sigma-Aldrich, St. Louis, MO) and 0.5 ng/ml BMP4 (R&D). In addition, the medium was further supplemented with various cytokines according to the following sequence: post-plating day 1 to 4, 10 ng/ml BMP4, 5 ng/ml bFGF, and 3 ng/ml activin A (Stemgent, CA, USA); post-plating day 4 to 8, 150 ng/ml DKK1 (Gibco BRL, Karlsruhe, Germany) and 10 ng/ml VEGF; and after day 8, 150 ng/ml DKK1, 10 ng/ml VEGF (Peprotech, NJ, USA), and 5 ng/ml bFGF (Peprotech, NJ, USA).
Isolation of hiPSC- and hESC-derived Cardiomyocytes
Differentiated hiPSC- and hESC-embryoid bodies containing beating outgrowths were micro-surgically dissected using a glass knife on post-plating day 21 as previously described [ 14 , 21 – 23 ]. Beating cells were dissociated in medium containing 1 mg/ml collagenase B and 60 U/ml DNase I (Roche Applied Sciences Penzberg, Germany) at 37°C for 30 min and were re-suspended in Kraftbrühe (KB) solution containing 85 mM KCl, 30 mM K 2 HPO 4 , 5 mM MgSO 4 , 1 mM EGTA, 2 mM Na 2 -ATP, 5 mM pyruvic acid, 5 mM creatine, 20 mM taurine, and 20 mM D-glucose at room temperature for 1 h. Cells were then plated onto 0.1% gelatin-coated glass coverslips and maintained with culture medium. Measurement of Cytosolic [Ca 2+ ] Cytosolic calcium transients were estimated in isolated cells using a confocal imaging system (Olympus Fluoview System version 4.2 FV300 TIEMPO) mounted on an upright Olympus microscope (IX71) as previously described [ 14 , 16 , 17 , 24 , 25 ]. Briefly, cells were loaded with 1:1 ( v / v ) amount of 20% Pluronic®-F127 (Invitrogen, life technologies) and 5 μM Fluo-3 AM (Sigma-Aldrich, St. Louis, MO) dissolved in DMSO with stock concentration of 5 mM for 45 min at 37°C in Tyrode solution containing 140 mM NaCl, 5 mM KCl, 1 mM MgCl 2 , 1.8 mM CaCl 2 , 10 mM glucose and 10 mM HEPES at pH 7.4 [ 14 ]. Calcium transients of single cardiomyocytes were recorded with a temporal resolution of the line scan at 274 frames per second. Sacroplasmic reticular (SR) calcium load was estimated from peak calcium release after the addition of caffeine (10 mM). All confocal calcium imaging experiments were performed within 48 h after isolation in order to minimize contamination of time-dependent changes in calcium handling property in culture. Raw data of fluorescence intensity was recorded by area vs. time mode (XYT) as a line plot, the calibration curve showed that there is linear relationship between fluo-3 intensity recorded with calcium concentration up to 630 nM [Ca 2+ ]. Regarding to line scan images, they are recorded in line vs. time mode (XT). The data were then quantified as the background subtracted fluorescence intensity changes normalized to the background subtracted baseline fluorescence using Image J. Amplitudes, maximal upstroke and decay velocity of calcium transient were analyzed by Clampfit version 9.2.0.09. (Axon Instruments, Inc, Foster City, CA). Reverse Transcription Polymerase Chain Reaction (RT-PCR) Total RNA from 2-week old hiPSC- and hESC-embryoid bodies was extracted with illustra RNAspin Mini kit (GE Healthcare, Buckinghamshire, UK). Reverse transcription was then performed using 0.5 μg RNA in a final volume of 20 μl, using QuantiTect® reverse transcription kit (Qiagen, Hilden, Germany, http://www1.qiagen.com ) according to the manufacturer’s instructions. Details of a panel of cardiac-specific genes and calcium handling protein genes are summarized in Table 1 . Quantitative PCR analysis was performed with real-time PCR Detector (Opticon 2 DNA Engine, MJ Research, Minnesota, USA) using the iQ SYBR Green Supermix (Bio-Rad Laboratories, Hercules, CA). For amplification, after initial holds for 5 min at 95°C, 50 cycles of 95°C for 15 s followed by corresponding annealing temperature for 30 s and 72°C for 30 s, melt curve analysis was performed. The relative quantification of PCR products was performed according to the documentclass[12pt]{minimal} usepackage{amsmath} usepackage{wasysym} usepackage{amsfonts} usepackage{amssymb} usepackage{amsbsy} usepackage{mathrsfs} usepackage{upgreek} setlength{oddsidemargin}{-69pt} begin{document}$$ {{2}^{{ - Delta Delta {text{Ct}}}}} $$end{document} method, using mouse GAPDH as internal control. Where documentclass[12pt]{minimal} usepackage{amsmath} usepackage{wasysym} usepackage{amsfonts} usepackage{amssymb} usepackage{amsbsy} usepackage{mathrsfs} usepackage{upgreek} setlength{oddsidemargin}{-69pt} begin{document}$$ Delta Delta {text{Ct}} = [{({text{C}}{{text{t}}_{text{target gene}}} - {text{C}}{{text{t}}_{text{GAPDH}}})_{{{text{IMR9}}0 - {text{iPSgroup}}}}} - {({text{C}}{{text{t}}_{text{target gene}}} - {text{C}}{{text{t}}_{text{GAPDH}}})_{{{text{H7 hESgroup}}]}}}] $$end{document} . Table 1 Primers used for Real-time quantitative RT-PCR Gene Direction Sequence (5′ to 3′) Nkx2.5 Forward TTCCCGCCGCCCCCGCCTTCTAT Reverse CGCTCCGCGTTGTCCGCCTCTGT α-MHC Forward GTTGGTGTTGGCTTGCTCCTC Reverse ATCAAGGAGCTCACCTACCAG β-MHC Forward TGGGGCTTTGCTGGCACCTCC Reverse GCGGAGGAGCAAGCCAACACC NCX1 Forward TGTGCATCTCAGCAATGTCA Reverse TGATGCCAATGCTCTCACTC RYR2 Forward CGTTCTAACCAGCATCTCATC Reverse CGAGCAATACAACCTGACC SERCA2a Forward ACCCACATTCGAGTTGGAAG Reverse CAGTGGGTTGTCATGAGTGG CASQ2 Forward GAGCTTGTGGCCCAGGTCCT Reverse GATCTCCACTGGGTCTTCAA Junctin Forward GTAAAATGGCATCCCGAGAC Reverse GGATGATGATGCCAGAGC Triadin Forward TCAGTTGCTCCACACTGAGC Reverse CCCATTTACAGACGGGAAAC GAPDH Forward AGCCACATCGCTCAGACACC Reverse GTACTCAGCGCCAGCATCG Nkx2.5 NK2 transcription factor related, locus 5; α-MHC alpha-myosin heavy chain; β-MHC beta-myosin heavy chain; NCX1 sodium calcium exchanger-1; RyR2 ryanodine receptor 2; SERCA-2a sarcoplasmic reticulum calcium ATPase 2a; CASQ2 calsequestrin-2; GAPDH Glyceraldehyde 3-phosphate dehydrogenase Statistical Analysis Continuous variables are expressed as mean ± standard deviation. Statistical comparisons were performed using Student’s t test. Calculations were performed with SPSS (version 14.0). A p- value
📊 Figures
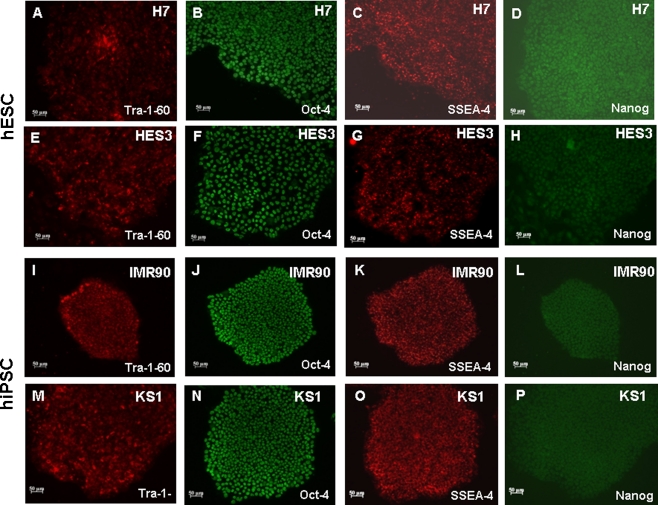
Fig.u00a01
Stem cell pluripotency markers expression in H7-, HES3-hESCs and IMR90-, KS1-hiPSCs. Tra-1-60 ( a , e , i & m ), Oct4 ( b , f , j & n ), SSEA-4 ( c , g , k & o ) and Nanog ( d , h , l & p ) and were e...
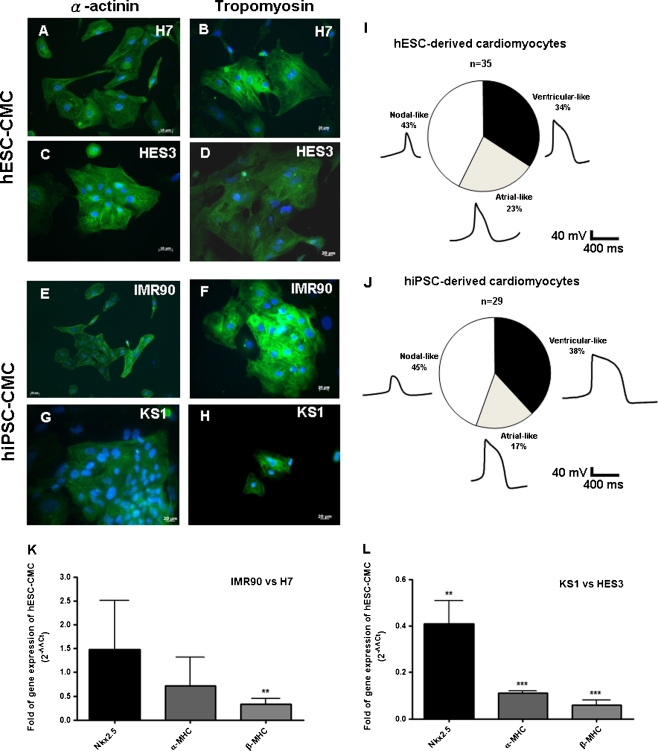
Fig.u00a02
Cardiomyocytes differentiated from H7-, HES3-hESCs and IMR90-, KS1-hiPSCs were stained with two typical cardiac markers, alpha-actinin ( a , c , e & g ) and tropomyosin ( b , d , f & h ). The proporti...
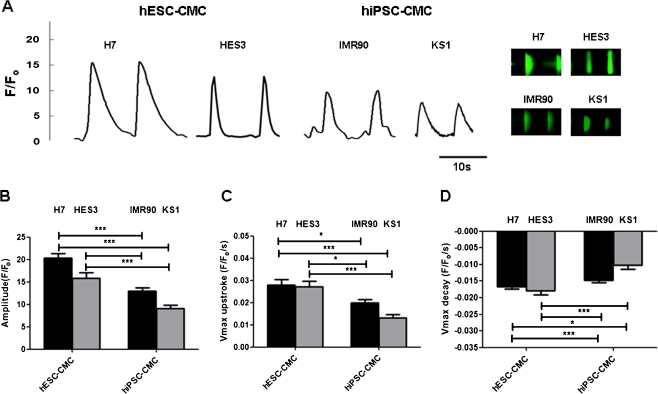
Fig.u00a03
Representative tracing of calcium transients and 2-D calcium transients in a H7 & HES3 hESC derived cardiomyocytes (H7 & HES3 hESC-CMCs), IMR90 & KS1 hiPSC derived cardiomyocytes (IMR90 & KS1 hiPSC-CM...
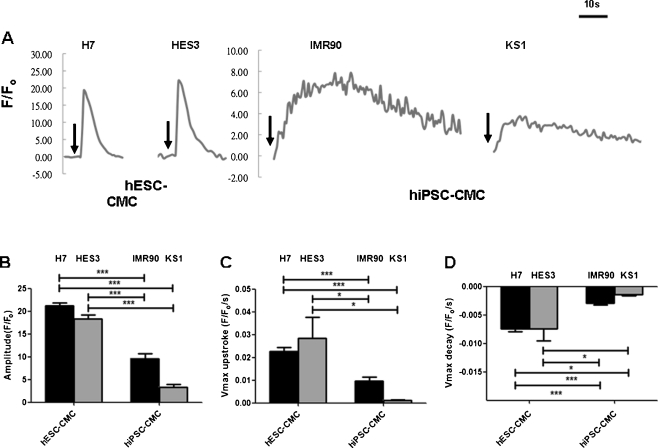
Fig.u00a04
Representative tracing of caffeine-induced calcium release in a H7- & HES3-hESC derived cardiomyocytes (H7 & HES3 hESC-CMCs), IMR90- & KS1-hiPS derived cardiomyocytes (IMR90 & KS1 hiPSC-CMCs). b Ampli...
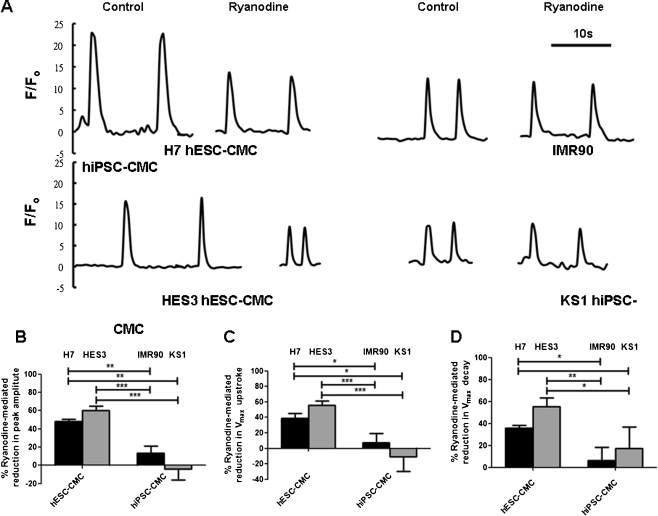
Fig.u00a05
Representative tracing of ryanodine sensitive calcium release in a H7- & HES3-hES derived cardiomyocytes (H7- & HES3-hES CMCs) and IMR90- & KS1-hiPSC-derived cardiomyocytes (IMR90- & KS1-hiPS CMCs). b...
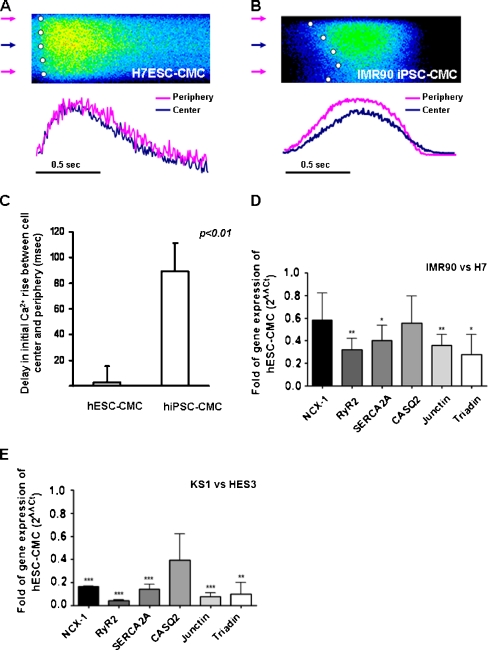
Fig.u00a06
Transverse line-scan confocal of hiPSC- and hESC-derived cardiomyocytes. Representative tracings of temporal and spatial patterns of calcium transients of hiPSC-derived cardiomyocytes ( a ) and b hESC...
Figure images are served from the NIH/NLM PubMed Central Open Access Subset or Europe PMC; copyright remains with the publishers and authors.
💬 Discussion
0 commentsNo comments yet. Be the first to start a discussion!
Leave a Comment