Abstract
Abstract Nsp15 is a uridine specific endoribonuclease that coronaviruses employ to cleave viral RNA and evade host immune defense systems. Previous structures of Nsp15 from across Coronaviridae revealed that Nsp15 assembles into a homo-hexamer and has a conserved active site similar to RNase A. Beyond a preference for cleaving RNA 3′ of uridines, it is unknown if Nsp15 has any additional substrate preferences. Here, we used cryo-EM to capture structures of Nsp15 bound to RNA in pre- and post-cleavage states. The structures along with molecular dynamics and biochemical assays revealed critical residues involved in substrate specificity, nuclease activity, and oligomerization. Moreover, we determined how the sequence of the RNA substrate dictates cleavage and found that outside of polyU tracts, Nsp15 has a strong preference for purines 3′ of the cleaved uridine. This work advances our understanding of how Nsp15 recognizes and processes viral RNA, and will aid in the development of new anti-viral therapeutics.
🔬 Techniques
🧬 Organisms
✨ Fluorophores
🔬 Cell Lines
🏭 Microscope Brands
🧪 Reagent Suppliers
📷 Detectors
💻 Software Details
💾 Data Repositories
🏛️ Research Organizations (ROR)
Affiliated research institutions:
📋 Methods
Protein expression and purification
Wild type (WT) and mutant Nsp15 constructs were created as described previously ( 20 ). Nsp15 was overexpressed in Escherichia coli C41 (DE3) competent cells in Terrific Broth with 100 mg/L ampicillin. At an optical density (600 nm) between 0.8 and 1.0, cultures were cooled at 4°C for 1 h prior to induction with 0.2 mM Isopropyl β- d -1-thiogalactopyranoside (IPTG). Cells were harvested after overnight expression at 16°C and stored at −80°C until use. Nsp15 purification was done as described previously ( 20 ). Briefly, cells were resuspended in Lysis Buffer (50 mM Tris pH 8.0, 500 mM NaCl, 5% glycerol, 5 mM β-ME, 5 mM imidazole) supplemented with cOmplete EDTA-free protease inhibitor tablets (Roche) and disrupted by sonication. The lysate was clarified at 26 915 × g for 50 min at 4°C and then incubated with TALON metal affinity resin (Clontech). His-Nsp15 was eluted from the resin with 250 mM imidazole, and buffer exchanged into Thrombin Cleavage Buffer (50 mM Tris pH 8.0, 150 mM NaCl, 5% glycerol, 2 mM β-ME, 2 mM CaCl 2 ) for cleavage at room temperature for 3 h. The cleavage reaction was repassed over TALON resin and quenched with 1 mM phenylmethylsulfonyl fluoride (PMSF) prior to gel filtration using a Superdex-200 column equilibrated in SEC buffer (20 mM HEPES pH 7.5, 150 mM NaCl, 5 mM MnCl 2 , 5 mM β-ME).
Cryo-EM sample preparation Purified
Nsp15 was diluted in a low-salt buffer (20 mM HEPES pH 7.5, 100 mM NaCl, 5 mM MnCl 2 , 5 mM β-ME) to 0.75 μM and incubated with excess RNA substrates (1 mM AU f A or AUA, see Supplementary Table S1 ) for 1 h at 4°C. UltrAuFoil R1.2/1.3 300 mesh gold grids (Quantifoil) were plasma cleaned (Pie Scientific) before use. The Nsp15/RNA mixture (3 μl) was deposited onto the grids, back-blotted for 3 seconds, and vitrified using an Automatic Plunge Freezer (Leica).
Show full methods section
Protein expression and purification
Wild type (WT) and mutant Nsp15 constructs were created as described previously ( 20 ). Nsp15 was overexpressed in Escherichia coli C41 (DE3) competent cells in Terrific Broth with 100 mg/L ampicillin. At an optical density (600 nm) between 0.8 and 1.0, cultures were cooled at 4°C for 1 h prior to induction with 0.2 mM Isopropyl β- d -1-thiogalactopyranoside (IPTG). Cells were harvested after overnight expression at 16°C and stored at −80°C until use. Nsp15 purification was done as described previously ( 20 ). Briefly, cells were resuspended in Lysis Buffer (50 mM Tris pH 8.0, 500 mM NaCl, 5% glycerol, 5 mM β-ME, 5 mM imidazole) supplemented with cOmplete EDTA-free protease inhibitor tablets (Roche) and disrupted by sonication. The lysate was clarified at 26 915 × g for 50 min at 4°C and then incubated with TALON metal affinity resin (Clontech). His-Nsp15 was eluted from the resin with 250 mM imidazole, and buffer exchanged into Thrombin Cleavage Buffer (50 mM Tris pH 8.0, 150 mM NaCl, 5% glycerol, 2 mM β-ME, 2 mM CaCl 2 ) for cleavage at room temperature for 3 h. The cleavage reaction was repassed over TALON resin and quenched with 1 mM phenylmethylsulfonyl fluoride (PMSF) prior to gel filtration using a Superdex-200 column equilibrated in SEC buffer (20 mM HEPES pH 7.5, 150 mM NaCl, 5 mM MnCl 2 , 5 mM β-ME).
Cryo-EM sample preparation Purified
Nsp15 was diluted in a low-salt buffer (20 mM HEPES pH 7.5, 100 mM NaCl, 5 mM MnCl 2 , 5 mM β-ME) to 0.75 μM and incubated with excess RNA substrates (1 mM AU f A or AUA, see Supplementary Table S1 ) for 1 h at 4°C. UltrAuFoil R1.2/1.3 300 mesh gold grids (Quantifoil) were plasma cleaned (Pie Scientific) before use. The Nsp15/RNA mixture (3 μl) was deposited onto the grids, back-blotted for 3 seconds, and vitrified using an Automatic Plunge Freezer (Leica).
Data collection and processing
Nsp15 images were collected using a Krios electron microscope at 300 keV with a Gatan K2 detector in super-resolution mode. Beam-induced motion and drift were corrected using MotionCor2 ( 24 ) and aligned dose-weighted images were used to calculate CTF parameters using CTFFIND4 ( 25 ). CryoSPARC v2 ( 26 ) was used in all subsequent image processing. Particles were selected by template-based particle picking, downsampled by a factor of 4, extracted with a box size of 64 and subjected to an initial round of 2D classification. Full resolution particle projections from good classes were re-extracted using a box size of 256. Ab initio reconstruction was used to generate initial models; upon further inspection, there were no significant differences between the classes, which had roughly equal numbers of particles. Thus, the classes were grouped for further refinement in favor of better resolution. Three independent 3D refinement cycles were performed while applying C1, C3 and D3 symmetry respectively. Although previous apo- and UTP-bound datasets had D3 symmetry, the longer RNA bound in both datasets here resulted in particles that no longer had D3 symmetry, perhaps due to incomplete or mixed occupancy. Inspection of the C1 map did not reveal any asymmetric differences, although active site density was difficult to interpret for one half of the pre-cleavage state map. Therefore, C3 symmetry was used for model building and analysis for both datasets. Maps were re-scaled to optimize RMS fit to core domain residues of reference structure PDBID 6WLC ( 21 ). Model building A SARS-CoV-2 Nsp15 crystal structure (PDBID 6WLC) was used as a starting model and fit into the cryo-EM maps using rigid body docking in Phenix ( 27 ). For the pre-cleavage state, which was captured with an AU f A tri-nucleotide, the density for the 5′ A was weaker than the density for the U, so only the C5′ group was modeled; no density was observed for the 3′ A. For the post-cleavage state, the 5′ A could be fit in the density along with the U. A combination of rigid body and real-space refinement in Phenix as well as iterative rounds of building in COOT ( 28 ) were used to improve the fit of the model. Molprobity ( 29 ) was used to evaluate the model (Table 1 ). Figures were prepared using Chimera ( 30 ) and Chimera X ( 31 ). Table 1. Cryo-EM collection and processing statistics for the pre-cleavage and post-cleavage structures Data collection and processing Pre-cleavage state (EMBD-24137, PDBID: 7N33) Post-cleavage state (EMBD-24101 PDBID: 7N06) Microscope Titan Krios Titan Krios Detector Gatan K2 Gatan K2 Nominal magnification 165000x 165000x Voltage (kV) 300 300 Electron exposure (e – /Å 2 ) 54 54 Defocus range (μm) −0.8 to −1.8 −0.8 to −1.8 Pixel size (Å) 0.4125 0 .4125 Symmetry imposed C3 C3 Number of micrographs 2563 3454 Initial particle images 944 302 1 592 506 Final particle images 383 275 1 058 228 Map resolution (Å)/FSC threshold 2.5/0.143 2.2/0.143 Refinement Resolution (Å) 2.5 2.2 B -factor used for map sharpening (Å 2 ) 115.5 94.5 Map to model CC CC (mask) 0.87 0.88 CC (volume) 0.85 0.86 CC (peaks) 0.77 0.82 CC (box) 0.82 0.83 Model composition Non-hydrogen atoms 16 524 17 223 Protein residues 2076 2082 Nucleic acid 12 18 Mean B factors ( Å 2 ) Protein 53.45 33.82 Nucleic acid 74.64 49.73 R.m.s . deviations Bond lengths (Å) 0.005 0.007 Bond angles (°) 0.574 0.629 Validation Molprobity score 1.66 1.48 Clashscore 3.98 3.28 Poor rotamers (%) 2.93 2.10 Ramachandran plot Favored (%) 97.38 97.39 Allowed (%) 2.62 2.46 Disallowed (%) 0 0.14 FRET endoribonuclease assay Nsp15 cleavage was monitored in real-time as described previously ( 19 , 20 ). Briefly, 6-mer substrates were labeled with 5′-fluorescein (FI) and 3′-TAMRA, where TAMRA quenches FI and cleavage is measured by increasing FI fluorescence (5′-FI-AAxxxA-TAMRA-3′; x nucleotides varied among substrates) (see Supplementary Table S1 ). The substrate (0.8 μM) was incubated with Nsp15 (2.5 nM) in RNA cleavage buffer (20 mM HEPES pH 7.5, 75 mM NaCl, 5 mM MnCl 2 , 5 mM DTT) at 25°C for 60 min. Fluorescence was measured every 2.5 min using a POLARstar Omega plate reader (BMG Labtech) set to excitation and emission wavelengths of 485 ± 12 and 520 nm, respectively. Three technical replicates were performed for each condition, and the assay was repeated with at least two independent protein preparations. Prism (Graphpad) was used to calculate significant differences using Dunnett's T3 multiple corrections test.
Urea-PAGE endoribonuclease assay
Double fluorescently-labeled RNA substrates (5′-FI and 3′-Cy5, 500 nM) were incubated with Nsp15 (50 nM) in RNA cleavage buffer (20 mM HEPES pH 7.5, 150 mM NaCl, 5 mM MnCl 2 , 5 mM DTT, 1 u/μl RNasin ribonuclease inhibitor) at room temperature for 30 min, with samples collected at 0, 1, 5, 10 and 30 min. The reaction was quenched with 2× urea loading buffer (8 M urea, 20 mM Tris pH 8.0, 1 mM EDTA). Due to the expected size of cleavage products and the size of bromophenol blue, loading buffer without dye was used. To monitor the gel front, a control lane of protein only with bromophenol blue was run. To generate a ladder, alkaline hydrolysis of the RNA was carried out for 15 min at 90°C using 1 μM RNA in alkaline hydrolysis buffer (50 mM sodium carbonate pH 9.2, 1 mM EDTA) and quenched with 2× urea loading buffer. The cleavage reactions were separated using 15–20% TBE-urea PAGE gels and visualized with a Typhoon RGB imager (Amersham) using Cy2 (λ ex = 488 nm, λ em = 515–535 nm) and Cy5 (λ ex = 635 nm, λ em = 655–685 nm) channels.
Mass spectrometry of RNA cleavage products
Mass spectrometry was performed as previously described ( 20 ). Briefly, the FRET RNA substrate of interest (0.8 μM) was incubated ± Nsp15 (2.5 nM) in RNA cleavage buffer for 30 min at RT. For mass spectrometry analysis, the reaction was chromatographically separated with a gradient of buffer A (400 mM hexafluoro-2-propanol, 3 mM triethylamine, pH 7.0) and buffer B (methanol).
Parallel reaction monitoring
(PRM) analyses were included in the MS analyses with included masses of m / z 914.14; 923.14; 1463.42.
Molecular dynamics simulations
Based on the RNA bound cryo-EM hexamer structure of Nsp15, the initial structure of Nsp15-AUA hexamer complex was prepared by manually introducing an adenine nucleotide at the B −2 position. Except for H250, all histidine residues were selected to be N ϵ protonated. Since the ring nitrogen atoms on H250 were found to make two strong hydrogen bonds with the phosphate backbone and the carbonyl oxygen of S294, H250 was assigned the positively charged doubly-protonated form. After introducing all protons using the TLeap module of Amber.18 ( 32 ), the Nsp15-AUA hexamer system was solvated in 68 849 water molecules, while 203 sodium ions and 125 chloride ions provided the 100 mM salt concentration and the charge neutralization. A separate Nsp15-AUA monomer system, isolated from the hexamer, was also subjected to molecular dynamics. The monomer assembly was solvated with 24 545 water molecules. There were 57 sodium ions and 44 chloride ions also in the monomer system. The hexamer system consisted of 240 229 atoms while the monomer system had 79 295 atoms. The boundaries of the water boxes were at least 15 Å away from any protein or RNA atoms. After proper equilibration of each system over 30 ns under various conditions, the CUDA implementation of the PMEMD module of Amber.18 with the amino acid represented by the FF14SB force field was used to simulate unconstrained dynamics for 500 ns for hexamer and monomer systems at 2 fs time step and 300 K under constant pressure. The Amber FF14 RNA force field was used for the ribonucleotide trimer. The particle mesh Ewald method was used in dealing with long range Coulomb and van der Waals interactions. For each system, two additional 500 ns simulations were performed. The starting structures of the additional runs were selected from the 30 and 40 ns conformations of the primary simulation with the randomized initial velocities to simulate alternate trajectories. The MMGBSA module of Amber.18 was implemented in free energy estimations with the selection of 0.15M salt concentration and the default parameters (IGB = 5) in the Amber module. Since the trinucleotide was not bound to the binding site residues during the entire half a microsecond production runs in most systems, the energy calculations were performed for each 50 ns segments (with 50 samples selected at each nanosecond) separately for each trajectory. When calculating the residues interaction energies, only the values from 50 ns segments with bound trinucleotides were selected.
Supplementary Material gkab719_Supplemental_Files Click here for additional data file.
📊 Figures
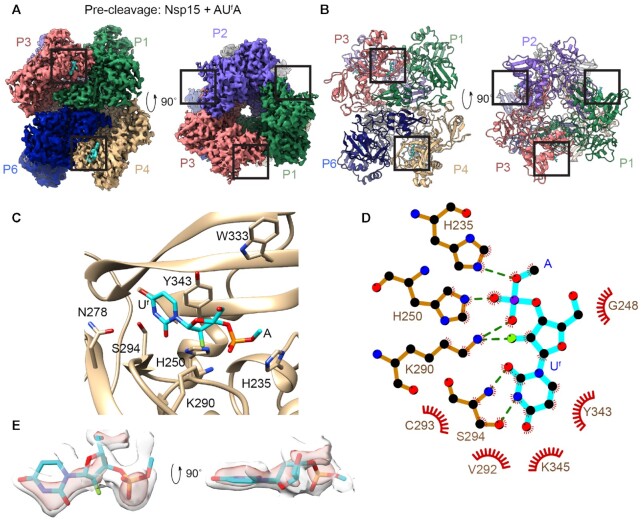
Figure 1.
Pre-cleavage cryo-EM structure (Nsp15u00a0+u00a0AU f A) shows the complete, uncut scissile bond. Side and top views of the cryo-EM map ( A ) and model ( B ). Protomers are colored and labeled. The act...
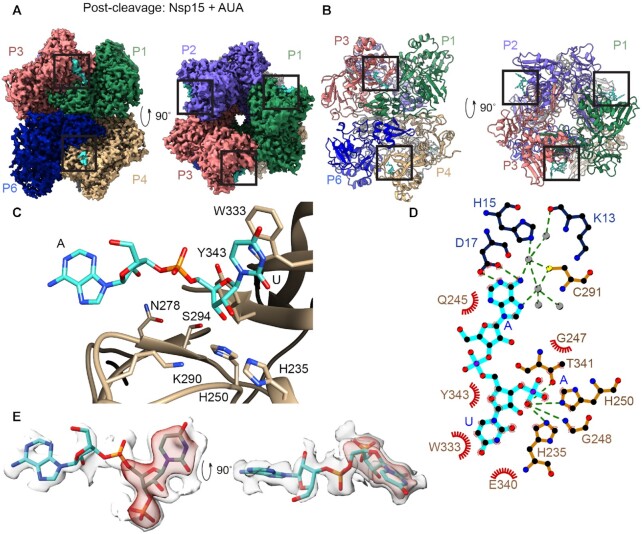
Figure 2.
Post-cleavage cryo-EM structure (Nsp15u00a0+u00a0AUA) reveals a change in U positioning. Side and top views of the cryo-EM map ( A ) and model ( B ). Protomers are colored and labeled. The active site...
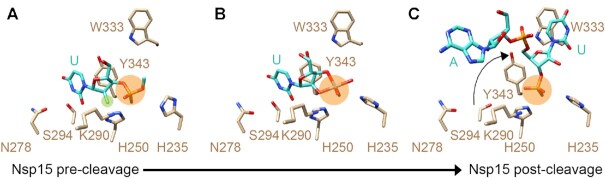
Figure 3.
Nsp15 structures across the complete reaction mechanism. In all panels, active site residues of interest are shown as tan sticks, the RNA as turquoise sticks, and the scissile phosphate highlighted in...
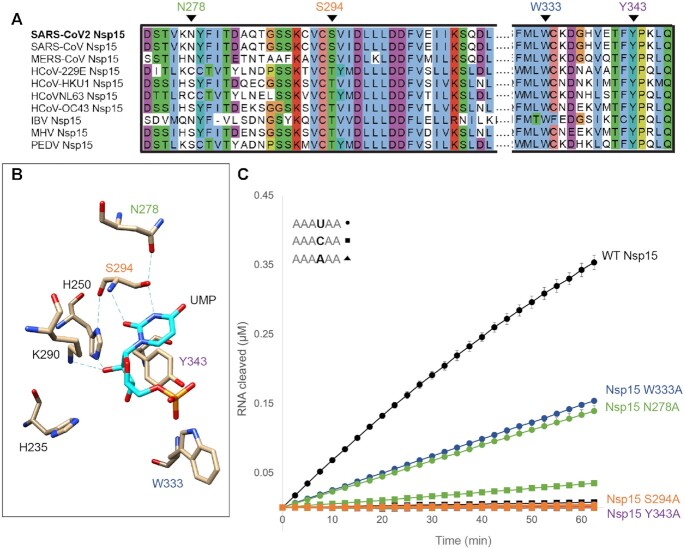
Figure 4.
Nsp15 active site mutants reveal roles of critical residues. ( A ) Sequence alignment for selected regions of the Nsp15 EndoU domain across human coronaviruses and several major animal coronaviruses. ...
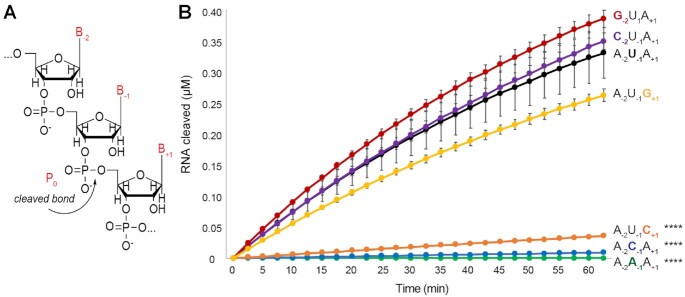
Figure 5.
Nsp15 RNA specificity identified by a FRET endoribonuclease assay reveals the importance of the B +1 position. ( A ) Illustrative RNA diagram highlighting the scissile phosphate bond (P 0 ), and defin...
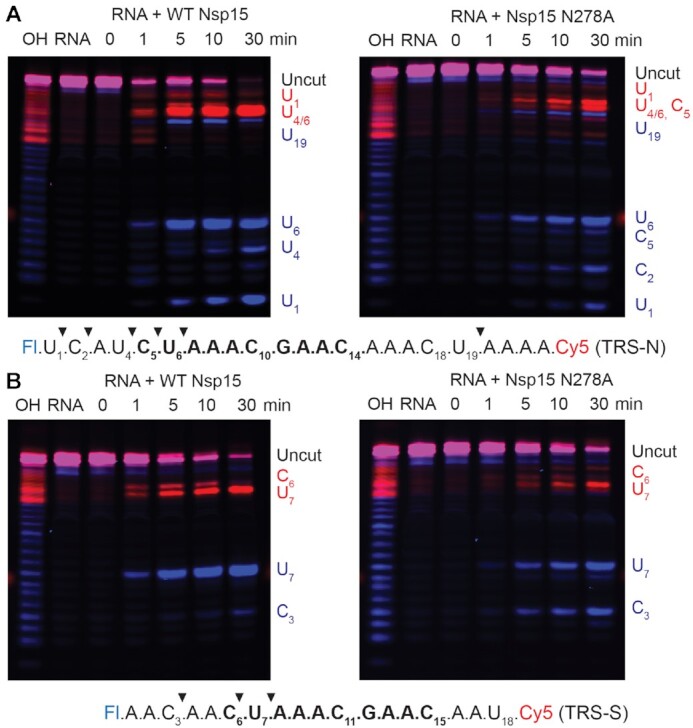
Figure 6.
Cleavage gels of biologically relevant TRS sequences show B +1 sequence preference. The sequence is shown below the gels with the conserved consensus sequence in bold and the labels colored to match t...
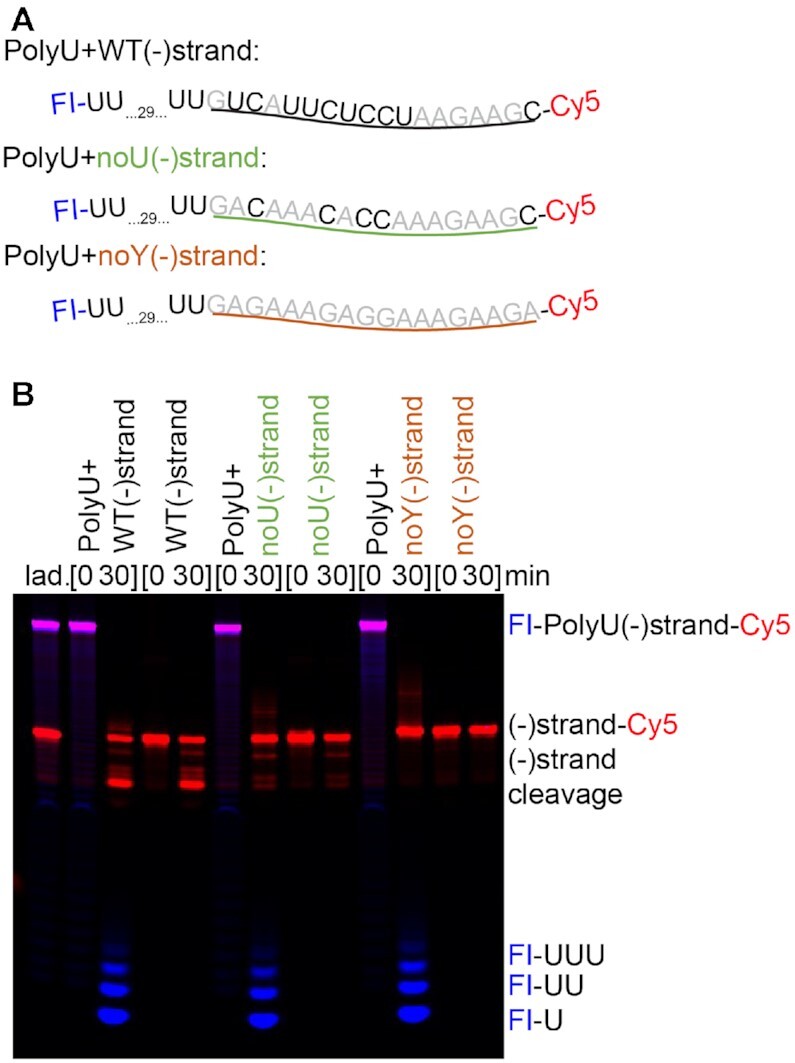
Figure 7.
Cleavage gels of negative strand sequences with both the PUN and internal Us shows Nsp15 acts across the sequence. Nsp15 (50 nM) was incubated with RNA (500 nM) for 30 min at room temperature. The pol...
Figure images are served from the NIH/NLM PubMed Central Open Access Subset or Europe PMC; copyright remains with the publishers and authors.
💬 Discussion
0 commentsNo comments yet. Be the first to start a discussion!
Leave a Comment