Abstract
Fluctuations in brain and behavioral state are supported by broadly projecting neuromodulatory systems. In this study, we use mesoscale two-photon calcium imaging to examine spontaneous activity of cholinergic and noradrenergic axons in awake mice in order to determine the interaction between arousal/movement state transitions and neuromodulatory activity across the dorsal cortex at distances separated by up to 4 mm. We confirm that GCaMP6s activity within axonal projections of both basal forebrain cholinergic and locus coeruleus noradrenergic neurons track arousal, indexed as pupil diameter, and changes in behavioral engagement, as reflected by bouts of whisker movement and/or locomotion. The broad coordination in activity between even distant axonal segments indicates that both of these systems can communicate, in part, through a global signal, especially in relation to changes in behavioral state. In addition to this broadly coordinated activity, we also find evidence that a subpopulation of both cholinergic and noradrenergic axons may exhibit heterogeneity in activity that appears to be independent of our measures of behavioral state. By monitoring the activity of cholinergic interneurons in the cortex, we found that a subpopulation of these cells also exhibit state-dependent (arousal/movement) activity. These results demonstrate that cholinergic and noradrenergic systems provide a prominent and broadly synchronized signal related to behavioral state, and therefore may contribute to state-dependent cortical activity and excitability.
🔬 Techniques
🔭 Microscopes
💻 Software
✨ Fluorophores
🧪 Sample Preparation
🏭 Microscope Brands
🧪 Reagent Suppliers
🔴 Lasers
🔎 Objectives
💻 Software Details
💻 Code & Software
💾 Data Repositories
🏷️ Research Resource Identifiers (RRIDs)
Verified research resources used in this paper:
🏛️ Research Organizations (ROR)
Affiliated research institutions:
📋 Methods
Animals
All experiments were approved by the University of Oregon Institutional Animal Care and Use Committee. Experiments were conducted using male and female mice aged between 6 and 10 wk at study onset. All mouse strains used in this study were of C57BL/6J (IMSR Cat# JAX:000664, RRID :IMSR_JAX:000664 ) background and were purchased from Jackson Laboratory and bred in-house. ChAT-cre mice (IMSR Cat# JAX:006410, RRID :IMSR_JAX:006410 ), which express cre-recombinase in cholinergic neurons, were used for viral injection experiments to record from BF-ACh axonal projections. Viral injections were used for BF-ACh studies to avoid imaging axons or dendrites from cholinergic projections not arising from the BF (e.g. cortical cholinergic interneurons). For LC-NA experiments, DBH-cre mice (IMSR Cat# JAX:033951, RRID :IMSR_JAX:033951 ), which express cre-recombinase in noradrenergic neurons, were crossed with Ai162 (IMSR Cat# JAX:031562, RRID :IMSR_JAX:031562 ) mice, which cre-dependently express GCaMP6s. ChAT-cre mice crossed with Ai162 mice were used for VCIN studies since these mice express GCaMP6s in cholinergic cells and projections, including VCINs. All mice were individually housed under an inverted 12:12 hr light/dark regime and had access to food and water ad libitum. All experiments were conducted during the active dark cycle in reverse light-cycled mice.
Surgical procedures
All surgical procedures were performed in an aseptic environment under 1–2% isoflurane anesthesia (oxygen flow rate: ~1.5 L/min) and mice were homeothermically maintained at 37.5°C under systemic analgesia (Meloxicam SR: 6 mg/kg, s.c.; Buprenorphine SR: 0.05 mg/kg, s.c.). For viral injection experiments, two small craniotomies (~1 mm) were made for bilateral viral injections into the basal forebrain (from bregma: 1.44 mm lateral, 0.6 mm posterior). The pipette was lowered 3.8 mm ventral to the surface of the brain and approximately 1 μl of an axon-targeted GCaMP6s adeno-associated virus (pAAV-hSynapsin1-FLEx-axon-GCaMP6s, addgene; Broussard et al., 2018 ) solution was injected. Animals were allowed to recover from the viral injection surgery before any subsequent surgeries. Imaging was performed at least 3 wk after virus injection to allow adequate time for axonal transport to the cortex. For two-photon imaging, a titanium headpost was affixed to the skull with dental cement after removing the overlying skin and fascia. Then, an 8 mm circular craniotomy was made overlying the dorsal cortex using a dental drill. An 8 mm circular glass coverslip was placed in the craniotomy and the coverslip was affixed to the skull with flow-it composite (Flow-It ALC, Pentron) and a thin layer of dental cement. After all surgeries, mice recovered in an ~32°C recovery chamber and postoperative subcutaneous lactated ringer’s solution was administered for 1–3 d as required.
Show full methods section
Animals
All experiments were approved by the University of Oregon Institutional Animal Care and Use Committee. Experiments were conducted using male and female mice aged between 6 and 10 wk at study onset. All mouse strains used in this study were of C57BL/6J (IMSR Cat# JAX:000664, RRID :IMSR_JAX:000664 ) background and were purchased from Jackson Laboratory and bred in-house. ChAT-cre mice (IMSR Cat# JAX:006410, RRID :IMSR_JAX:006410 ), which express cre-recombinase in cholinergic neurons, were used for viral injection experiments to record from BF-ACh axonal projections. Viral injections were used for BF-ACh studies to avoid imaging axons or dendrites from cholinergic projections not arising from the BF (e.g. cortical cholinergic interneurons). For LC-NA experiments, DBH-cre mice (IMSR Cat# JAX:033951, RRID :IMSR_JAX:033951 ), which express cre-recombinase in noradrenergic neurons, were crossed with Ai162 (IMSR Cat# JAX:031562, RRID :IMSR_JAX:031562 ) mice, which cre-dependently express GCaMP6s. ChAT-cre mice crossed with Ai162 mice were used for VCIN studies since these mice express GCaMP6s in cholinergic cells and projections, including VCINs. All mice were individually housed under an inverted 12:12 hr light/dark regime and had access to food and water ad libitum. All experiments were conducted during the active dark cycle in reverse light-cycled mice.
Surgical procedures
All surgical procedures were performed in an aseptic environment under 1–2% isoflurane anesthesia (oxygen flow rate: ~1.5 L/min) and mice were homeothermically maintained at 37.5°C under systemic analgesia (Meloxicam SR: 6 mg/kg, s.c.; Buprenorphine SR: 0.05 mg/kg, s.c.). For viral injection experiments, two small craniotomies (~1 mm) were made for bilateral viral injections into the basal forebrain (from bregma: 1.44 mm lateral, 0.6 mm posterior). The pipette was lowered 3.8 mm ventral to the surface of the brain and approximately 1 μl of an axon-targeted GCaMP6s adeno-associated virus (pAAV-hSynapsin1-FLEx-axon-GCaMP6s, addgene; Broussard et al., 2018 ) solution was injected. Animals were allowed to recover from the viral injection surgery before any subsequent surgeries. Imaging was performed at least 3 wk after virus injection to allow adequate time for axonal transport to the cortex. For two-photon imaging, a titanium headpost was affixed to the skull with dental cement after removing the overlying skin and fascia. Then, an 8 mm circular craniotomy was made overlying the dorsal cortex using a dental drill. An 8 mm circular glass coverslip was placed in the craniotomy and the coverslip was affixed to the skull with flow-it composite (Flow-It ALC, Pentron) and a thin layer of dental cement. After all surgeries, mice recovered in an ~32°C recovery chamber and postoperative subcutaneous lactated ringer’s solution was administered for 1–3 d as required.
Experimental design Arousal measures
Previous studies of head-fixed mice have demonstrated rapid variations between distinct behavioral states, including sedentary (non-walking, non-whisking), whisker twitching, whisking, and walking ( McCormick et al., 2020 ; McGinley et al., 2015b ; Musall et al., 2019 ; Salkoff et al., 2020 ; Stringer et al., 2019 ). Since facial movements (particularly of the whiskers), pupil diameter, and locomotion have all been shown to be useful for quantifying behavioral state, we monitor these behavioral variables here. For all experiments, mice were head-fixed atop a cylindrical running wheel and video of the mouse face was acquired at 30 Hz using a Teledyne camera. Pupil diameter was measured both in real time and offline using a custom LabVIEW script ( McGinley et al., 2015a ; Salkoff et al., 2020 ). Running speed was measured using a rotary encoder (McMaster-Carr) attached to the wheel. Note that this study was not optimized for pupil diameter measures since we found it necessary to use low-background light levels for imaging fluorescent axons. Thus our coherence results between pupil diameter and cholinergic/noradrenergic axon activity may be lower than previously reported ( Reimer et al., 2016 ). The running wheel was supported by springs and the rotary encoder also detected vertical movements of the running wheel, which can occur both with, and between, bouts of running. Whisker-pad movement was measured by selecting an ROI over the whisker pad and calculating the motion energy index (MEI) across the video. MEI was defined as the sum of the absolute change in pixel intensity within the ROI between adjacent video frames. Similarly, measures of movements of the jaw and snout were measured as MEI within a local region of the video, including these facial features ( Figure 3 ). All waveform and trigger signals were digitized through a Micro1401 or a Power 1401, and collected using Spike2 version 7 or 8.
Two-photon imaging
Two-photon imaging was conducted using a ThorLabs Multiphoton Mesoscope (Excitation NA 0.6, Collection NA 1.0) equipped with a 12 kHz Resonant Scanner and Virtually Conjugated Galvo Scanner Set along with a 1 mm range Remote Focusing Unit, allowing for rapid imaging across multiple ROIs varying in X, Y, and Z coordinates ( Sofroniew et al., 2016 ). Excitation of GCaMP6s was achieved via a Ti-sapphire laser tuned to 920 nm (MaiTai, Spectra Physics).
Scan Image software
(Vidrio) was used for all imaging sessions. For cell body imaging, a minimum resolution of 0.5 μm/pixel was used, and for axonal imaging a minimum resolution of 1 μm/pixel was used to clearly delineate borders of somas or axonal processes. Fields of view ranged between 50 × 50 and 400 × 400 μm and were obtained at a minimum frequency of 10 Hz (range of approximately 10–30 Hz), based on known GCaMP6s kinetics ( Chen et al., 2013 ). Five mice were used in the BF-ACh study. Across 15 sessions, 397 axon segments were imaged. In the LC-NA study, six mice were used. Across 18 sessions, 283 axon segments were imaged. Seven mice were used for the VCIN study. Across 12 sessions, 98 cell bodies were imaged. Recording duration varied between ~10 and 40 min. For motion control experiments, non-calcium-dependent mCherry was imaged alongside calcium-dependent GCaMP6s. Simultaneous excitation of mCherry and GCaMP6s was achieved via a Ti-sapphire laser tuned to 970 nm (MaiTai, Spectra Physics). Otherwise, all imaging procedures for the mCherry experiment were identical to those of GCaMP6s axon imaging studies. A total of 93 mCherry axons were recorded in three mice for this study.
Histology
Mice were euthanized with 51% carbon dioxide (24 L/min) and transcardially perfused with 25 mL of 0.01 M PBS followed by 20 mL of 4% paraformaldehyde. Brains were extracted and placed in 4% paraformaldehyde for 24 hr at 4°C and subsequently transferred into 20% and 30% sucrose for 24 hr at 4°C. Brains were then sliced into 55 μm sections at –21°C using a cryostat (Leica). Antibody staining was utilized to identify the expression of antigens of interest, as well as enhance GCaMP6s expression ( Daigle et al., 2018 ; Larsen et al., 2018 ). We performed an antigen retrieval procedure where sections were incubated in 10 mM sodium citrate (pH 6.0) and 0.05% Triton-X-100 for 20 min at 75°C. Sections were then rinsed in 0.2% Triton-X-100 and 0.01 M PBS before being blocked with 5% normal donkey serum and 0.2% Triton-X-100 in 0.1 M PBS for 1–3 hr at room temperature. Sections were incubated for 48–72 hr at 4°C in primary antibodies: anti-choline acetyltransferase 1:300 (Abcam Cat# ab178850, RRID: AB_2721842 ), anti-tyrosine hydroxylase 1:300 (Abcam Cat# ab137869, RRID: AB_2801410 ), and/or anti-GFP 1:2000 (Abcam Cat# ab6673, RRID: AB_305643 ). Primary antibodies were diluted in the blocking buffer solution. Tissue was then rinsed in 0.2% Triton-X-100 and 0.01 M PBS before being incubated for 1 hr at room temperature in Alexa 488 (Abcam Cat# ab150129, RRID: AB_2687506 ) and 555 (Abcam Cat# ab150074, RRID: AB_2636997 ), conjugated secondary antibodies (1:500) in 0.1 M PBS. After the secondary antibody incubation, sections were rinsed in 0.2% Triton-X-100 and 0.01 M PBS followed by 0.01 M PBS before being mounted on glass slides and cover-slipped with prolong gold antifade mounting media. Images are displayed as mean intensity z-projections and were captured with a Nikon SoRa spinning disk confocal microscope using 20 X/0.75 NA and 40 X/1.15 NA objectives. Cholinergic axons in cortex ( Figure 1—figure supplement 1A and B ) were captured at ×160 by adding a ×4 additional objective to the light path while imaging with the ×40/1.15 NA objective. GCaMP6s and neuromodulatory marker expression in cell bodies were quantified by hand and used to determine the extent of colabeling (see Figure 1—figure supplement 1 ).
Statistical analysis Behavioral data analysis
All imaging data was first aligned to behavioral data using custom MATLAB scripts. Pupil diameter was normalized to the max pupil diameter in each session to limit overestimation of arousal state in low lighting conditions. FaceMap ( Syeda et al., 2022 ; https://github.com/MouseLand/FaceMap ) was used to calculate motion energy of the snout and mouth. Onsets and offsets of walking bouts, whisking bouts, and facial twitches were detected using custom MATLAB code. Walking bouts were defined as times during which the mouse exceeded a speed of 2.5 cm/s for at least 2 s. Whisker pad motion energy was normalized between 0 and 1 for each session, and whisking bouts were defined as periods in which the normalized whisker pad motion energy exceeded 20% for more than 1 s. Twitches were defined as moments when the normalized whisker pad motion energy exceeded 20% for less than 0.5 s. Walking bouts, whisking bouts, and twitches that were not preceded and followed by 1 s of stillness were excluded. This requirement led to a drop in axonal fluorescence prior to the onset of movement (e.g. Figure 2A and B ). For the BF-ACh study, GCaMP6s activity in 397 axon segments was compared to 101 waking onsets and offsets, 330 whisking onsets, 201 whisking offsets, and 1108 twitch onsets. For the LC-NA study, GCaMP6s activity in 283 axon segments was compared to 34 walking onsets and offsets, 400 whisk onsets, 353 whisk offsets, and 644 twitch onsets. For the VCIN study, GCaMP6s activity in 84 cell bodies was compared to 127 walking onsets and offsets and activity in 98 cell bodies was compared to 1104 whisking onsets, 1015 whisking offsets, and 870 twitch onsets. For the mCherry motion control study, fluorescence in 93 axons was compared to 622 walking onsets and offsets, 3342 whisking onsets, 3137 whisking offsets, and 1129 twitch onsets. Two-photon imaging analysis Suite2P ( Pachitariu et al., 2017 ) was used to identify cells and axons from two-photon mesoscope imaging data. Axon segments and cell bodies were imaged in several (up to four) ROIs chosen across the dorsal cortex. Distances between ROIs ( Figures 1 , 4 and 5 ) were determined based on the center point of each ROI. ROI size ranged from 50 × 50 to 400 × 400 µm. All identified cells and axonal shafts were manually verified. A Suite2P-defined region was confirmed to be an axon if all pixels identified were within ~5 µm of the axon and presynaptic boutons and if a significant (>~20 µm) length of the axonal segment was within the region (e.g. see Figure 4A ). A Suite2P-defined cell was considered to be a cell only if nearly all identified pixels were within a cell body. Any identified regions that did not correspond to a clearly identifiable distinct cell body or axonal process were excluded. Axons and cell body regions that were identified with Suite2P but were visually confirmed (i.e. clear continuity of axon form, within the imaging plane, connecting the two segments together) to belong to the same cell or axon were removed from our experimental data set and included in our same-axon/cell data set if they were of a similar size and shape to those selected in the experimental data set (ACh: n = 18; NA: n = 30; VCIN: n = 18). To control for the possibility of motion artifacts, autofluorescent ‘blebs’ that did not have calcium-dependent activity and were approximately of similar size to axonal varicosities were selected from within the imaging fields (ACh: n = 22; NA: n = 19; VCIN: n = 8). Since these autofluorescent blebs are not necessarily a similar thickness or brightness to our experimental data, it is possible that movement in the Z plane is not entirely accounted for by comparing our experimental data to blebs. Therefore, we performed an additional control experiment in which we injected a cre-dependent mCherry virus (pAACV-hSyn-DIO-mCherry; a gift from Bryan Roth; Addgene plasmid #50459; http://n2t.net/addgene :50459; RRID: Addgene_50459 ) into the basal forebrain of three ChAT-cre mice. We then recorded fluorescence from 93 axons in 30 ROIs (between 5 and 8 ROIs recorded simultaneously each session). This control allowed us to determine whether there was any effect of movement of axons in and out of the imaging plane that could contribute to our observed experimental results. Preprocessing and analysis of mCherry control axons were performed in the same manner as for experimental data (described below). Preprocessing of calcium fluorescence data was performed using methods previously described ( Nelson and Mooney, 2016 ; Reimer et al., 2016 ). Briefly, all traces were upsampled to 100 Hz and low-pass filtered to 10 Hz. Signal-to-noise ratios were then calculated for all traces by dividing the max power between the frequency range of 0.05–0.5 Hz by the mean power between 1 and 3 Hz. All traces that did not meet a minimum signal-to-noise criteria of log(20) were excluded from further analyses. Normalized fluorescence values were used in statistical analyses to avoid overweighting larger or brighter axon segments. For displaying data, ΔF/F was calculated for each identified axon or cell body using the median fluorescence value over each recording session as the baseline fluorescence. All preprocessing was performed using custom MATLAB scripts. Relationships between behavior and axon activity To determine the frequencies at which axonal GCaMP6s fluorescence and arousal-related behaviors (walking, pupil dilation, facial movement) were most correlated, magnitude-squared coherence was calculated using a 2 min window with a 98% overlap and a Hamming filter using the MATLAB function mscohere. As a control, axon activity traces were shuffled in time and coherence was calculated with all behavioral variables. To assess the timing of axonal activity (GCaMP6s fluorescence) in comparison to arousal-related behaviors, cross-correlations between axon activity and behavioral measures were calculated using the MATLAB function xcorr with a 3 s maximum lag. Cross-correlations were calculated after low-pass filtering at 1 Hz to capture the frequencies at which our behavioral variables and GCaMP6s have the most power ( Figure 2—figure supplement 2 ). Ridge regressions were used to determine the relative strength of the relationships between behavioral variables and axon activity. All data was first low-pass filtered at 1 Hz. Models were cross-validated to account for overfitting. Relationships between axons/cells Magnitude-squared coherence and cross-correlation was calculated between all pairs of simultaneously recorded axon segments using the same parameters used to relate axon activity to behavior, as described above. Distance between axons was estimated by calculating the distance between the center point of each ROI. Therefore, axons within the same ROI were coded as 0 mm apart. Since our data may be strongly influenced by the frequency of activity occurring in the axons (owing to the preference of GCaMP6s fluorescence for low frequencies: Figure 2—figure supplement 2 ), we sought to better understand the limitations of our activity monitoring methodology by comparing the coherence and correlation of activity in two adjacent segments of the same axon ( Figure 4 , Figure 2—figure supplement 2 ). Since axon conduction failures are rare ( Foust et al., 2010 ; Popovic et al., 2011 ), we reasoned that any decrease below 100% coherence or below a correlation of 1 between activity in adjacent segments of the same axon most likely indicates a fundamental limitation of fluorescence-based data. This limitation results from the complex relationship between axonal action potential activity, [Ca 2+ ] i , GCaMP6s, and our ability to monitor axonal GCaMP6s fluorescence. To this end, first we identified several (n = 18 ACh; n = 30 NA) pairs of adjacent axon segments that we determined by eye to be portions of the same axon (i.e. segments joined by a clear continuity of axonal form). Plots of coherence between adjacent segments of the same axon revealed high (e.g. ≥0.8) values at frequencies below approximately 1 Hz, but this coherence decreased strongly at frequencies above approximately 1 Hz, such that the coherence between the axon segments was similar to that obtained with shuffled data at frequencies >approximately 3 Hz ( Figure 4D and E ). This result indicates that our measure of axonal activity is limited to variations in action potential firing rate below approximately 1 Hz. Therefore, we applied a 1 Hz low-pass filter to the recordings prior to calculation of correlation. Examining different cutoff frequencies for the low-pass filter indicated that a cutoff frequency of 1 Hz was optimal for enhancing correlation in same-axon data, while preserving information (see Figure 4—figure supplement 1D and F ). Since we observed a broad distribution in cross-correlations between simultaneously recorded axons or cells ( Figure 4J, K and M ), we used a partial correlation analysis to determine whether some pairs were highly correlated due to a shared ‘common signal.’ Partial correlations were calculated by correlating the residuals of a linear regression between a controlling variable, or common signal, and each of two axons or cells in a pair using the MATLAB function partialcorr. The average dF/F of all simultaneously recorded axons or cells (excluding the two axons or cells being compared) was used as a controlling variable. Counts of simultaneously imaged axons or cells ranged from 7 to 61 for ACh, 9 to24 for NA, and 3 to 10 for VCINs. Since our data suggest that facial activity could contribute to the common signal, we also used whisking activity as the controlling variable in a separate analysis ( Figure 4—figure supplement 1H,I ). Partial correlations were calculated after low-pass filtering at 1 Hz. To determine the impact of behavioral state on partial correlation, periods in which the animal was stationary (not walking) or still (neither walking nor whisking) were isolated (e.g. Figure 4—figure supplement 1J ). Custom MATLAB scripts used in data analysis are available online at https://www.github.com/lncollins91/ACh_NA_VCIN , ( Collins, 2023 copy archived at swh:1:rev:6c03e912e115a52cf9118a777fa9aabfa6f17507 ).
Surgical procedures
All surgical procedures were performed in an aseptic environment under 1–2% isoflurane anesthesia (oxygen flow rate: ~1.5 L/min) and mice were homeothermically maintained at 37.5°C under systemic analgesia (Meloxicam SR: 6 mg/kg, s.c.; Buprenorphine SR: 0.05 mg/kg, s.c.). For viral injection experiments, two small craniotomies (~1 mm) were made for bilateral viral injections into the basal forebrain (from bregma: 1.44 mm lateral, 0.6 mm posterior). The pipette was lowered 3.8 mm ventral to the surface of the brain and approximately 1 μl of an axon-targeted GCaMP6s adeno-associated virus (pAAV-hSynapsin1-FLEx-axon-GCaMP6s, addgene; Broussard et al., 2018 ) solution was injected. Animals were allowed to recover from the viral injection surgery before any subsequent surgeries. Imaging was performed at least 3 wk after virus injection to allow adequate time for axonal transport to the cortex. For two-photon imaging, a titanium headpost was affixed to the skull with dental cement after removing the overlying skin and fascia. Then, an 8 mm circular craniotomy was made overlying the dorsal cortex using a dental drill. An 8 mm circular glass coverslip was placed in the craniotomy and the coverslip was affixed to the skull with flow-it composite (Flow-It ALC, Pentron) and a thin layer of dental cement. After all surgeries, mice recovered in an ~32°C recovery chamber and postoperative subcutaneous lactated ringer’s solution was administered for 1–3 d as required.
Experimental design Arousal measures
Previous studies of head-fixed mice have demonstrated rapid variations between distinct behavioral states, including sedentary (non-walking, non-whisking), whisker twitching, whisking, and walking ( McCormick et al., 2020 ; McGinley et al., 2015b ; Musall et al., 2019 ; Salkoff et al., 2020 ; Stringer et al., 2019 ). Since facial movements (particularly of the whiskers), pupil diameter, and locomotion have all been shown to be useful for quantifying behavioral state, we monitor these behavioral variables here. For all experiments, mice were head-fixed atop a cylindrical running wheel and video of the mouse face was acquired at 30 Hz using a Teledyne camera. Pupil diameter was measured both in real time and offline using a custom LabVIEW script ( McGinley et al., 2015a ; Salkoff et al., 2020 ). Running speed was measured using a rotary encoder (McMaster-Carr) attached to the wheel. Note that this study was not optimized for pupil diameter measures since we found it necessary to use low-background light levels for imaging fluorescent axons. Thus our coherence results between pupil diameter and cholinergic/noradrenergic axon activity may be lower than previously reported ( Reimer et al., 2016 ). The running wheel was supported by springs and the rotary encoder also detected vertical movements of the running wheel, which can occur both with, and between, bouts of running. Whisker-pad movement was measured by selecting an ROI over the whisker pad and calculating the motion energy index (MEI) across the video. MEI was defined as the sum of the absolute change in pixel intensity within the ROI between adjacent video frames. Similarly, measures of movements of the jaw and snout were measured as MEI within a local region of the video, including these facial features ( Figure 3 ). All waveform and trigger signals were digitized through a Micro1401 or a Power 1401, and collected using Spike2 version 7 or 8.
Two-photon imaging
Two-photon imaging was conducted using a ThorLabs Multiphoton Mesoscope (Excitation NA 0.6, Collection NA 1.0) equipped with a 12 kHz Resonant Scanner and Virtually Conjugated Galvo Scanner Set along with a 1 mm range Remote Focusing Unit, allowing for rapid imaging across multiple ROIs varying in X, Y, and Z coordinates ( Sofroniew et al., 2016 ). Excitation of GCaMP6s was achieved via a Ti-sapphire laser tuned to 920 nm (MaiTai, Spectra Physics).
Scan Image software
(Vidrio) was used for all imaging sessions. For cell body imaging, a minimum resolution of 0.5 μm/pixel was used, and for axonal imaging a minimum resolution of 1 μm/pixel was used to clearly delineate borders of somas or axonal processes. Fields of view ranged between 50 × 50 and 400 × 400 μm and were obtained at a minimum frequency of 10 Hz (range of approximately 10–30 Hz), based on known GCaMP6s kinetics ( Chen et al., 2013 ). Five mice were used in the BF-ACh study. Across 15 sessions, 397 axon segments were imaged. In the LC-NA study, six mice were used. Across 18 sessions, 283 axon segments were imaged. Seven mice were used for the VCIN study. Across 12 sessions, 98 cell bodies were imaged. Recording duration varied between ~10 and 40 min. For motion control experiments, non-calcium-dependent mCherry was imaged alongside calcium-dependent GCaMP6s. Simultaneous excitation of mCherry and GCaMP6s was achieved via a Ti-sapphire laser tuned to 970 nm (MaiTai, Spectra Physics). Otherwise, all imaging procedures for the mCherry experiment were identical to those of GCaMP6s axon imaging studies. A total of 93 mCherry axons were recorded in three mice for this study.
Histology
Mice were euthanized with 51% carbon dioxide (24 L/min) and transcardially perfused with 25 mL of 0.01 M PBS followed by 20 mL of 4% paraformaldehyde. Brains were extracted and placed in 4% paraformaldehyde for 24 hr at 4°C and subsequently transferred into 20% and 30% sucrose for 24 hr at 4°C. Brains were then sliced into 55 μm sections at –21°C using a cryostat (Leica). Antibody staining was utilized to identify the expression of antigens of interest, as well as enhance GCaMP6s expression ( Daigle et al., 2018 ; Larsen et al., 2018 ). We performed an antigen retrieval procedure where sections were incubated in 10 mM sodium citrate (pH 6.0) and 0.05% Triton-X-100 for 20 min at 75°C. Sections were then rinsed in 0.2% Triton-X-100 and 0.01 M PBS before being blocked with 5% normal donkey serum and 0.2% Triton-X-100 in 0.1 M PBS for 1–3 hr at room temperature. Sections were incubated for 48–72 hr at 4°C in primary antibodies: anti-choline acetyltransferase 1:300 (Abcam Cat# ab178850, RRID: AB_2721842 ), anti-tyrosine hydroxylase 1:300 (Abcam Cat# ab137869, RRID: AB_2801410 ), and/or anti-GFP 1:2000 (Abcam Cat# ab6673, RRID: AB_305643 ). Primary antibodies were diluted in the blocking buffer solution. Tissue was then rinsed in 0.2% Triton-X-100 and 0.01 M PBS before being incubated for 1 hr at room temperature in Alexa 488 (Abcam Cat# ab150129, RRID: AB_2687506 ) and 555 (Abcam Cat# ab150074, RRID: AB_2636997 ), conjugated secondary antibodies (1:500) in 0.1 M PBS. After the secondary antibody incubation, sections were rinsed in 0.2% Triton-X-100 and 0.01 M PBS followed by 0.01 M PBS before being mounted on glass slides and cover-slipped with prolong gold antifade mounting media. Images are displayed as mean intensity z-projections and were captured with a Nikon SoRa spinning disk confocal microscope using 20 X/0.75 NA and 40 X/1.15 NA objectives. Cholinergic axons in cortex ( Figure 1—figure supplement 1A and B ) were captured at ×160 by adding a ×4 additional objective to the light path while imaging with the ×40/1.15 NA objective. GCaMP6s and neuromodulatory marker expression in cell bodies were quantified by hand and used to determine the extent of colabeling (see Figure 1—figure supplement 1 ).
Additional files Transparent reporting form
📊 Figures
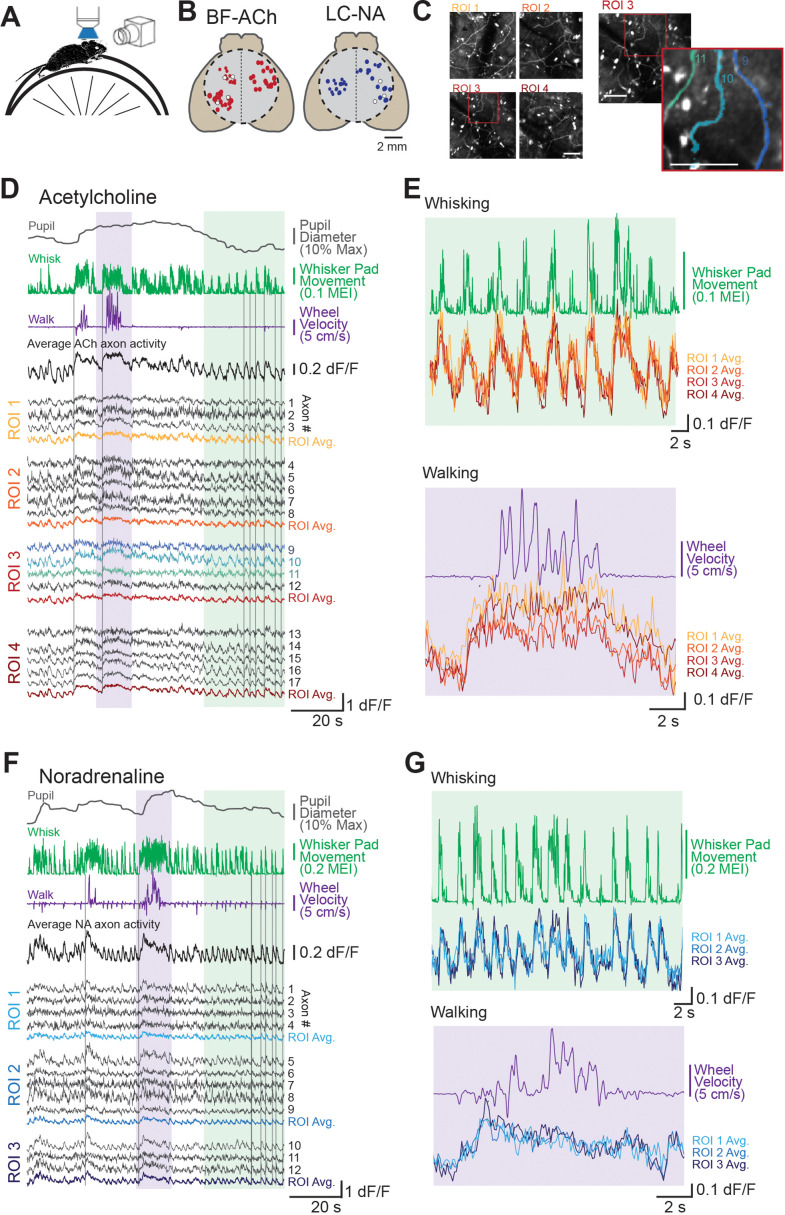
Figure 1.
Two-photon imaging of dorsal cortical cholinergic and noradrenergic activity reveals strong state dependence.
( A ) Schematic of experimental setup. Awake mice were placed atop a running wheel underneath a two-photon mesoscope objective for imaging of axonal activity through GCaMP6s. A second side camera was ...
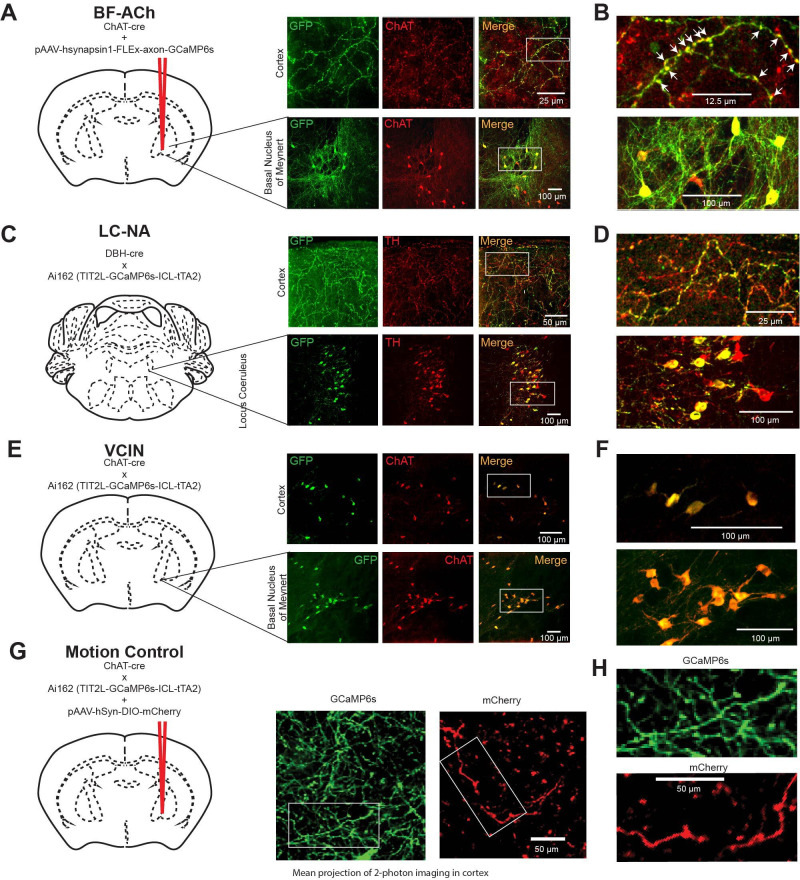
Figure 1u2014figure supplement 1.
Histological verification of GCaMP6s labeling specificity for cholinergic and noradrenergic neurons and axons.
Relates to Figures 1 u2014 5 . ( A ) Cholinergic axons were labeled with GCaMP6s through local injection of pAAV-hsynapsin1-FLEx-axon-GCaMP6s into the region of the basal forebrain, as illustrated. Im...
Animation 1.
Example of mouse face during twitching, whisking, and walking.
Related to Figures 1 and 2 . Video recording of a mouseu2019s face during periods of twitching, whisking, and walking. Note the difference between a short (< 0.5 s) twitch and a sustained (> 1 s) whis...
Video 1.
Axon imaging and behavioral acquisition methodology.
Related to Figure 1 . A headpost was implanted on the skull overlying the dorsal cortex (top of video = anterior). Cortical regions coarsely aligned to the Allen Brain Institute Common Coordinate Fram...
Video 2.
Comparison of changes in fluorescence with whisker movements in GCaMP6s axons versus no discernible changes in fluorescence in non-activity-dependent mCherry axons. Scale bar = 50 u00b5m.
Related to Figures 1 and 2 . These two examples are representative recordings obtained from two different animals, while the animals were performing un-instructed whisker twitches and whisking (not sh...
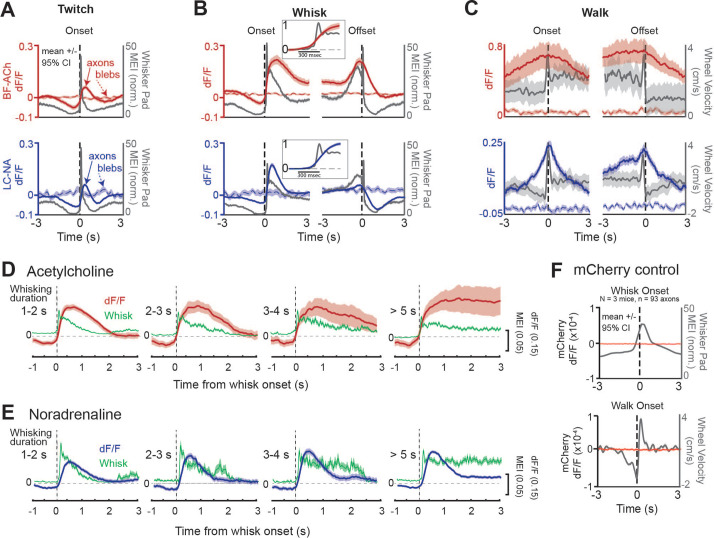
Figure 2.
Basal forebrain-derived cholinergic (BF-ACh) and locus coeruleus-derived noradrenergic (LC-NA) activity track behavioral state transitions.
( Au2013C ) Mean GCaMP6s fluorescence in BF-ACh (top) and LC-NA (bottom) axons aligned to the onset and offset of whisker twitching ( A ), a bout of full whisking ( B ), and walking ( C ). Gray traces...
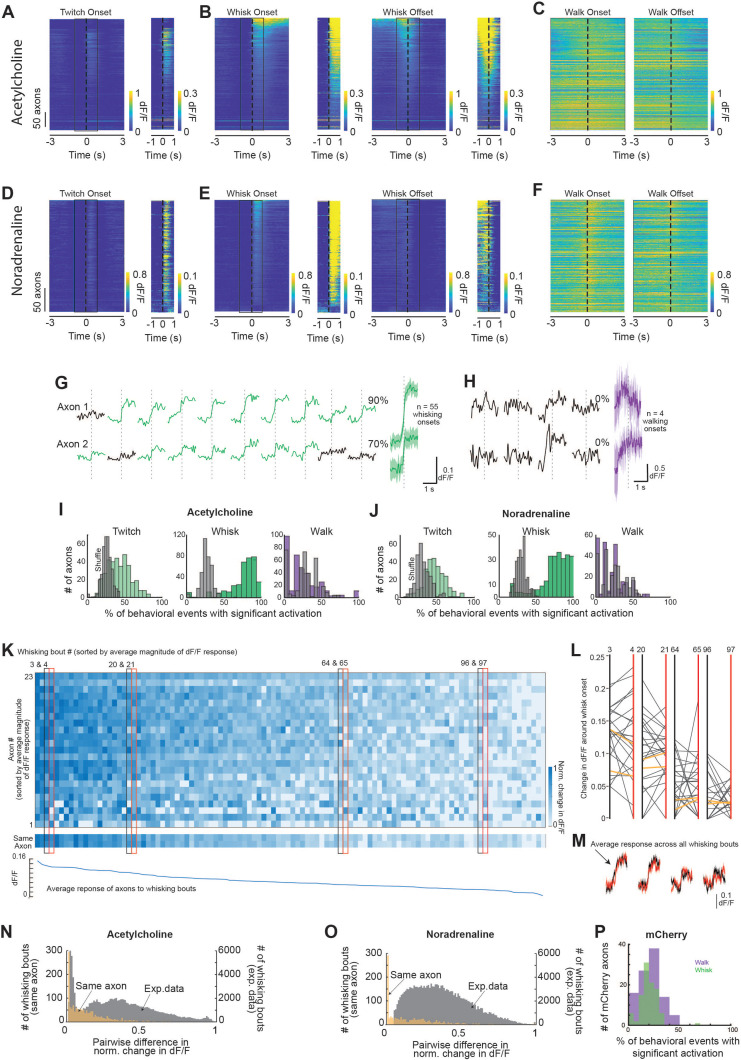
Figure 2u2014figure supplement 1.
Individual axonal responses to behavioral state changes.
Relates to Figures 1 and 2 . ( Au2013F ) Same data as displayed in Figure 2Au2013C , but separated to visualize heterogeneity of individual axon responses to behavioral state changes. Axons are sorted...
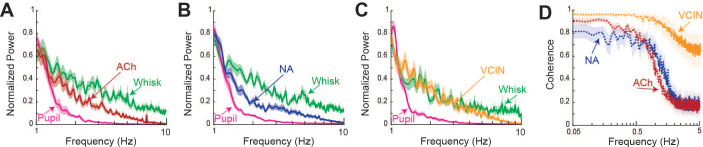
Figure 2u2014figure supplement 2.
Distribution of power and coherence for pupil, cholinergic, noradrenergic, whisking, and VIP-expressing interneuron (VCIN) activity.
Related to Figures 2 , 3C and D . ( A ) Power distribution between 1 and 10 Hz for cholinergic axon fluorescence, pupil diameter, and whisker pad motion energy. N = 5 mice, n = 397 axons. ( B ) Same a...
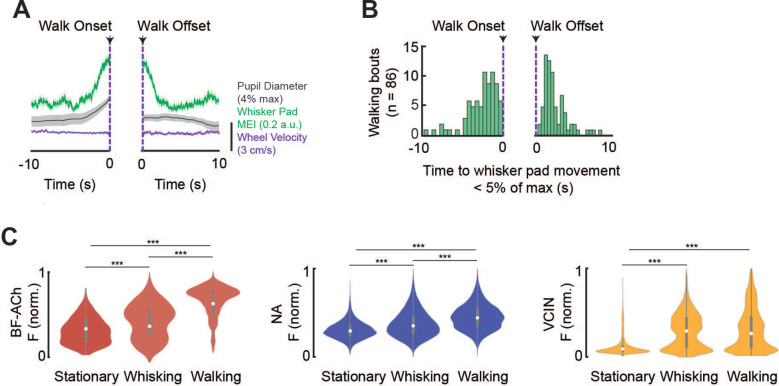
Figure 2u2014figure supplement 3.
Variable timing of onset/offset of whisking and walking and fluorescence of cholinergic and noradrenergic axons and VIP-expressing interneurons (VCINs) during different states.
Related to Figure 2 . ( A ) Average whisker movements and pupil diameter preceding and following the onset/offset of a walking bout (n = 86 walking bouts; mean +/- 95% confidence intervals plotted). N...
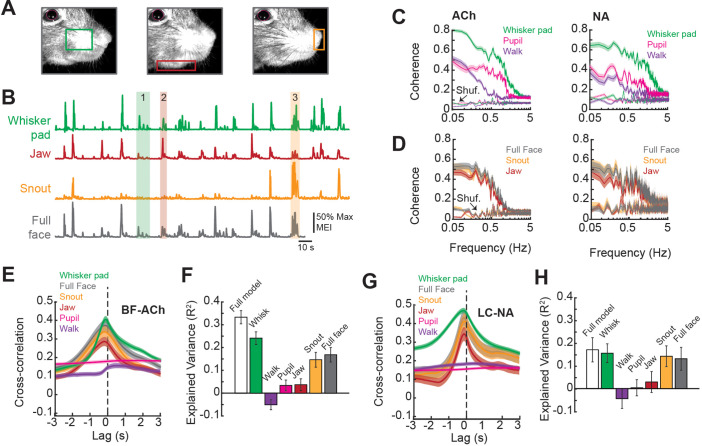
Figure 3.
Facial movements are highly predictive of basal forebrain-derived cholinergic (BF-ACh) and locus coeruleus-derived noradrenergic (LC-NA) axon activity.
( A ) Restricted regions within videos of the face were analyzed to capture movement of the (left to right) whisker pad, jaw, and snout. ( B ) Example traces of the motion energy index (MEI) recorded ...
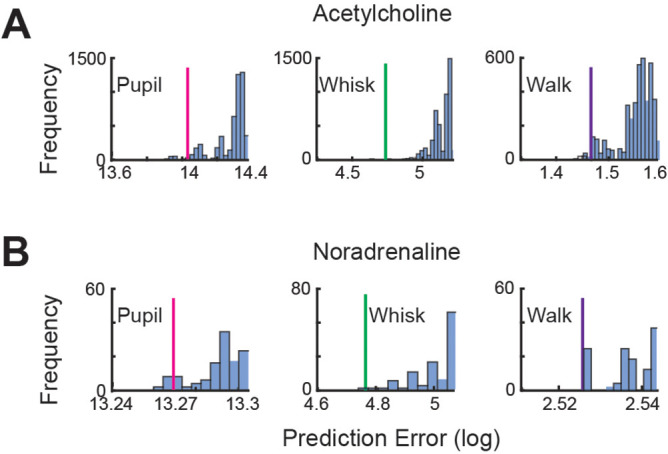
Figure 3u2014figure supplement 1.
Quantification of linear regression predictive error.
Related to Figure 3F and H . To confirm that the reported relationships between axonal GCaMP6s activity and animal movement were not achieved by chance, we determined the linear regression predictive ...
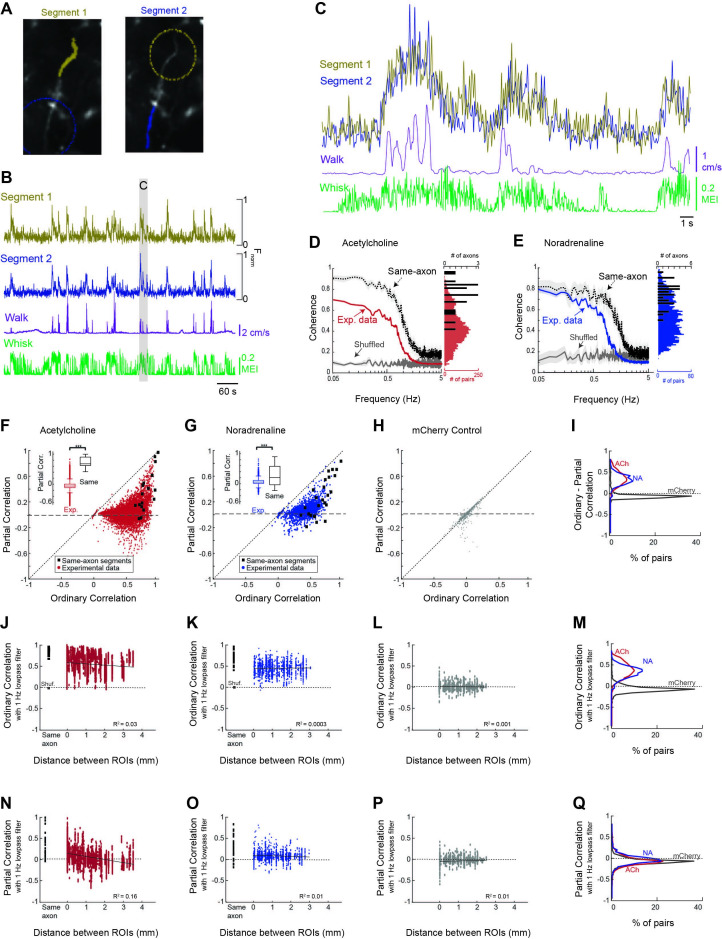
Figure 4.
Cholinergic and noradrenergic axon segments across the dorsal cortex exhibit a common signal related to behavioral state.
( A ) To examine the relationship between monitored axon segments, we first measured the relationship between GCaMP6s Ca 2+ fluorescence signals measured in adjacent segments of the same axon (e.g. ye...
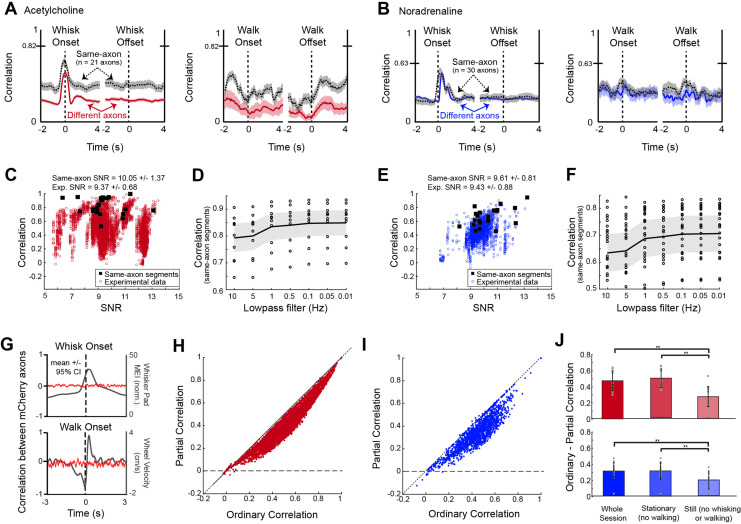
Figure 4u2014figure supplement 1.
Features of axonal imaging data relevant to interpreting imaging results.
Related to Figure 4 . ( A ) Average correlation between basal forebrain-derived cholinergic (BF-ACh) axon segment pairs (n=21 same axon pairs; n=7272 different axon pairs) aligned to the onset and off...
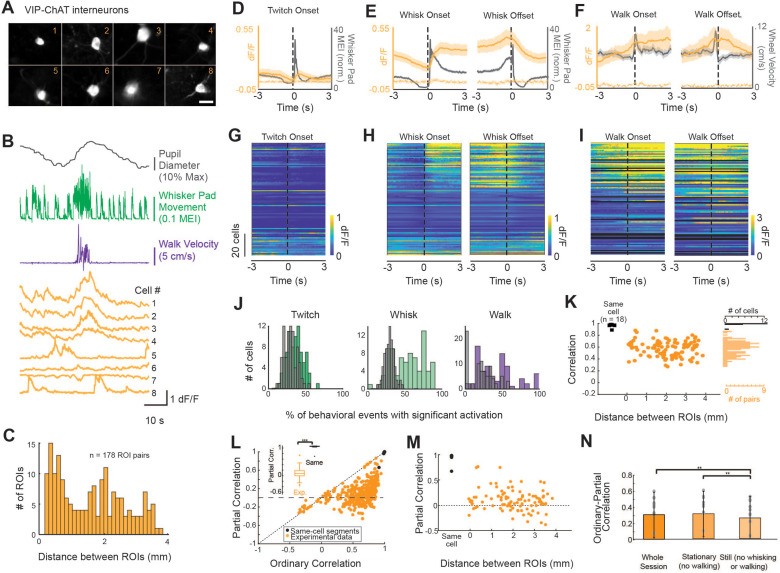
Figure 5.
A subpopulation of VIP-ChAT cortical interneurons track changes in behavioral state.
( A ) Images of eight simultaneously recorded VIP-ChAT cortical interneurons (VCINs). ( B ) Example recording taken from the eight somas shown in panel ( A ). Note the clear heterogeneity of VCIN resp...
Figure images are served from the NIH/NLM PubMed Central Open Access Subset or Europe PMC; copyright remains with the publishers and authors.
💬 Discussion
0 commentsNo comments yet. Be the first to start a discussion!
Leave a Comment