Abstract
BACKGROUND: Chromatin organisation affects gene expression and regional mutation frequencies and contributes to carcinogenesis. Aberrant organisation of DNA has been correlated with cancer prognosis in analyses of the chromatin component of tumour cell nuclei using image texture analysis. As yet, the methodology has not been sufficiently validated to permit its clinical application. We aimed to define and validate a novel prognostic biomarker for the automatic detection of heterogeneous chromatin organisation. METHODS: Machine learning algorithms analysed the chromatin organisation in 461 000 images of tumour cell nuclei stained for DNA from 390 patients (discovery cohort) treated for stage I or II colorectal cancer at the Aker University Hospital (Oslo, Norway). The resulting marker of chromatin heterogeneity, termed Nucleotyping, was subsequently independently validated in six patient cohorts: 442 patients with stage I or II colorectal cancer in the Gloucester Colorectal Cancer Study (UK); 391 patients with stage II colorectal cancer in the QUASAR 2 trial; 246 patients with stage I ovarian carcinoma; 354 patients with uterine sarcoma; 307 patients with prostate carcinoma; and 791 patients with endometrial carcinoma. The primary outcome was cancer-specific survival. FINDINGS: In all patient cohorts, patients with chromatin heterogeneous tumours had worse cancer-specific survival than patients with chromatin homogeneous tumours (univariable analysis hazard ratio [HR] 1·7, 95% CI 1·2-2·5, in the discovery cohort; 1·8, 1·0-3·0, in the Gloucester validation cohort; 2·2, 1·1-4·5, in the QUASAR 2 validation cohort; 3·1, 1·9-5·0, in the ovarian carcinoma cohort; 2·5, 1·8-3·4, in the uterine sarcoma cohort; 2·3, 1·2-4·6, in the prostate carcinoma cohort; and 4·3, 2·8-6·8, in the endometrial carcinoma cohort). After adjusting for established prognostic patient characteristics in multivariable analyses, Nucleotyping was prognostic in all cohorts except for the prostate carcinoma cohort (HR 1·7, 95% CI 1·1-2·5, in the discovery cohort; 1·9, 1·1-3·2, in the Gloucester validation cohort; 2·6, 1·2-5·6, in the QUASAR 2 cohort; 1·8, 1·1-3·0, for ovarian carcinoma; 1·6, 1·0-2·4, for uterine sarcoma; 1·43, 0·68-2·99, for prostate carcinoma; and 1·9, 1·1-3·1, for endometrial carcinoma). Chromatin heterogeneity was a significant predictor of cancer-specific survival in microsatellite unstable (HR 2·9, 95% CI 1·0-8·4) and microsatellite stable (1·8, 1·2-2·7) stage II colorectal cancer, but microsatellite instability was not a significant predictor of outcome in chromatin homogeneous (1·3, 0·7-2·4) or chromatin heterogeneous (0·8, 0·3-2·0) stage II colorectal cancer. INTERPRETATION: The consistent prognostic prediction of Nucleotyping in different biological and technical circumstances suggests that the marker of chromatin heterogeneity can be reliably assessed in routine clinical practice and could be used to objectively assist decision making in a range of clinical settings. An immediate application would be to identify high-risk patients with stage II colorectal cancer who might have greater absolute benefit from adjuvant chemotherapy. Clinical trials are warranted to evaluate the survival benefit and cost-effectiveness of using Nucleotyping to guide treatment decisions in multiple clinical settings. FUNDING: The Research Council of Norway, the South-Eastern Norway Regional Health Authority, the National Institute for Health Research, and the Wellcome Trust.
✨ Fluorophores
🧪 Sample Preparation
🏭 Microscope Brands
🧪 Reagent Suppliers
📷 Detectors
💻 Software Details
🏛️ Research Organizations (ROR)
Affiliated research institutions:
📋 Methods
Machine learning algorithms analysed the chromatin organisation in 461 000 images of tumour cell nuclei stained for DNA from 390 patients (discovery cohort) treated for stage I or II colorectal cancer at the Aker University Hospital (Oslo, Norway). The resulting marker of chromatin heterogeneity, termed Nucleotyping, was subsequently independently validated in six patient cohorts: 442 patients with stage I or II colorectal cancer in the Gloucester Colorectal Cancer Study (UK); 391 patients with stage II colorectal cancer in the QUASAR 2 trial; 246 patients with stage I ovarian carcinoma; 354 patients with uterine sarcoma; 307 patients with prostate carcinoma; and 791 patients with endometrial carcinoma. The primary outcome was cancer-specific survival.
Methods
Patient cohorts Between 1993 and 2003, 494 consecutive patients with primary colorectal cancer at Aker University Hospital (Oslo, Norway) had resection of non-synchronous stage I and II tumours. 11 , 12 390 of these patients were included in our discovery cohort ( figure 1A ; table 1 ). Two (72 200 (51%) 212 (48%) 58 (15%) Sex Female 192 (49%) 204 (46%) 161 (41%) Male 198 (51%) 238 (54%) 230 (59%) Stage I 112 (29%) 83 (19%) 0 II 278 (71%) 359 (81%) 391 (100%) Histological grade 1 37 (10%) 120 (27%) 15 (4%) 2 315 (82%) 257 (58%) 282 (77%) 3 34 (9%) 65 (15%) 68 (19%) Pathologic tumour (T) stage T1 23 (6%) 14 (3%) 0 T2 89 (23%) 68 (15%) 0 T3 261 (67%) 236 (54%) 190 (51%) T4 17 (4%) 123 (28%) 185 (49%) Microsatellite stability Unstable 63 (17%) NA 62 (17%) Stable 300 (83%) NA 306 (83%) Location Rectum 118 (30%) 131 (30%) 44 (12%) Distal colon 116 (30%) 162 (37%) 142 (38%) Proximal colon 156 (40%) 149 (34%) 188 (50%) Surgery type Elective 354 (91%) 366 (85%) NA Acute * 36 (9%) 65 (15%) NA Chromatin heterogeneity Homogeneous 235 (60%) 308 (70%) 244 (62%) Heterogeneous 155 (40%) 134 (30%) 147 (38%) Data are median (IQR) or number (%). NA=data not available. * Acute surgery was done because of obstruction or perforation of the bowel at presentation in the discovery cohort, and defined as either urgent or emergency surgery in the Gloucester validation cohort. The Gloucester colorectal cancer validation cohort included 442 of the 467 patients with non-synchronous stage I or II colorectal cancer from the Gloucester Colorectal Cancer Study (UK), who were recruited between 1988 and 1996 ( figure 1B , table 1 ). 13 , 14 Data on adjuvant radiotherapy and chemotherapy were available for 310 (70%) patients, of whom 23 (7%) received adjuvant treatment and 287 (93%) did not. Total mesorectal excision was done in most patients with rectal cancer (n=131), and six (5%) patients with rectal cancer received neoadjuvant treatment. None of the patients with colon cancer (n=311) received neoadjuvant treatment. This study was approved by the Gloucestershire Local Research Ethics Committee (number 01/21G) and REK in Norway (number 2015/1606), and the pathology analyses were done by an expert pathologist (NAS). The QUASAR 2 trial (ISRCTN registry number ISRCTN45133151) established a biobank that included formalin-fixed, paraffin-embedded tumour tissue blocks from 441 patients with stage II colorectal cancer. 15 Data from 391 patients were available for the second colorectal cancer validation cohort ( figure 1C ; table 1 ). Patients were recruited between 2005 and 2010, and all patients received adjuvant chemotherapy (capecitabine with or without bevacizumab), but none received neoadjuvant treatment. Approval for the study was obtained from the West Midlands Research Ethics Committee (number 04/MRE/11/18) and REK in Norway (number 2015/1607). The pathology assessments were done by pathologists at the participating hospitals in the trial. 246 patients treated for International Federation of Gynecology and Obstetrics (FIGO) stage I ovarian carcinoma between 1982 and 1989 (surgery at county hospitals and evaluation of further treatment at the Norwegian Radium Hospital, a tertiary referral comprehensive cancer centre in Oslo, Norway) were analysed as an ovarian cancer validation cohort ( figure 1D ; appendix p 6 ). 7 All patients provided verbal informed consent, and the study was in accordance with Norwegian law. The surgical procedure consisted of peritoneal washing, hysterectomy, bilateral salpingo-oophorectomy, and omentectomy. The number of patients who received adjuvant treatments and the types of adjuvant treatments are described in the appendix (p 24) . The FIGO stage was reviewed according to 1988 criteria, although para-aortic and pelvic lymphadenectomy was not routinely performed. A single pathologist (VMA) masked to patient outcome reviewed the histological sections using WHO criteria. We confirmed the diagnosis and obtained adequate tumour material from 354 patients with uterine sarcoma reported to the Norwegian Cancer Registry between 1970 and 2000 to make up the uterine sarcoma validation cohort ( figure 1E ; appendix p 7 ). 8 , 16 All patients in this cohort had a hysterectomy, but records on the precise surgical procedure and additional treatment are not available. An experienced gynaecological pathologist (VMA) reviewed the tumours according to the WHO recommendations without knowledge of the clinical outcome. The study of the total population of uterine sarcoma patients in Norway was approved by REK (number S-04298). From 1987 to 2005, 317 consecutive patients underwent open retropubic prostatectomy at the Norwegian Radium Hospital. 9 , 17 One investigator (HW) was responsible for treatment and follow-up. 307 patients were included in the prostate cancer validation cohort ( figure 1F ; appendix p 8 ), and the study was approved by REK (number S-07443a). Only one patient received adjuvant treatment. An experienced uropathologist (LV) reviewed all specimens to obtain a complete set of consistent pathological assessments using established recommendations. 18 , 19 791 tumour samples from consenting patients with endometrial carcinoma who were treated between 2001 and 2011 in the Molecular Markers in Treatment of Endometrial Cancer (MoMaTEC) trial ( NCT00598845 ) were included in the endometrial carcinoma validation cohort ( figure 1G ; appendix p 9 ). 10 767 patients had hysterectomy, three patients had tumour reduction, and 21 patients had curettage. The number of patients who received adjuvant treatment and the types of adjuvant treatments are described in the appendix (p 27) . Curettage specimens were preoperatively assessed to obtain a histological risk classification. REK approved the study (number 052.01), and the 2009 FIGO staging criteria were applied to determine FIGO stage. The pathology analyses were done by pathologists at the participating centres in the trial.
Show full methods section
Machine learning algorithms analysed the chromatin organisation in 461 000 images of tumour cell nuclei stained for DNA from 390 patients (discovery cohort) treated for stage I or II colorectal cancer at the Aker University Hospital (Oslo, Norway). The resulting marker of chromatin heterogeneity, termed Nucleotyping, was subsequently independently validated in six patient cohorts: 442 patients with stage I or II colorectal cancer in the Gloucester Colorectal Cancer Study (UK); 391 patients with stage II colorectal cancer in the QUASAR 2 trial; 246 patients with stage I ovarian carcinoma; 354 patients with uterine sarcoma; 307 patients with prostate carcinoma; and 791 patients with endometrial carcinoma. The primary outcome was cancer-specific survival.
Methods
Patient cohorts Between 1993 and 2003, 494 consecutive patients with primary colorectal cancer at Aker University Hospital (Oslo, Norway) had resection of non-synchronous stage I and II tumours. 11 , 12 390 of these patients were included in our discovery cohort ( figure 1A ; table 1 ). Two (72 200 (51%) 212 (48%) 58 (15%) Sex Female 192 (49%) 204 (46%) 161 (41%) Male 198 (51%) 238 (54%) 230 (59%) Stage I 112 (29%) 83 (19%) 0 II 278 (71%) 359 (81%) 391 (100%) Histological grade 1 37 (10%) 120 (27%) 15 (4%) 2 315 (82%) 257 (58%) 282 (77%) 3 34 (9%) 65 (15%) 68 (19%) Pathologic tumour (T) stage T1 23 (6%) 14 (3%) 0 T2 89 (23%) 68 (15%) 0 T3 261 (67%) 236 (54%) 190 (51%) T4 17 (4%) 123 (28%) 185 (49%) Microsatellite stability Unstable 63 (17%) NA 62 (17%) Stable 300 (83%) NA 306 (83%) Location Rectum 118 (30%) 131 (30%) 44 (12%) Distal colon 116 (30%) 162 (37%) 142 (38%) Proximal colon 156 (40%) 149 (34%) 188 (50%) Surgery type Elective 354 (91%) 366 (85%) NA Acute * 36 (9%) 65 (15%) NA Chromatin heterogeneity Homogeneous 235 (60%) 308 (70%) 244 (62%) Heterogeneous 155 (40%) 134 (30%) 147 (38%) Data are median (IQR) or number (%). NA=data not available. * Acute surgery was done because of obstruction or perforation of the bowel at presentation in the discovery cohort, and defined as either urgent or emergency surgery in the Gloucester validation cohort. The Gloucester colorectal cancer validation cohort included 442 of the 467 patients with non-synchronous stage I or II colorectal cancer from the Gloucester Colorectal Cancer Study (UK), who were recruited between 1988 and 1996 ( figure 1B , table 1 ). 13 , 14 Data on adjuvant radiotherapy and chemotherapy were available for 310 (70%) patients, of whom 23 (7%) received adjuvant treatment and 287 (93%) did not. Total mesorectal excision was done in most patients with rectal cancer (n=131), and six (5%) patients with rectal cancer received neoadjuvant treatment. None of the patients with colon cancer (n=311) received neoadjuvant treatment. This study was approved by the Gloucestershire Local Research Ethics Committee (number 01/21G) and REK in Norway (number 2015/1606), and the pathology analyses were done by an expert pathologist (NAS). The QUASAR 2 trial (ISRCTN registry number ISRCTN45133151) established a biobank that included formalin-fixed, paraffin-embedded tumour tissue blocks from 441 patients with stage II colorectal cancer. 15 Data from 391 patients were available for the second colorectal cancer validation cohort ( figure 1C ; table 1 ). Patients were recruited between 2005 and 2010, and all patients received adjuvant chemotherapy (capecitabine with or without bevacizumab), but none received neoadjuvant treatment. Approval for the study was obtained from the West Midlands Research Ethics Committee (number 04/MRE/11/18) and REK in Norway (number 2015/1607). The pathology assessments were done by pathologists at the participating hospitals in the trial. 246 patients treated for International Federation of Gynecology and Obstetrics (FIGO) stage I ovarian carcinoma between 1982 and 1989 (surgery at county hospitals and evaluation of further treatment at the Norwegian Radium Hospital, a tertiary referral comprehensive cancer centre in Oslo, Norway) were analysed as an ovarian cancer validation cohort ( figure 1D ; appendix p 6 ). 7 All patients provided verbal informed consent, and the study was in accordance with Norwegian law. The surgical procedure consisted of peritoneal washing, hysterectomy, bilateral salpingo-oophorectomy, and omentectomy. The number of patients who received adjuvant treatments and the types of adjuvant treatments are described in the appendix (p 24) . The FIGO stage was reviewed according to 1988 criteria, although para-aortic and pelvic lymphadenectomy was not routinely performed. A single pathologist (VMA) masked to patient outcome reviewed the histological sections using WHO criteria. We confirmed the diagnosis and obtained adequate tumour material from 354 patients with uterine sarcoma reported to the Norwegian Cancer Registry between 1970 and 2000 to make up the uterine sarcoma validation cohort ( figure 1E ; appendix p 7 ). 8 , 16 All patients in this cohort had a hysterectomy, but records on the precise surgical procedure and additional treatment are not available. An experienced gynaecological pathologist (VMA) reviewed the tumours according to the WHO recommendations without knowledge of the clinical outcome. The study of the total population of uterine sarcoma patients in Norway was approved by REK (number S-04298). From 1987 to 2005, 317 consecutive patients underwent open retropubic prostatectomy at the Norwegian Radium Hospital. 9 , 17 One investigator (HW) was responsible for treatment and follow-up. 307 patients were included in the prostate cancer validation cohort ( figure 1F ; appendix p 8 ), and the study was approved by REK (number S-07443a). Only one patient received adjuvant treatment. An experienced uropathologist (LV) reviewed all specimens to obtain a complete set of consistent pathological assessments using established recommendations. 18 , 19 791 tumour samples from consenting patients with endometrial carcinoma who were treated between 2001 and 2011 in the Molecular Markers in Treatment of Endometrial Cancer (MoMaTEC) trial ( NCT00598845 ) were included in the endometrial carcinoma validation cohort ( figure 1G ; appendix p 9 ). 10 767 patients had hysterectomy, three patients had tumour reduction, and 21 patients had curettage. The number of patients who received adjuvant treatment and the types of adjuvant treatments are described in the appendix (p 27) . Curettage specimens were preoperatively assessed to obtain a histological risk classification. REK approved the study (number 052.01), and the 2009 FIGO staging criteria were applied to determine FIGO stage. The pathology analyses were done by pathologists at the participating centres in the trial.
Sample preparation and imaging
Images of cell nuclei were acquired from curettage specimens for patients with endometrial carcinoma and from the surgically resected tumours for all other patients. One of several pathologists selected a representative tumour region for each patient from haematoxylin and eosin-stained sections of the formalin-fixed, paraffin-embedded tumour tissue blocks. To account for heterogeneity, 20 three regions (IQR three to four) from different tumour blocks were included for prostate carcinoma patients. One or more 50 μm sections of each selected tumour region was used to obtain isolated nuclei using a modification of Hedley's method. 21 After rehydration, the sections were enzymatically digested at room temperature at 200 rotations per min (rpm) for 70 min (for colorectal and prostate specimens) or 60 min (for other specimens) with 0·5 mg/mL protease (Sigma protease type XXIV [P5380] or type VIII [P8038]; Sigma Chemical, St Louis, MO, USA) to disaggregate the cells. The cell suspension was filtered through a 60 μm mesh nylon filter, washed, and cytospun (600 rpm for 5 min) onto a poly-l-lysine-coated slide. 22 The nuclei were stained using Feulgen's method, and slides were incubated in 5 M HCl for 60 min at room temperature for hydrolysis, stained with Schiff's solution for 2 h in the dark, rinsed in a fresh solution of 0·5% sodium metabisulfite in 0·05 M hydrochloric acid (three times 10 min), dehydrated, and coverslipped. 21 , 22 Feulgen-stained nuclei were imaged by a Zeiss Axioplan microscope equipped with a 546 nm green filter and a monochrome high-resolution digital camera (AxioCam MrM, Zeiss, Jena, Germany, or C4742-95, Hamamatsu Photonics, Hamamatsu, Japan) with a depth of field of about 1·5 μm. In the resulting images, the value of each pixel reflects the DNA density at that location and is referred to as the pixel grey level. Although the sample preparation method and imaging equipment were similar within each cohort except for the prostate carcinoma cohort, methodological and equipment updates were implemented between work on different sample series, and images from the entire set of cohorts thus have notably different technical features (eg, in image contrast and number of nuclear pixels). Additionally, a single pathologist selected the tumour regions for all patients in the three colorectal carcinoma cohorts, the ovarian carcinoma cohort, and the uterine sarcoma cohort (although the pathologist was not the same across these cohorts), whereas the selections were done by multiple pathologists in each of two other cohorts. The imaged nuclei were assessed to exclude non-representative cells (eg, cut or connected nuclei and non-tumour cells). Trained personnel identified the nuclei of interest in the ovarian carcinoma cohort as those that appeared to be whole, isolated, and epithelial. 7 In all other cohorts, the Ploidy Work Station (PWS, Room4, Sussex, UK) was applied to automatically discard non-intact nuclei (eg, cut, folded, and connected) and to detect cell types. The initial method 23 was used in the uterine sarcoma cohort, and only non-necrotic, intact nuclei were kept for further analysis. 8 The analysis was further restricted to epithelial nuclei in the colorectal, prostate, and endometrial carcinoma cohorts. Trained personnel verified the automatic nucleus classifications in all cohorts, except in the two colorectal cancer validation cohorts because by then we considered the method in PWS to be both robust and accurate enough to allow completely automated identification of non-necrotic, intact epithelial nuclei. If less than 200 nuclei were classified as applicable for further analysis then the specimen was considered of insufficient quality for analysis and excluded. 4·3 million images of cell nuclei from the 2921 analysed patients were included in further analysis, giving an average of about 1200 images per tumour region and about 1500 images per patient. Each image comprised an average of about 3700 nuclear pixels. Because images in different cohorts deviated in contrast and size due to differences in sample preparation methods and imaging equipment, the set of images from each single tumour region was independently normalised using a previously described algorithm that automatically standardises the optical and spatial scales of the images. 9 This normalisation method does not depend on external controls and automatically finds internal controls by estimating which nuclei are diploid. The resulting images had a physical resolution of about 160 nm/pixel and a pixel depth of ten bits.
Nuclear texture analysis
Chromatin organisation was quantified by computing the entropy of pixel grey levels in a subregion of a nucleus ( figure 2 ). Entropy is a measure of disorder commonly used in thermodynamics but applied here to assess whether the chromatin organisation is disordered in the sense of more interleaved chromatin compartments with different condensations. The subregion was taken to be a square region, and the entropy of the region was coupled with the grey level value of the region's centre pixel to integrate measurements of disordered chromatin organisation and DNA content. The frequency in which each pair of entropy and centre grey level occur throughout a nucleus was stored in a two-way table, known as the grey level entropy matrix (GLEM; figure 2A ). 24 Each chromatin pattern (ie, a subregion with concrete values and arrangement of pixel grey levels) corresponded to a specific element in the GLEM. Figure 2 Computation of the grey level entropy matrix (GLEM) and visualisation of nuclear images (A) Illustration of GLEM computation. (1) A nuclear image. (2) Each nuclear pixel is taken to be the centre of a square subregion, here with a side length of nine pixels. (3) For each subregion, two quantities are extracted (the grey level of the centre pixel [here 22] and the entropy of the grey levels in the subregion [here 3·2]); the entropy H is a variability characteristic of the probability mass function P(i) (ie, the histogram that gives the probability P that grey level i occurs in the subregion). (4) The two quantities extracted from the subregion will together identify a position in a two-way table. The table cell position corresponding to the subregion in figure part 3 of panel A is marked by a green circle in part 4 of panel A. The occurrence is counted by incrementing the value at the table cell position (initially, all table cell values are 0), and the computation of the two quantities and incrementation of the corresponding table cell value is performed for every subregion of the nuclear image. The resulting table describes the frequency of each pair of centre grey level and surrounding entropy and is normalised by its total count to provide the bivariate probability mass function called the GLEM. The two-way table visualised in part A4 is the GLEM of the nuclear image in part A1. (B) Depiction of five nuclear images and their chromatin value. The threshold applied to dichotomise the chromatin value was 0·044. GLEMs stratified on nuclear area (grouped at 1–999 pixels, 1000–1999 pixels, …, 9000–9999 pixels, and 10 000 pixels or more) and computed on different scales (subregions of 3 × 3 pixels, 5 × 5 pixels, …, 31 × 31 pixels) were concatenated to form a four-dimensional expansion of the GLEM called GLEM4D. 7 Each pixel in a nucleus is thus the centre of 15 subregions representing the chromatin organisation near the pixel on different magnifications, and the frequency of these chromatin patterns for all pixels in the nucleus is stored in the GLEM4D. The GLEM4D was calculated for each of the 461 000 nuclear images in the discovery cohort, and each patient was represented by the average GLEM4D of the patient's nuclei. Aberrant chromatin patterns were discovered as patterns corresponding to elements in the GLEM4D that were associated with poor prognosis in the discovery cohort. This association was computed for each GLEM4D element as a constant scaling factor multiplied by the statistic of a two-sample t test that tested for the difference between good and poor prognosis in the specific GLEM4D element in the discovery cohort. The applied adaptive machine learning algorithm 25 could then compute the compliance between the GLEM4D representation of a new patient and the discovered patterns of chromatin aberrations by multiplying each GLEM4D element with the corresponding scaled t statistic and summing the products. The result is a continuous value termed the chromatin value, which describes the overall amount of chromatin disorder in a given patient. Finally, the robust minimum Euclidean distance classification method 26 , 27 was applied to calculate a fixed threshold with which to dichotomise the chromatin value into a classification of the tumour as either chromatin homogeneous or chromatin heterogeneous. The threshold was computed using the discovery cohort (0·044), but other thresholds provided markers with similar accuracy in the discovery cohort when measured by hazard ratio, although with different abilities to correctly identify patients as good and poor prognosis ( appendix p 23 ). Complete specification of the method is provided in the appendix (pp 3–4) . Details of Nucleotyping and its testing and validation in clinical cohorts can be found in a webvideo . Example nuclear images and their chromatin values are shown in figure 2B . Nucleotyping could subsequently be applied blindly to label new, individual patients as chromatin homogeneous or chromatin heterogeneous on the basis of the GLEM4Ds computed from its nuclear images. In an average chromatin heterogeneous tumour, 63% (IQR 52–73) of the nuclei expressed aberrant chromatin patterns. The proportion of nuclei required for a tumour to be labelled as chromatin heterogeneous was not fixed because the classification of a tumour sample was based on the average estimated severity of its nuclei (the scaled t statistic of the chromatin patterns in the nucleus), which in turn was calculated as the average severity of all observed chromatin patterns in the nuclear image. Thus, a relatively small proportion of nuclei (minimum in the analysed cohorts was 36%) expressing highly severe chromatin patterns could define the tumour as chromatin heterogeneous, whereas a chromatin homogeneous tumour could have a relatively large proportion of nuclei (maximum in the analysed cohorts was 57%) with chromatin patterns associated with mild disorganisation.
Statistical analysis
We measured cancer-specific survival because it was considered the most clinically relevant endpoint that was common to all patient cohorts. Events are defined, as proposed by Punt and colleagues, 28 exclusively as death from the same cancer. All recurrences are ignored, and patients are censored at all other deaths or loss to follow-up. The follow-up time is computed from the date of entry to date of death or loss to follow-up. Mantel-Cox log-rank test was used in univariable survival analysis, and Wald χ 2 test with Cox proportional hazards model in multivariable analysis. Each analysis included only patients with complete data for the variables in question, but imputation for missing data was subsequently done using multiple imputation by chained equations to assess all patients. The clinical and pathological markers included in multivariable analyses were the same as those that had been used in the previous studies of the individual patient cohorts 7 , 8 , 9 , 10 , 12 or, in case of the colorectal cancer validation cohorts, were the same prognostic markers as those applied to the discovery cohort. Subsequently, number of investigated lymph nodes (
📊 Figures
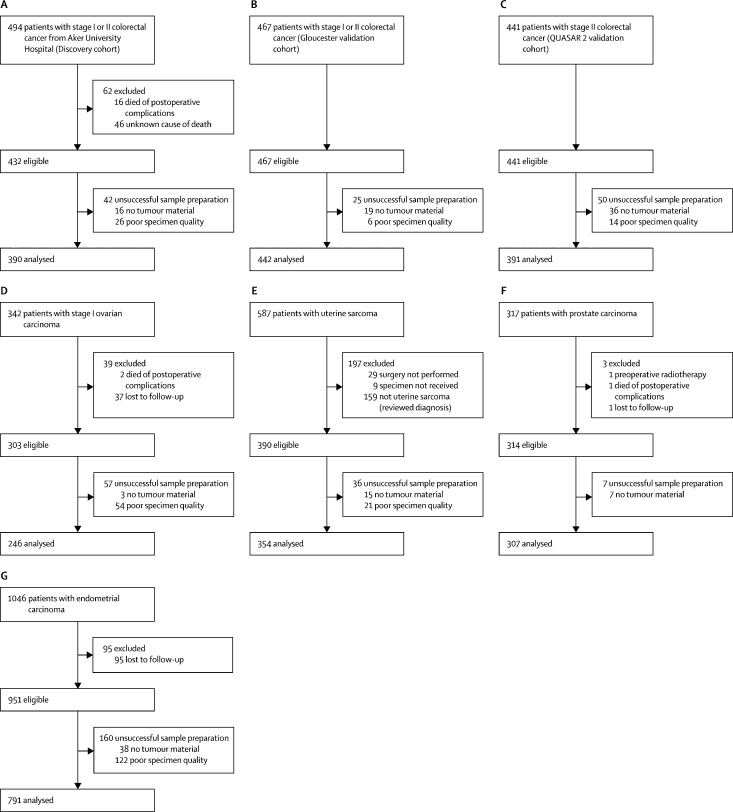
Figure 1
CONSORT diagrams showing the origin of each patient cohort (A) Colorectal cancer discovery cohort. (B) Gloucester colorectal cancer validation cohort. (C) QUASAR 2 colorectal cancer validation cohort....
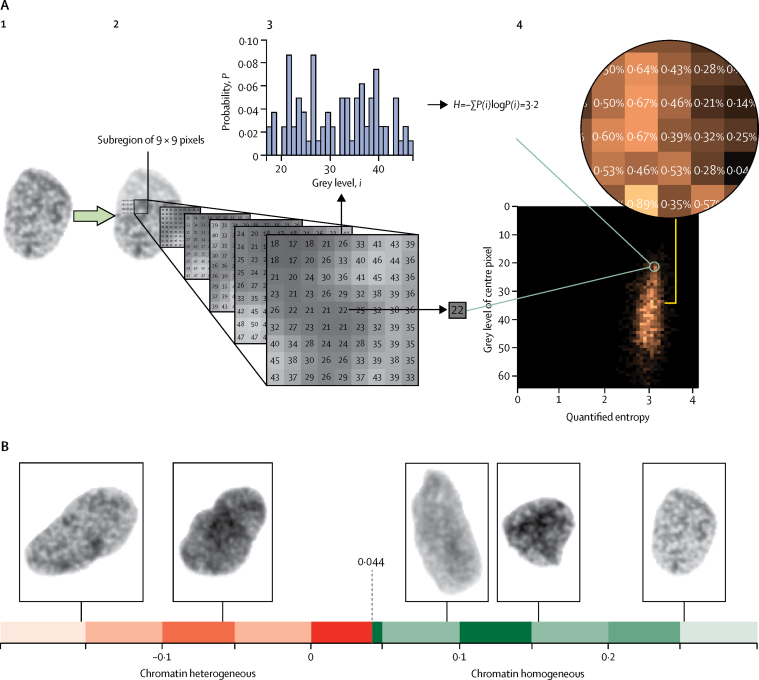
Figure 2
Computation of the grey level entropy matrix (GLEM) and visualisation of nuclear images (A) Illustration of GLEM computation. (1) A nuclear image. (2) Each nuclear pixel is taken to be the centre of a...
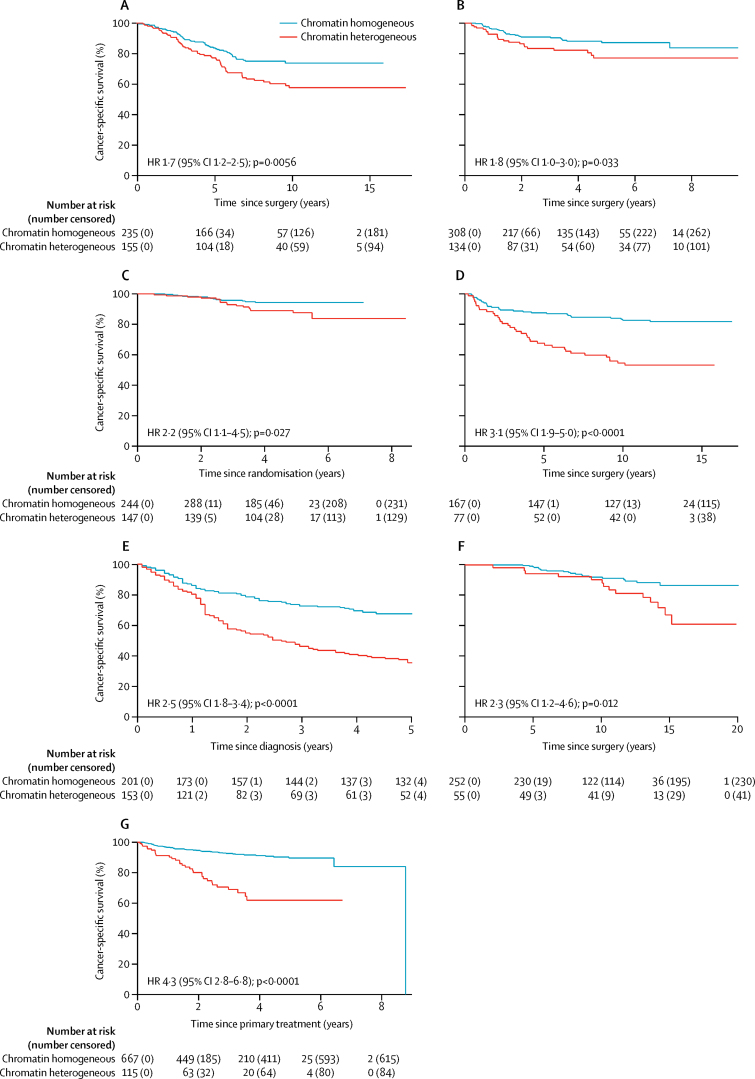
Figure 3
Kaplan-Meier analysis of cancer-specific survival in patients with chromatin homogeneous and chromatin heterogeneous tumours (A) Discovery cohort for colorectal cancer. (B) Gloucester validation cohor...
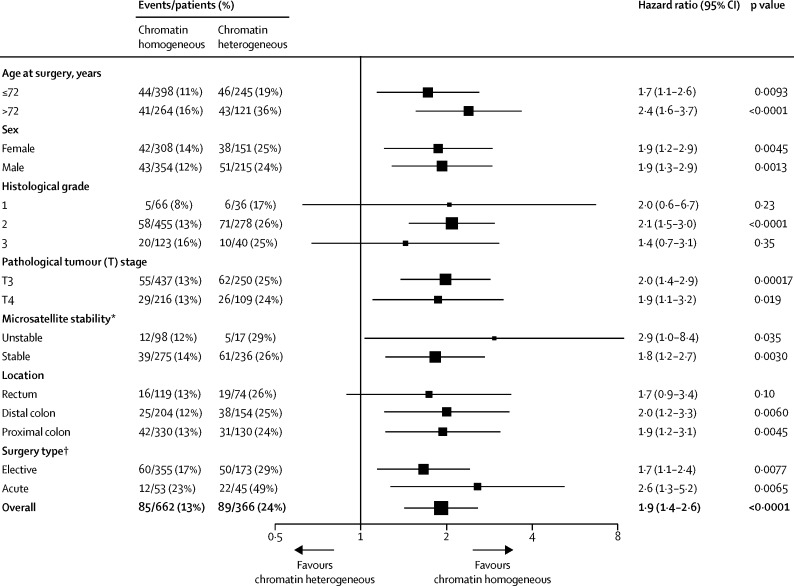
Figure 4
Forest plot of chromatin heterogeneity for all stage II colorectal cancer patients in analysis of cancer-specific survival *Microsatellite stability data were not available for the Gloucester validati...
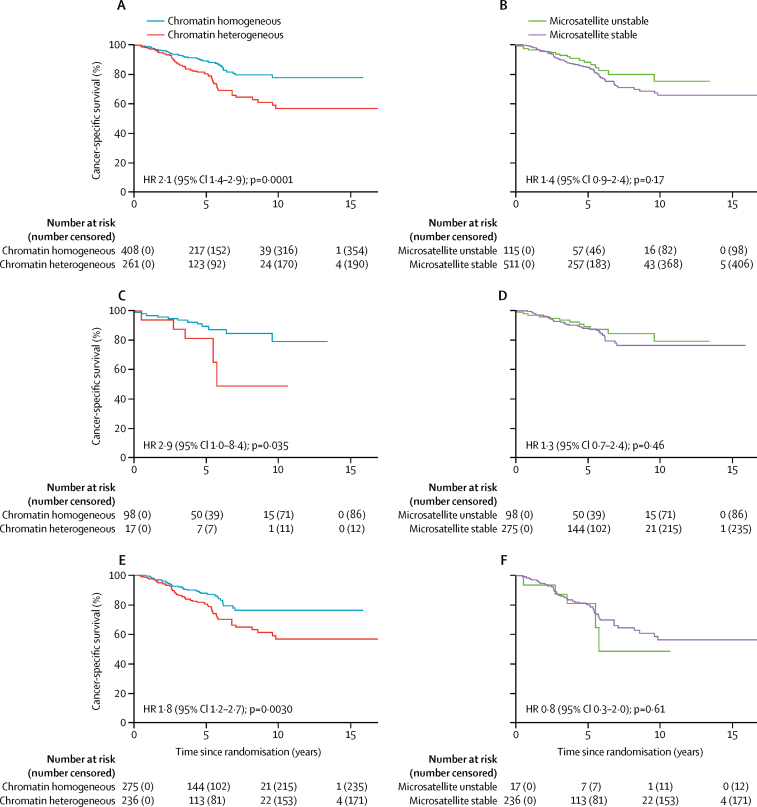
Figure 5
Cancer-specific survival of stage II colorectal cancer patients according to Nucleotyping and microsatellite stability Kaplan-Meier curves according to (A) Nucleotyping, (B) microsatellite stability, ...
Figure images are served from the NIH/NLM PubMed Central Open Access Subset or Europe PMC; copyright remains with the publishers and authors.
💬 Discussion
0 commentsNo comments yet. Be the first to start a discussion!
Leave a Comment