Abstract
BACKGROUND: Analysis of ciliary function for assessment of patients suspected of primary ciliary dyskinesia (PCD) and for research studies of respiratory and ependymal cilia requires assessment of both ciliary beat pattern and beat frequency. While direct measurement of beat frequency from high-speed video recordings is the most accurate and reproducible technique it is extremely time consuming. The aim of this study was to develop a freely available automated method of ciliary beat frequency analysis from digital video (AVI) files that runs on open-source software (ImageJ) coupled to Microsoft Excel, and to validate this by comparison to the direct measuring high-speed video recordings of respiratory and ependymal cilia. These models allowed comparison to cilia beating between 3 and 52 Hz. METHODS: Digital video files of motile ciliated ependymal (frequency range 34 to 52 Hz) and respiratory epithelial cells (frequency 3 to 18 Hz) were captured using a high-speed digital video recorder. To cover the range above between 18 and 37 Hz the frequency of ependymal cilia were slowed by the addition of the pneumococcal toxin pneumolysin. Measurements made directly by timing a given number of individual ciliary beat cycles were compared with those obtained using the automated ciliaFA system. RESULTS: The overall mean difference (± SD) between the ciliaFA and direct measurement high-speed digital imaging methods was -0.05 ± 1.25 Hz, the correlation coefficient was shown to be 0.991 and the Bland-Altman limits of agreement were from -1.99 to 1.49 Hz for respiratory and from -2.55 to 3.25 Hz for ependymal cilia. CONCLUSIONS: A plugin for ImageJ was developed that extracts pixel intensities and performs fast Fourier transformation (FFT) using Microsoft Excel. The ciliaFA software allowed automated, high throughput measurement of respiratory and ependymal ciliary beat frequency (range 3 to 52 Hz) and avoids operator error due to selection bias. We have included free access to the ciliaFA plugin and installation instructions in Additional file 1 accompanying this manuscript that other researchers may use.
🧪 Sample Preparation
🔬 Cell Lines
🏭 Microscope Brands
🧪 Reagent Suppliers
💻 Software Details
🏛️ Research Organizations (ROR)
Affiliated research institutions:
📋 Methods
Digital video files of motile ciliated ependymal (frequency range 34 to 52 Hz) and respiratory epithelial cells (frequency 3 to 18 Hz) were captured using a high-speed digital video recorder. To cover the range above between 18 and 37 Hz the frequency of ependymal cilia were slowed by the addition of the pneumococcal toxin pneumolysin. Measurements made directly by timing a given number of individual ciliary beat cycles were compared with those obtained using the automated ciliaFA system.
Methods Ependyma tissue preparation
Vibratome sections (250 μm thick) of the floor of the fourth ventricle of the brains of infant Wistar rats (between 9 and 15 days of age) were prepared to allow ependymal cilia to be viewed on an inverted microscope using a × 40 objective lens. Each section was submerged under 4 ml of media 199 (M199, Gibco, Invitrogen, Paisley, UK), as described previously [ 16 ].
Human respiratory cilia
Human respiratory epithelium was obtained by brushing the inferior nasal turbinate with a 2-mm cytology brush (Keymed, Southend-on-Sea, UK) as previously described [ 7 ]. Cells were dislodged from the brush into M199 medium and grown to a ciliated phenotype at air-liquid interface as previously described [ 17 ]. Ethical approval for the collection of nasal epithelial cells was given by the Leicestershire Ethical Review Committee.
Measurement of CBF
To determine ciliary beat frequency, both the brain slices and the respiratory cells in culture were placed in an incubation (37°C) chamber and were observed via an inverted microscope system (Nikon TU1000, Kingston-upon-Thames, UK). Tissue was allowed to equilibrate for 30 minutes before readings. Beating cilia were recorded using a Motion Pro X4 digital high-speed video camera (Lake Image Systems, Henrietta, N.Y. USA) at a rate of 250 to 500 frames per second using an × 40 objective as previously described [ 18 ]. At least 512 or 1,024 frames were captured, respectively. The camera allows video sequences to be recorded and played back at reduced frame rates or frame by frame. CBF is calculated by the observer timing a given number of individual cilia beat cycles using the following equation: Frame rate (number of frames/sec)/5 (frames elapsed for five ciliary beat cycles) × 5 (conversion per beat cycle). Inhibition of CBF To evaluate beat frequencies between the upper limit of normal (approximately 16 Hz) for respiratory cilia and the lower limit of normal for ependymal cilia (approximately 36 Hz) we slowed ependymal ciliary beat frequency by the addition of the pneumococcal toxin, pneumolysin. We have previously shown pneumolysin to reduce ependymal ciliary beat frequency [ 4 ]. Pneumolysin was purified as previously described [ 19 ]. Cells were exposed to 1 ml M199 containing 300 ng of pneumolysin, which was preheated to 37°C. The CBF was measured at intervals of 0, 5, and 15 minutes over the course of the experiment. At each time point, images were captured from four different areas along the ciliated edge of the brain slice. Software development To develop software to batch-process and calculate CBF, we focused on two core components: the first was to extract the pixel intensities of particular region of interest (ROI) over time and the second to use this data for fast Fourier transformation (FFT). We used the freely available open-source ImageJ software to determine the average pixel intensity of up to 40 × 40 ROI per frame of the AVI file [ 20 ]. The ciliaFA plugin exports a dataset of up to 1,600 ROI to Excel 2007 (Microsoft; Redmond, WA, USA) where a visual basic macro is initiated to perform the FFT. The complex number is translated using the Excel function ‘=IMABS(range)’ and the dominant frequency within the range is then established using the function ‘=MAX(range)’. The CBF is determined by multiplying the row number by the frequency resolution (FR) (frame rate of recording/number of frames), which we named the ‘FFT Mag’. In order to more accurately predict the CBF, we averaged the sum of the FFT Mag of the peaks flanking the maximum (see Figure 1 B). Noise reduction We found that excluding data based on the following criteria significantly reduced the effect of background interference that can result from Fourier analysis: (1) the amplitude of the peak must be greater than three times the amplitude of the background (defined as the maximum peak of the first three FFT Mag), (2) the CBF must be within a clinically relevant range (for example between 3 to 20 Hz for respiratory cilia and 3 to 60 Hz for brain ependymal cilia). Data that does not support these criteria was defined as 0 Hz. The resulting Excel data sheet presents the CBF calculations as a report that allows the observer to obtain information about individual regions of interest or the image as a whole. Raw data (including pixel intensities and the power spectrum of the FFT (Figure 1 B)) from individual regions of interest can be inspected using a drop-down menu. The results report displays the mean, median and modal CBFs of the field, and a histogram of the CBF of all regions of interest (Figure 2 A). A color chart of the intensity of the CBF for each regions of interest is also presented in Figure 2 B. Figure 2 Data analysis of one. AVI file of ependymal cilia before ( A ), and 15 minutes ( B ) after the addition of the bacterial toxin, pneumolysin. Images show (i) the area of brain tissue investigated, (ii) the regions of interest (ROI) used for analysis (color coding shows the intensity of the ciliary beat frequency (CBF) for each ROI: the darker the displayed color, the higher the CBF) and (iii) a histogram of the CBF of all regions of interest.
Show full methods section
Digital video files of motile ciliated ependymal (frequency range 34 to 52 Hz) and respiratory epithelial cells (frequency 3 to 18 Hz) were captured using a high-speed digital video recorder. To cover the range above between 18 and 37 Hz the frequency of ependymal cilia were slowed by the addition of the pneumococcal toxin pneumolysin. Measurements made directly by timing a given number of individual ciliary beat cycles were compared with those obtained using the automated ciliaFA system.
Methods Ependyma tissue preparation
Vibratome sections (250 μm thick) of the floor of the fourth ventricle of the brains of infant Wistar rats (between 9 and 15 days of age) were prepared to allow ependymal cilia to be viewed on an inverted microscope using a × 40 objective lens. Each section was submerged under 4 ml of media 199 (M199, Gibco, Invitrogen, Paisley, UK), as described previously [ 16 ].
Human respiratory cilia
Human respiratory epithelium was obtained by brushing the inferior nasal turbinate with a 2-mm cytology brush (Keymed, Southend-on-Sea, UK) as previously described [ 7 ]. Cells were dislodged from the brush into M199 medium and grown to a ciliated phenotype at air-liquid interface as previously described [ 17 ]. Ethical approval for the collection of nasal epithelial cells was given by the Leicestershire Ethical Review Committee.
Measurement of CBF
To determine ciliary beat frequency, both the brain slices and the respiratory cells in culture were placed in an incubation (37°C) chamber and were observed via an inverted microscope system (Nikon TU1000, Kingston-upon-Thames, UK). Tissue was allowed to equilibrate for 30 minutes before readings. Beating cilia were recorded using a Motion Pro X4 digital high-speed video camera (Lake Image Systems, Henrietta, N.Y. USA) at a rate of 250 to 500 frames per second using an × 40 objective as previously described [ 18 ]. At least 512 or 1,024 frames were captured, respectively. The camera allows video sequences to be recorded and played back at reduced frame rates or frame by frame. CBF is calculated by the observer timing a given number of individual cilia beat cycles using the following equation: Frame rate (number of frames/sec)/5 (frames elapsed for five ciliary beat cycles) × 5 (conversion per beat cycle). Inhibition of CBF To evaluate beat frequencies between the upper limit of normal (approximately 16 Hz) for respiratory cilia and the lower limit of normal for ependymal cilia (approximately 36 Hz) we slowed ependymal ciliary beat frequency by the addition of the pneumococcal toxin, pneumolysin. We have previously shown pneumolysin to reduce ependymal ciliary beat frequency [ 4 ]. Pneumolysin was purified as previously described [ 19 ]. Cells were exposed to 1 ml M199 containing 300 ng of pneumolysin, which was preheated to 37°C. The CBF was measured at intervals of 0, 5, and 15 minutes over the course of the experiment. At each time point, images were captured from four different areas along the ciliated edge of the brain slice. Software development To develop software to batch-process and calculate CBF, we focused on two core components: the first was to extract the pixel intensities of particular region of interest (ROI) over time and the second to use this data for fast Fourier transformation (FFT). We used the freely available open-source ImageJ software to determine the average pixel intensity of up to 40 × 40 ROI per frame of the AVI file [ 20 ]. The ciliaFA plugin exports a dataset of up to 1,600 ROI to Excel 2007 (Microsoft; Redmond, WA, USA) where a visual basic macro is initiated to perform the FFT. The complex number is translated using the Excel function ‘=IMABS(range)’ and the dominant frequency within the range is then established using the function ‘=MAX(range)’. The CBF is determined by multiplying the row number by the frequency resolution (FR) (frame rate of recording/number of frames), which we named the ‘FFT Mag’. In order to more accurately predict the CBF, we averaged the sum of the FFT Mag of the peaks flanking the maximum (see Figure 1 B). Noise reduction We found that excluding data based on the following criteria significantly reduced the effect of background interference that can result from Fourier analysis: (1) the amplitude of the peak must be greater than three times the amplitude of the background (defined as the maximum peak of the first three FFT Mag), (2) the CBF must be within a clinically relevant range (for example between 3 to 20 Hz for respiratory cilia and 3 to 60 Hz for brain ependymal cilia). Data that does not support these criteria was defined as 0 Hz. The resulting Excel data sheet presents the CBF calculations as a report that allows the observer to obtain information about individual regions of interest or the image as a whole. Raw data (including pixel intensities and the power spectrum of the FFT (Figure 1 B)) from individual regions of interest can be inspected using a drop-down menu. The results report displays the mean, median and modal CBFs of the field, and a histogram of the CBF of all regions of interest (Figure 2 A). A color chart of the intensity of the CBF for each regions of interest is also presented in Figure 2 B. Figure 2 Data analysis of one. AVI file of ependymal cilia before ( A ), and 15 minutes ( B ) after the addition of the bacterial toxin, pneumolysin. Images show (i) the area of brain tissue investigated, (ii) the regions of interest (ROI) used for analysis (color coding shows the intensity of the ciliary beat frequency (CBF) for each ROI: the darker the displayed color, the higher the CBF) and (iii) a histogram of the CBF of all regions of interest.
Statistical analysis
Linear regression was used to correlate CBF measurements made by conventional frame by frame counting of individual ciliary beat cycles by slow-motion playback of digital high-speed video sequences to measurements obtained using the ciliaFA system (for the same region of interest). All regions of interest were chosen based on areas where optimal images of moving cilia were visible to the observer. The video sequences were reanalyzed by a second observer. Paired t tests were performed to compare the CBF obtained using the two methods and the Bland-Altman limits of agreement were calculated from the mean difference ± the 95% confidence intervals between the two methods.
Supplementary Material Additional file 1 This folder contains all the files needed for successful installation of the ImageJ plugin ‘ciliaFA’. These include: the ciliaFA installation guide, a ciliaFA free software license agreement, the ciliaFA.txt and ExcelRunTest.java program files, and the Excel files needed to process the data. Click here for file
📊 Figures
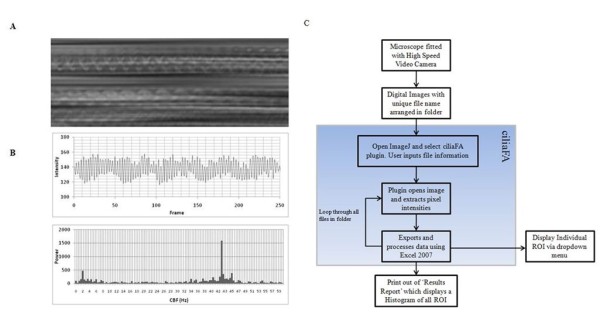
Figure 1
(A) Diagrammatic view of the change in light intensity surrounding motile cilia constructed using the Volume Viewer plugin for ImageJ. (B) Rhythmic changes in light intensity are extracted as pixel in...
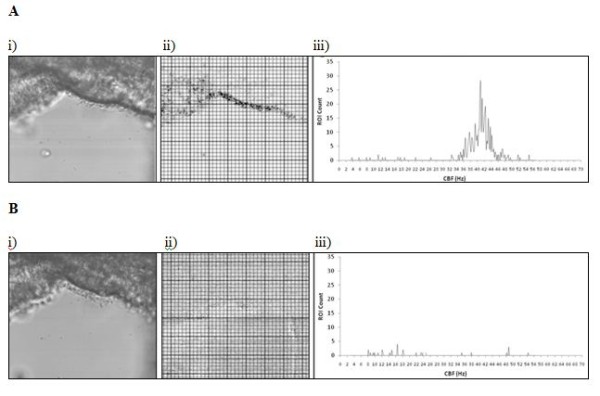
Figure 2
Data analysis of one. AVI file of ependymal cilia before ( A ), and 15u2009minutes ( B ) after the addition of the bacterial toxin, pneumolysin. Images show (i) the area of brain tissue investigated, ...
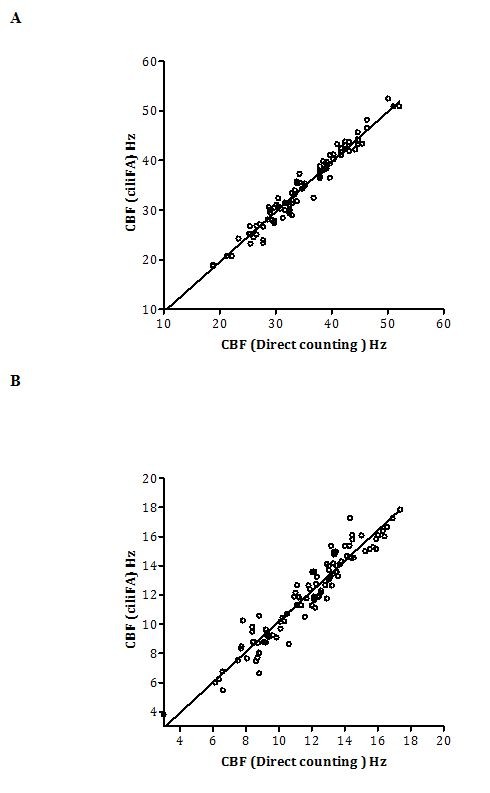
Figure 3
Linear regression of the mean ciliary beat frequency (CBF) measurements by conventional frame by frame counting of individual ciliary beat cycles (direct counting method) compared with the ciliaFA sys...
Figure images are served from the NIH/NLM PubMed Central Open Access Subset or Europe PMC; copyright remains with the publishers and authors.
💬 Discussion
0 commentsNo comments yet. Be the first to start a discussion!
Leave a Comment