Abstract
AbstractThe molecular machinery of life is founded on chiral building blocks, but no experimental technique is currently available to distinguish or monitor chiral systems in live cell bio-imaging studies. Luminescent chiral molecules encode a unique optical fingerprint within emitted circularly polarized light (CPL) carrying information about the molecular environment, conformation, and binding state. Here, we present a CPL Laser Scanning Confocal Microscope (CPL-LSCM) capable of simultaneous chiroptical contrast based live-cell imaging of endogenous and engineered CPL-active cellular probes. Further, we demonstrate that CPL-active probes can be activated using two-photon excitation, with complete CPL spectrum recovery. The combination of these two milestone results empowers the multidisciplinary imaging community, allowing the study of chiral interactions on a sub-cellular level in a new (chiral) light.
🔬 Techniques
💻 Software
✨ Fluorophores
🧪 Sample Preparation
🔬 Cell Lines
🏭 Microscope Brands
🧪 Reagent Suppliers
📷 Detectors
💻 Software Details
🏛️ Research Organizations (ROR)
Affiliated research institutions:
📋 Methods
EDCC imaging
Microscope control and image acquisition and analysis were performed with Leica’s commercial microscope software LAS-X. EDCC imaging is achieved using ImageJ software (v1.49) 31 , with its built-in image calculator add-on software by subtracting one CPL channel from the other, and vice versa. The convention used herein is: left-handed enantioselective contrast = left CPL—right CPL. Right-handed enantioselective contrast = right CPL—left CPL. Images for a typical 1024 × 1024 pixel FOV with 10 line accumulation bidirectional scanning sequence were typically acquired in 90 s (corresponding to 10 full-frame accumulations). Confocality—axial (z) resolution—was governed by the applied pinhole diameter denoted in Airy disk units to preserve resolution and maximise light detection from the FOV. Images were obtained using the detector saturation mode of LAS-X where each image is assessed for maximum intensity value. Each image is only recorded if no 4 × 4 pixel cluster (Nyquist sampling covering an area determined by the systems optical resolution, 126 × 126 nm at 355 nm excitation using 1.4 NA objective) possesses average intensity values of 255 on an 8-bit greyscale. This allows the employed gain of each detector to be synchronised and kept constant, so no error associated with pixel intensity saturation is included accidentally contributing to pixel uncertainties, lowering S/N and exponentially increasing the limit of detection values. Non-live cell 8-bit average pixel chiroptical contrast value calculations were facilitated by selecting and averaging five different positions non-overlapping equal size and shape arbitrary area of the sample with respect to each enantiomer and dark background. Due to the 1024 × 1024 pixel size of each recorded image total FOV, this arbitrary area has been kept at a constant area of 100 × 100 pixels region of interest (ROI). The average maximum 8-bit grayscale pixel intensity values were determined using the LSCM’s built-in LAS-X software that is employing a maximum average value ROI histogram methodology that is based on standard Gaussian distribution profiling of the average intensity values. Due to the employed methodology and the averaging nature of image acquisition and ROI calculation the limit of detection (error associated with) 8-bit greyscale contrast value is below 1% (
Show full methods section
EDCC imaging
Microscope control and image acquisition and analysis were performed with Leica’s commercial microscope software LAS-X. EDCC imaging is achieved using ImageJ software (v1.49) 31 , with its built-in image calculator add-on software by subtracting one CPL channel from the other, and vice versa. The convention used herein is: left-handed enantioselective contrast = left CPL—right CPL. Right-handed enantioselective contrast = right CPL—left CPL. Images for a typical 1024 × 1024 pixel FOV with 10 line accumulation bidirectional scanning sequence were typically acquired in 90 s (corresponding to 10 full-frame accumulations). Confocality—axial (z) resolution—was governed by the applied pinhole diameter denoted in Airy disk units to preserve resolution and maximise light detection from the FOV. Images were obtained using the detector saturation mode of LAS-X where each image is assessed for maximum intensity value. Each image is only recorded if no 4 × 4 pixel cluster (Nyquist sampling covering an area determined by the systems optical resolution, 126 × 126 nm at 355 nm excitation using 1.4 NA objective) possesses average intensity values of 255 on an 8-bit greyscale. This allows the employed gain of each detector to be synchronised and kept constant, so no error associated with pixel intensity saturation is included accidentally contributing to pixel uncertainties, lowering S/N and exponentially increasing the limit of detection values. Non-live cell 8-bit average pixel chiroptical contrast value calculations were facilitated by selecting and averaging five different positions non-overlapping equal size and shape arbitrary area of the sample with respect to each enantiomer and dark background. Due to the 1024 × 1024 pixel size of each recorded image total FOV, this arbitrary area has been kept at a constant area of 100 × 100 pixels region of interest (ROI). The average maximum 8-bit grayscale pixel intensity values were determined using the LSCM’s built-in LAS-X software that is employing a maximum average value ROI histogram methodology that is based on standard Gaussian distribution profiling of the average intensity values. Due to the employed methodology and the averaging nature of image acquisition and ROI calculation the limit of detection (error associated with) 8-bit greyscale contrast value is below 1% (
📊 Figures
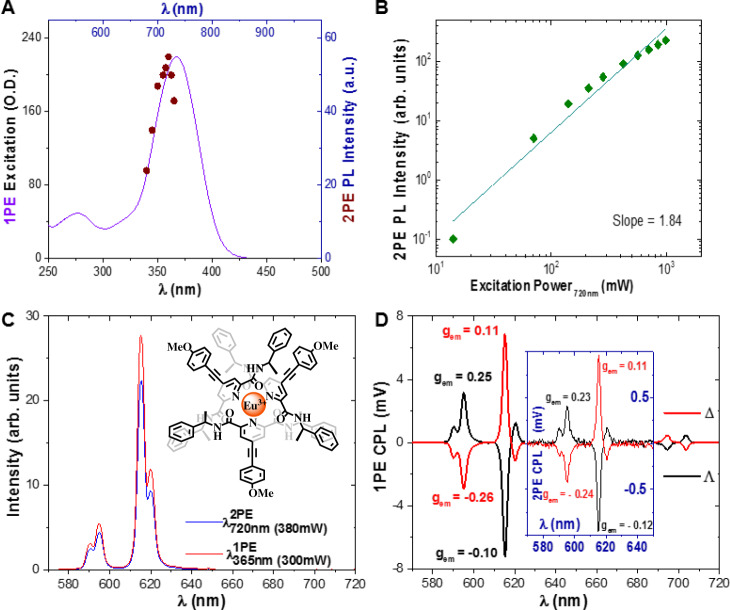
Fig. 1
Key photophysical parameters and spectra of u039b- and u0394-modified Eu:BPEPC in MeOH.
A One photon excitation (solid purple line) and two-photon excitation (maroon dots) spectra (u03bb em =u2009615u2009nm) of modified Eu:BPEPC. B Excitation power dependency (green diamonds) of the 2PE ...
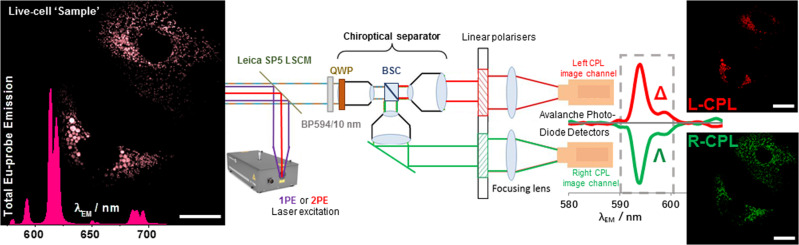
Fig. 2
Simplified depiction of the CPL-LSCM developed for enantioselective differential chiral contrast (EDCC) imaging.
The external CPL-LCSM module is attached to a commercial LSCM via a dedicated external (X1) port to facilitate simultaneous parallel diffraction-limited enantioselective imaging of CPL-active probes w...
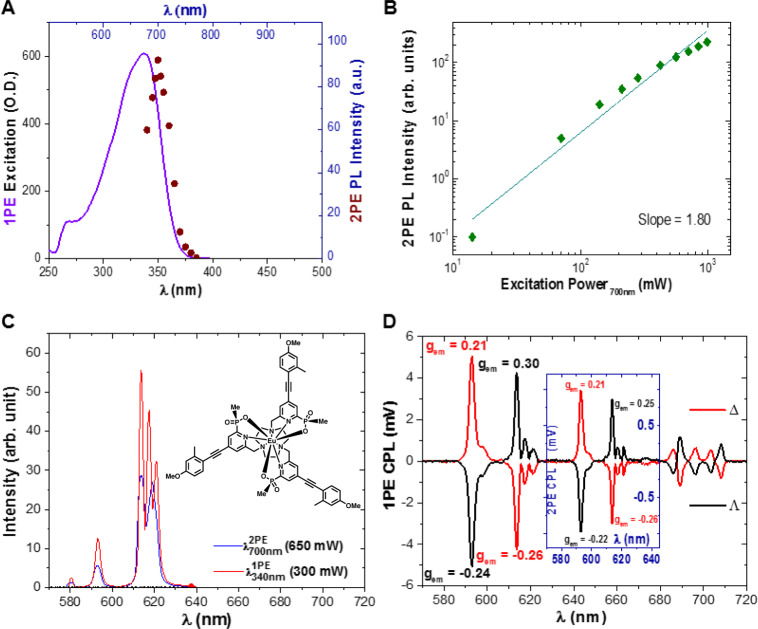
Fig. 3
Key photophysical parameters and spectra of u039b- and u0394 Eu:L1 in NMP.
A One photon excitation ( u03bb em =u2009615u2009nm) (solid purple line) and two-photon excitation (maroon dots) spectra ( u03bb em =u2009615u2009nm) of Eu:L1. B Excitation power dependency (green dia...
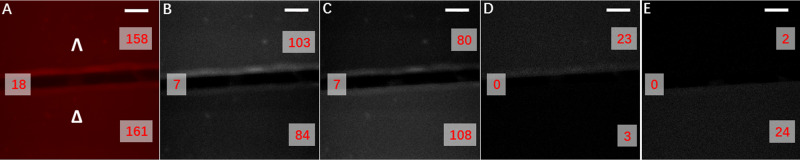
Fig. 4
Enantioselective differential chiral contrast (EDCC) CPL-LSCM of u039b- and u0394-Eu:L1 on a glass substrate.
A Total europium emission ( u03bb ex =u2009355u2009nm, 20u2009mW, u03bb em =u2009589 to 720u2009nm). B , C Left and Right Handed CPL channel respectively ( u03bb em =u2009589 to 599u2009nm). D Left-ha...
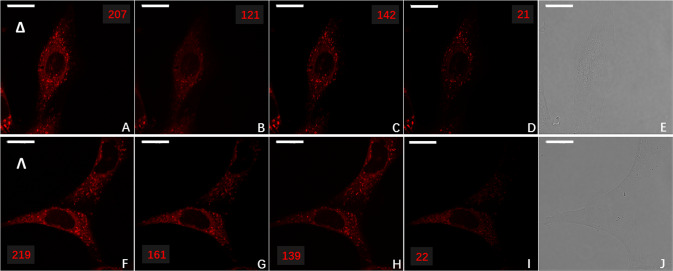
Fig. 5
Enantioselective localisation of enantiopure europium complex, Eu:L1 to the lysosome or mitochondria in live NIH 3T3 cells.
Enantioselective differential chiral contrast (EDCC) CPL-LSCM of Eu:L1 (30u2009u00b5M, 14u2009h loading, u00d763 1.4 NA oil objective, 96u2009u00d7u200996u2009u00b5m FOV, 100u2009avg., 790u2009nm axia...
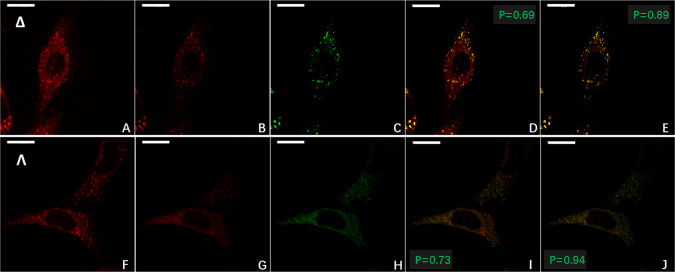
Fig. 6
Enantioselective co-localisation of Eu:L1 with achiral commercial co-stains in live NIH 3T3 cells.
Live cell enantioselective differential chiral contrast (EDCC) co-localisation CPL-LSCM of Eu:L1 with commercial co-stains ( u03bb ex =u2009488u2009nm, 2u2009mW, u03bb em =u2009500 to 530u2009nm) in N...
Figure images are served from the NIH/NLM PubMed Central Open Access Subset or Europe PMC; copyright remains with the publishers and authors.
💬 Discussion
0 commentsNo comments yet. Be the first to start a discussion!
Leave a Comment