Abstract
We used electron cryo-tomography and subtomogram averaging to investigate the structure of complex I and its supramolecular assemblies in the inner mitochondrial membrane of mammals, fungi, and plants. Tomographic volumes containing complex I were averaged at ∼4 nm resolution. Principal component analysis indicated that ∼60% of complex I formed a supercomplex with dimeric complex III, while ∼40% were not associated with other respiratory chain complexes. The mutual arrangement of complex I and III2 was essentially conserved in all supercomplexes investigated. In addition, up to two copies of monomeric complex IV were associated with the complex I1III2 assembly in bovine heart and the yeast Yarrowia lipolytica, but their positions varied. No complex IV was detected in the respiratory supercomplex of the plant Asparagus officinalis Instead, an ∼4.5-nm globular protein density was observed on the matrix side of the complex I membrane arm, which we assign to γ-carbonic anhydrase. Our results demonstrate that respiratory chain supercomplexes in situ have a conserved core of complex I and III2, but otherwise their stoichiometry and structure varies. The conserved features of supercomplex assemblies indicate an important role in respiratory electron transfer.
🔬 Techniques
🧬 Organisms
💻 Software
🏭 Microscope Brands
💻 Software Details
💾 Data Repositories
🏛️ Research Organizations (ROR)
Affiliated research institutions:
📋 Methods
Isolation of Mitochondria. Bovine heart mitochondria were isolated in 0.25 M sucrose and 0.1 M Tris⋅HCl, pH 7.4 ( 50 , 51 ). Yeast mitochondria were isolated from Y. lipolytica strain E129 in 0.6 M sorbitol and 0.1 M Tris⋅HCl, pH 7.4 ( 31 ). White asparagus shoots were purchased at a local supermarket and ground in a Waring blender in 400 mM mannitol, 25 mM Mops–KOH, pH 7.8, 10 mM EDTA, 10 mM DTT, 1% (wt/vol) PVP-40, and 0.01% (wt/vol) BSA (fatty acid-free), with added protease inhibitors. Mitochondria were isolated, fragmented, and washed in 400 mM mannitol, 10 mM Mops–KOH, pH 7.4, and 1 mM EDTA essentially as described for potato tubers ( 31 ), except that a self-forming Percoll density gradient (28%) was used instead of a step gradient. Sample Preparation for Cryo-ET. For bovine heart and Yarrowia , 20 µL of isolated mitochondria at a concentration of 4–5 mg/mL was diluted with 25 vol of osmotic shock buffer (10 mM Tris, pH 7.8). Asparagus mitochondria were diluted with 25 vol of SEM buffer (250 mM sucrose, 10 mM Mops–KOH, pH 7.2, 1 mM EDTA). Membrane fragments were pelleted by centrifugation (13,000 × g at 4 °C for 20 min) and resuspended in 15 µL of buffer. The suspension was mixed 1:1 with Fiducial markers (6- or 10-nm gold particles conjugated to protein A; Aurion) before being applied to glow-discharged quantifoil grids (R2/2) and plunge-frozen in liquid ethane using a home-made guillotine ( 52 ). Data Collection. Tomograms were collected as described ( 52 ) using a Krios transmission electron microscope (FEI) operating at 300 kV in microprobe mode. Single-axis tilt series (±60°, 1.5° intervals, start angle of 24°) were recorded on a K2 summit detector with postcolumn energy filter (Gatan Quantum 976) at a slit width of 20 eV. Nominal magnification in EFTEM mode was 33,000 (0.43 nm/px) for Y. lipolytica and 44,000 (0.33 nm/px) for bovine and asparagus membranes. Exposure times were adjusted automatically during tilt series acquisition to maintain a constant dose of 8 e − /px. The total dose per tilt series was kept below 80 e − /Å 2 . All tilt series were collected at 4- to 6-µm defocus with the automatic data collection program Latitude (Gatan). Tomogram Reconstruction and Subtomogram Averaging. Tilt series were aligned and tomograms were reconstructed using IMOD ( 53 ). Contrast was enhanced by nonlinear anisotropic diffusion ( 54 ). Subvolumes containing complex I were extracted from the unfiltered tomogram and aligned in PEET ( 55 ) using predefined angles calculated from the vector describing the position of the peripheral arm in relation to the membrane. Initial alignment was restricted to ±180° about the axis of the peripheral arm, using a single subvolume as initial reference. Subsequent alignments were performed with the degree of rotation relative to the peripheral arm restricted to ±20°. The average from each round of refinement was used as the reference for the next round. All references were masked to contain only one complex I peripheral arm density. For the bovine supercomplex, 324 subvolumes were averaged: 316 for Yarrowia , and 168 for Asparagus . Principal component analysis ( 32 ) was performed on all volumes using a mask around the expected position of complex III 2 or complex IV. Resolution was estimated by Fourier shell correlation on two half-sets after alignment. Subtomogram averages were filtered to reduce noise with the median filter (IMOD, ref. 53 ) or the Fermi Fourier filter [SPIDER ( 56 )] ( Fig. S8 ). All molecular fits and figures were produced in Chimera ( 57 ).
Show full methods section
Isolation of Mitochondria. Bovine heart mitochondria were isolated in 0.25 M sucrose and 0.1 M Tris⋅HCl, pH 7.4 ( 50 , 51 ). Yeast mitochondria were isolated from Y. lipolytica strain E129 in 0.6 M sorbitol and 0.1 M Tris⋅HCl, pH 7.4 ( 31 ). White asparagus shoots were purchased at a local supermarket and ground in a Waring blender in 400 mM mannitol, 25 mM Mops–KOH, pH 7.8, 10 mM EDTA, 10 mM DTT, 1% (wt/vol) PVP-40, and 0.01% (wt/vol) BSA (fatty acid-free), with added protease inhibitors. Mitochondria were isolated, fragmented, and washed in 400 mM mannitol, 10 mM Mops–KOH, pH 7.4, and 1 mM EDTA essentially as described for potato tubers ( 31 ), except that a self-forming Percoll density gradient (28%) was used instead of a step gradient. Sample Preparation for Cryo-ET. For bovine heart and Yarrowia , 20 µL of isolated mitochondria at a concentration of 4–5 mg/mL was diluted with 25 vol of osmotic shock buffer (10 mM Tris, pH 7.8). Asparagus mitochondria were diluted with 25 vol of SEM buffer (250 mM sucrose, 10 mM Mops–KOH, pH 7.2, 1 mM EDTA). Membrane fragments were pelleted by centrifugation (13,000 × g at 4 °C for 20 min) and resuspended in 15 µL of buffer. The suspension was mixed 1:1 with Fiducial markers (6- or 10-nm gold particles conjugated to protein A; Aurion) before being applied to glow-discharged quantifoil grids (R2/2) and plunge-frozen in liquid ethane using a home-made guillotine ( 52 ). Data Collection. Tomograms were collected as described ( 52 ) using a Krios transmission electron microscope (FEI) operating at 300 kV in microprobe mode. Single-axis tilt series (±60°, 1.5° intervals, start angle of 24°) were recorded on a K2 summit detector with postcolumn energy filter (Gatan Quantum 976) at a slit width of 20 eV. Nominal magnification in EFTEM mode was 33,000 (0.43 nm/px) for Y. lipolytica and 44,000 (0.33 nm/px) for bovine and asparagus membranes. Exposure times were adjusted automatically during tilt series acquisition to maintain a constant dose of 8 e − /px. The total dose per tilt series was kept below 80 e − /Å 2 . All tilt series were collected at 4- to 6-µm defocus with the automatic data collection program Latitude (Gatan). Tomogram Reconstruction and Subtomogram Averaging. Tilt series were aligned and tomograms were reconstructed using IMOD ( 53 ). Contrast was enhanced by nonlinear anisotropic diffusion ( 54 ). Subvolumes containing complex I were extracted from the unfiltered tomogram and aligned in PEET ( 55 ) using predefined angles calculated from the vector describing the position of the peripheral arm in relation to the membrane. Initial alignment was restricted to ±180° about the axis of the peripheral arm, using a single subvolume as initial reference. Subsequent alignments were performed with the degree of rotation relative to the peripheral arm restricted to ±20°. The average from each round of refinement was used as the reference for the next round. All references were masked to contain only one complex I peripheral arm density. For the bovine supercomplex, 324 subvolumes were averaged: 316 for Yarrowia , and 168 for Asparagus . Principal component analysis ( 32 ) was performed on all volumes using a mask around the expected position of complex III 2 or complex IV. Resolution was estimated by Fourier shell correlation on two half-sets after alignment. Subtomogram averages were filtered to reduce noise with the median filter (IMOD, ref. 53 ) or the Fermi Fourier filter [SPIDER ( 56 )] ( Fig. S8 ). All molecular fits and figures were produced in Chimera ( 57 ).
📊 Figures
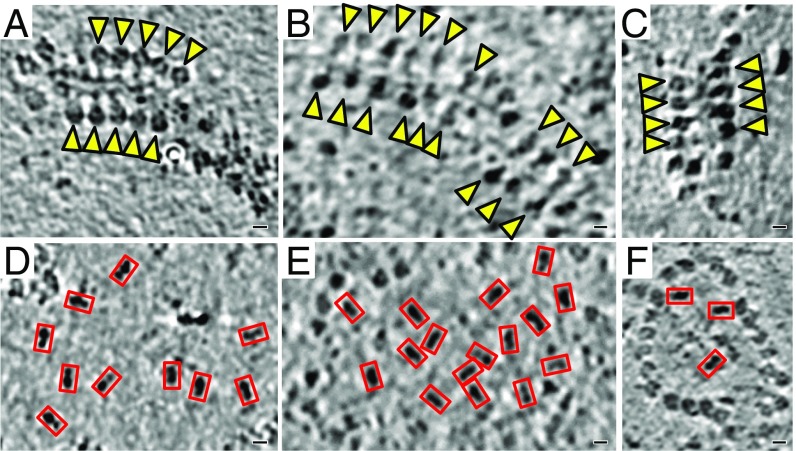
Fig. 1.
Distribution of complex I and ATP synthase. Tomographic slices of mitochondrial membranes from bovine heart ( A and D ), Y. lipolytica ( B and E ), and A. officinalis ( C and F ) indicating the organi...
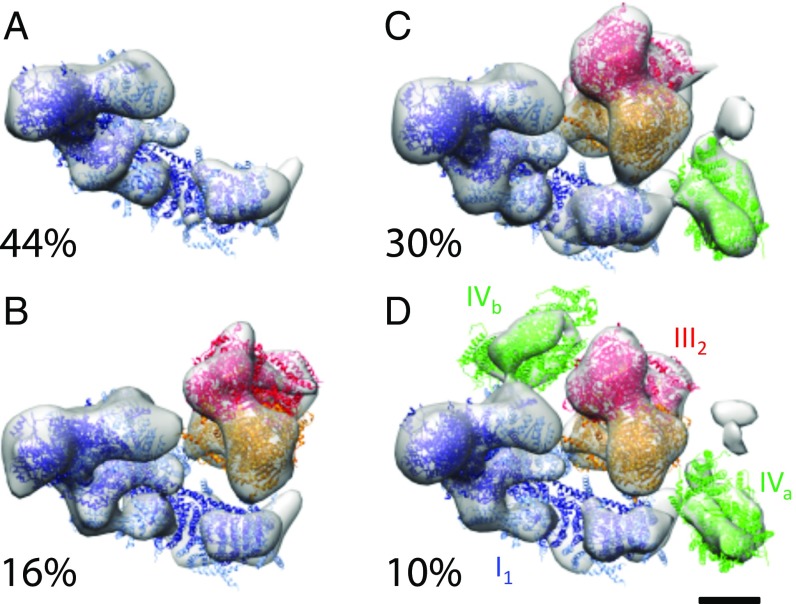
Fig. 2.
Respiratory chain supercomplexes in bovine heart mitochondria. Subvolumes centered on the matrix arm of complex I were aligned and averaged using a tight mask and then classified based on the presence...
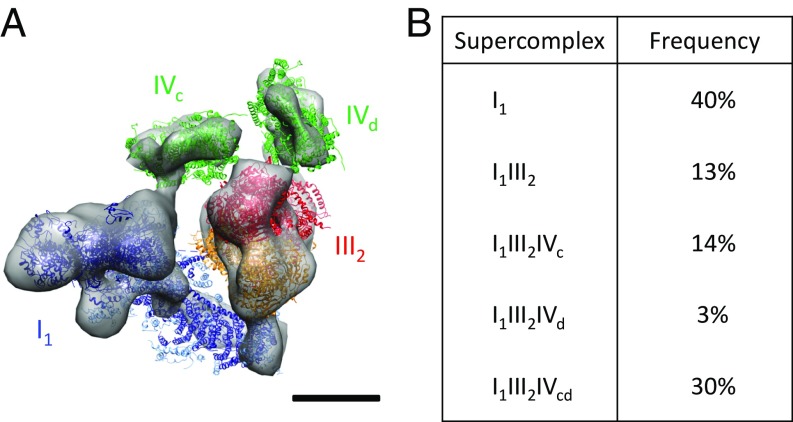
Fig. 3.
Respiratory chain supercomplexes of the yeast Y. lipolytica . ( A ) Subtomogram average of the I 1 III 2 IV cd supercomplex. Blue, complex I (PDB ID code 4WZ7); red/orange, complex III dimer (PDB ID c...
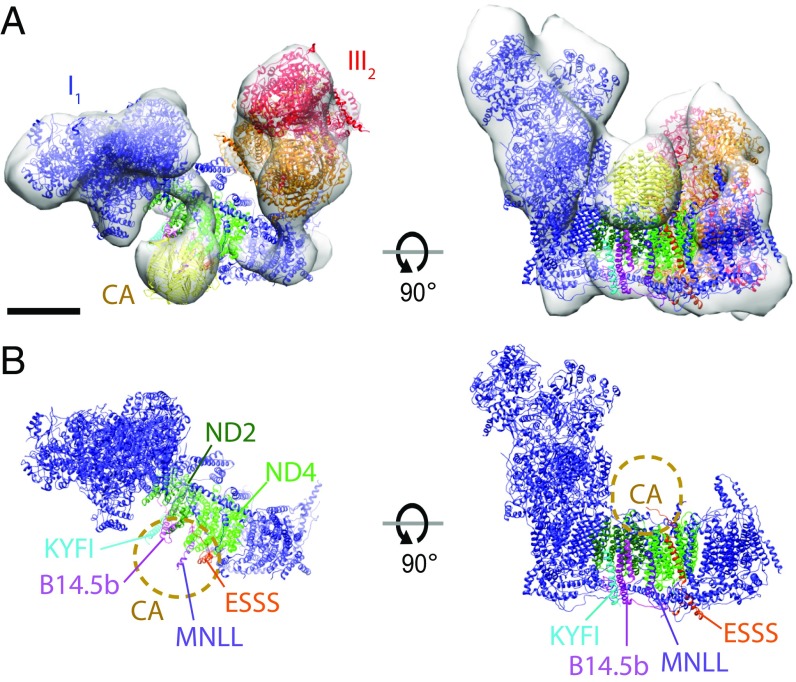
Fig. 4.
The plant respiratory chain supercomplex. ( A ) Subtomogram average (transparent gray) of the A. officinalis I 1 III 2 supercomplex with fitted atomic models. Red/orange, complex III 2 (PDB ID code 1B...
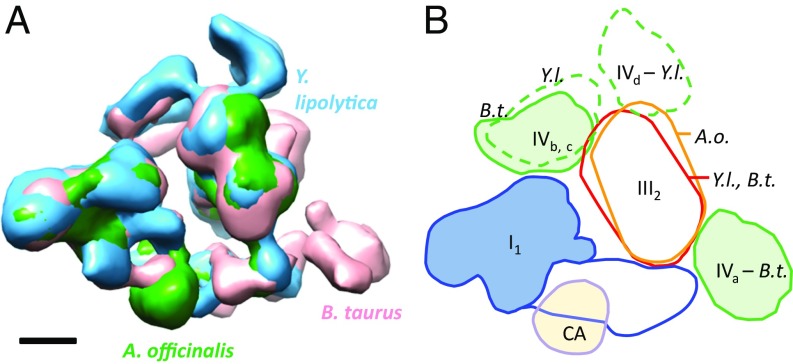
Fig. 5.
Comparison of supercomplexes from three eukaryotic lineages. ( A ) Subtomogram averages of bovine heart, Y. lipolytica , and A. officinalis supercomplexes were aligned on complex I volumes. ( B ) Sche...
Figure images are served from the NIH/NLM PubMed Central Open Access Subset or Europe PMC; copyright remains with the publishers and authors.
💬 Discussion
0 commentsNo comments yet. Be the first to start a discussion!
Leave a Comment