Abstract
Inhibition is fundamental to information processing by neural circuits. In the olfactory bulb (OB), glomeruli are the functional units for odor information coding, but inhibition among glomeruli is poorly characterized. We used two-photon calcium imaging in anesthetized and awake mice to visualize both odorant-evoked excitation and suppression in OB output neurons (mitral and tufted, MT cells). MT cell response polarity mapped uniformly to discrete OB glomeruli, allowing us to analyze how inhibition shapes OB output relative to the glomerular map. Odorants elicited unique patterns of suppression in only a subset of glomeruli in which such suppression could be detected, and excited and suppressed glomeruli were spatially intermingled. Binary mixture experiments revealed that interglomerular inhibition could suppress excitatory mitral cell responses to odorants. These results reveal that inhibitory OB circuits nonlinearly transform odor representations and support a model of selective and nonrandom inhibition among glomerular ensembles.
🔬 Techniques
✨ Fluorophores
🧪 Sample Preparation
🏭 Microscope Brands
🏛️ Research Organizations (ROR)
Affiliated research institutions:
📋 Methods
Details of all procedures are provided in Supplemental Information . Briefly, experiments were performed on male and female mice expressing Cre recombinase (Cre) in defined neuronal populations. The mouse strains used were: PCdh21-Cre ( Nagai et al., 2005 ), Ai38 ( Zariwala et al., 2012 ), and CCK-IRES-Cre (Jackson Labs). Cre-dependent expression of GCaMP3 or GCaMP6f in MT cells was achieved by crossing with the Ai38 GCaMP3 reporter line (for CCK-IRES-Cre mice) or by injection of viral vectors as described previously ( Wachowiak et al., 2013 ). In vivo two-photon imaging was performed as described previously ( Wachowiak et al., 2013 ) under pentobarbital or isoflurane anesthesia or in awake mice. No difference in response properties measured under the two anesthetics were observed, and so data from both conditions were pooled. To control inhalation timing, mice were tracheotomized and artificial inhalation was used to decouple breathing and odorant stimulation in anesthetized mice ( Wachowiak and Cohen, 2001 ). For imaging in awake mice, animals were acclimated for at least two 30-minute sessions prior to data collection.
📊 Figures
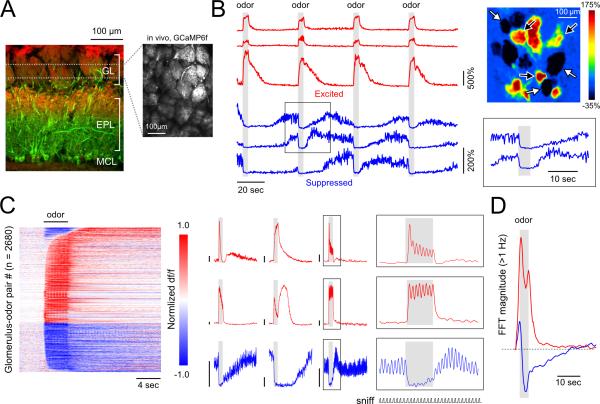
Figure 1
Odorant-evoked excitation and suppression map to discrete OB glomeruli in anesthetized mice
A. Left: Reference image showing retrograde GCaMP expression in piriform cortex-projecting mitral and tufted (pcMT) cells, in this case expressed in a PCdh21-Cre:Rosa26-tdTomato mouse (to better visua...
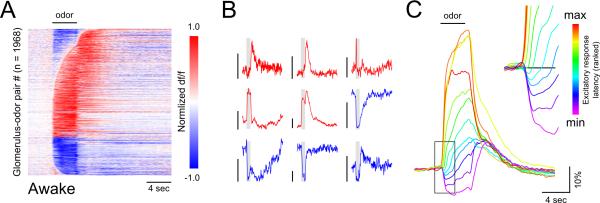
Figure 2
Suppressive odorant responses are prominent and impact response dynamics among OB glomeruli in awake mice
A. Response time series across all glomerulus-odorant pairs imaged from pcMTs in glomeruli of awake mice, normalized and plotted as in Figure 1 . B. Example traces from individual glomerulus-odorant p...
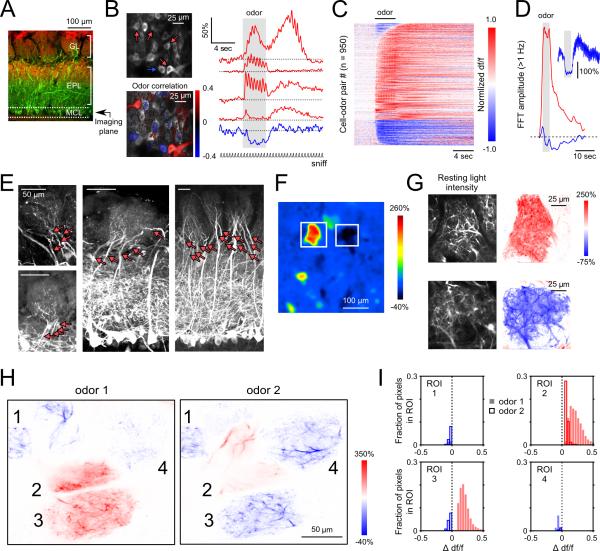
Figure 3
Excitatory and suppressive odorant responses are interspersed among pcMT cell somata and are shared across sister pcMT cells in the same glomerulus
A. Reference image indicating imaging plane targeting pcMT somata. B. pcMT cells imaged in vivo ( top left ) and fluorescence time series ( right ) from select somata showing distinct temporal pattern...
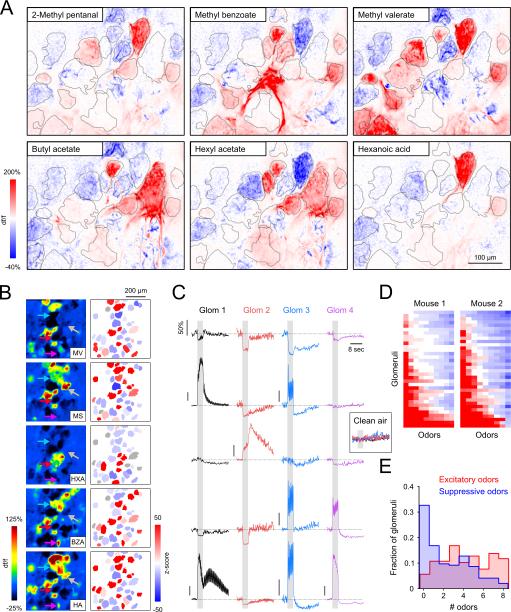
Figure 4
Glomerular response polarities are highly interspersed and odorant-specific
A. Maps of glomerular MT cell responses (GCaMP6f) evoked by six odorants imaged across the same field of view in an anesthetized mouse. Red and blue indicate fluorescence increases and decreases, resp...
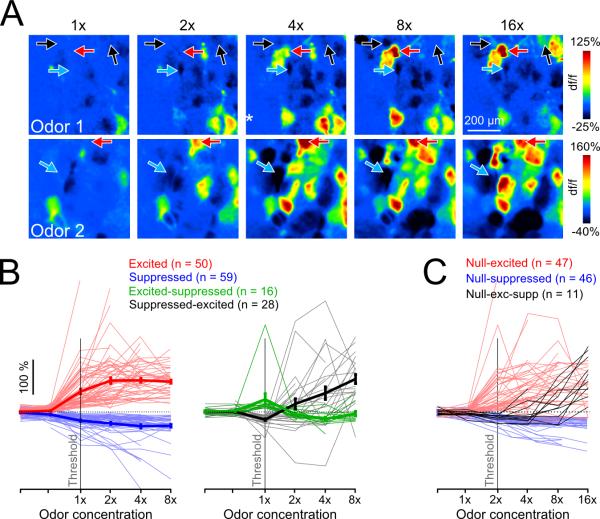
Figure 5
Glomeruli show diverse patterns of pcMT excitation and suppression across odorant concentration
A. Pseudocolor df/f maps of glomerular responses to increasing odorant concentration from two representative experiments (Odor 1, ethyl butyrate; Odor 2, methyl valerate). Arrows indicate glomeruli th...
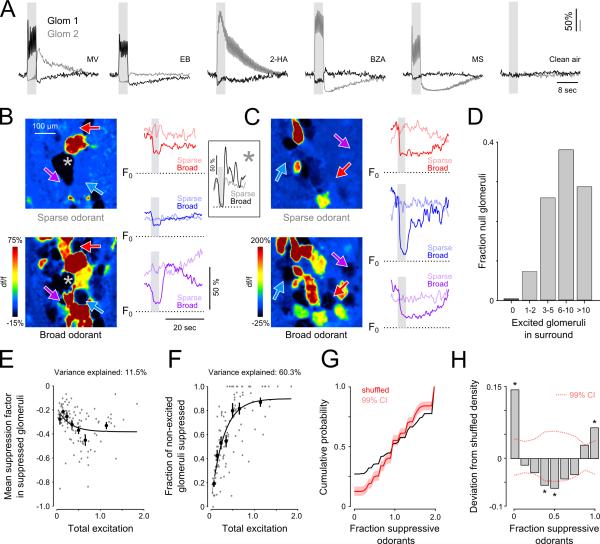
Figure 6
Spatial patterns of glomerular output do not fit a model of global interglomerular inhibition
A. Odorant-evoked responses of two glomeruli imaged in the same field of view to five odorants and clean air. Excitation in one glomerulus is accompanied by suppression in the other glomerulus for all...
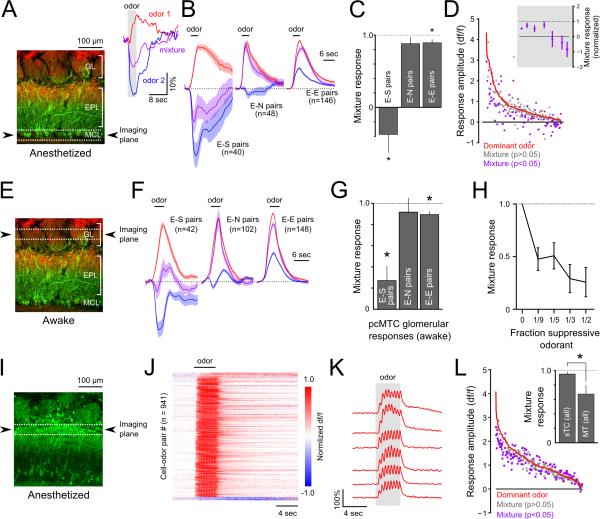
Figure 7
Suppressive odorants inhibit excitation by other odorants in mitral but not superficial tufted cell populations
A. Left: Reference image showing schematic of imaging plane, targeting MT cell somata, used for panels C-E. Inset: Example of an MT cell response to an excitatory odorant (red), a suppressive odorant ...
Figure images are served from the NIH/NLM PubMed Central Open Access Subset or Europe PMC; copyright remains with the publishers and authors.
💬 Discussion
0 commentsNo comments yet. Be the first to start a discussion!
Leave a Comment